Threats & Exploits
- Latest Dynatrace
- App
About the app
What you'll learn
-
Monitor detection findings and detect targeted vulnerabilities.
-
Filter, format, group, and sort results to structure and refine your analysis.
-
Visualize findings to understand trends and distributions.
-
Enrich findings with external reputation data.
-
Assess affected objects and understand overall system impact.
-
Identify and safeguard critical applications.
-
Monitor real-time security coverage.
Target audience
 Threats & Exploits is dedicated to DevSecOps, security engineers, and security architects.
Prerequisites
Depending on the type of ingested data you want to monitor with  Threats & Exploits (data from your Dynatrace-monitored environment or from third-party sources), the following requirements must be met:
Permissions
For a list of permissions required, go to Hub, select  Threats & Exploits, and display Technical information.
 Threats & Exploits streamlines the triage of detection findings, offering an up-to-date view of the application security threat landscape enhanced by Dynatrace deep observability. It helps you immediately detect zero-day vulnerabilities and take defensive measures to protect against exploitation.
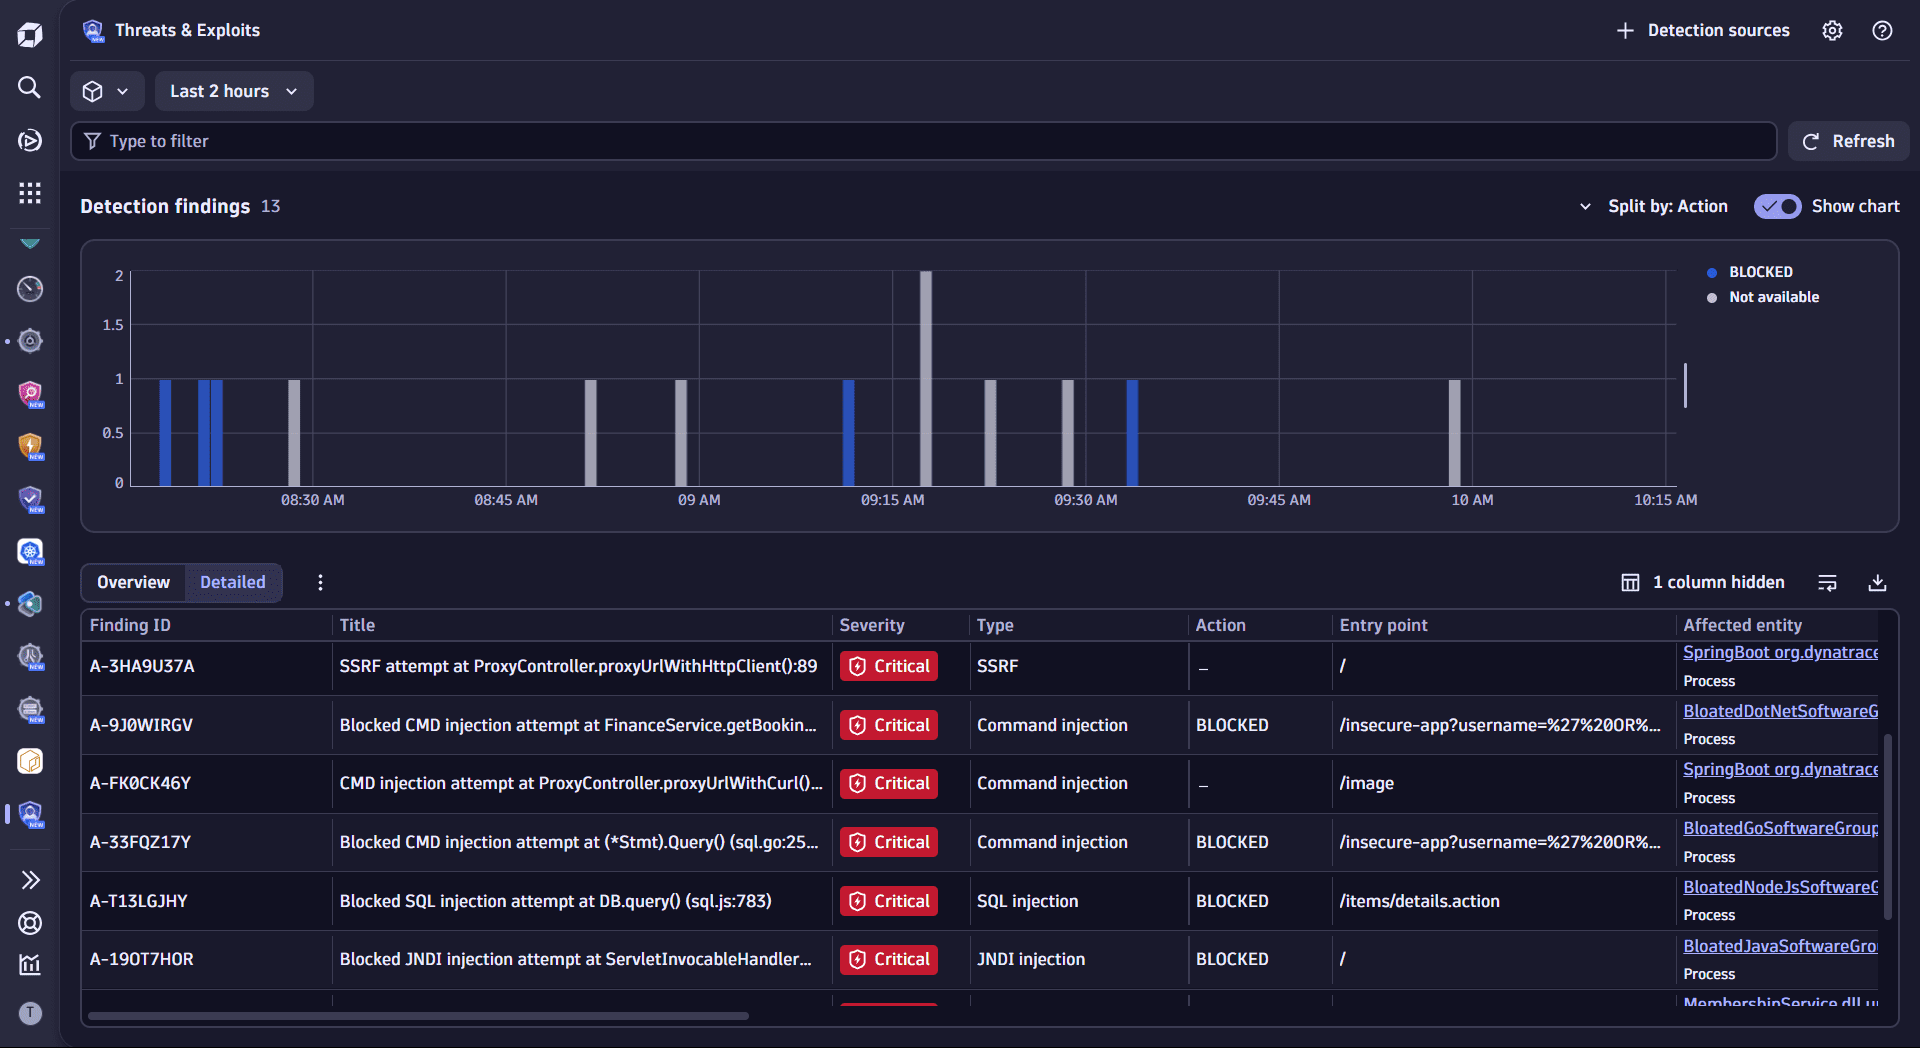
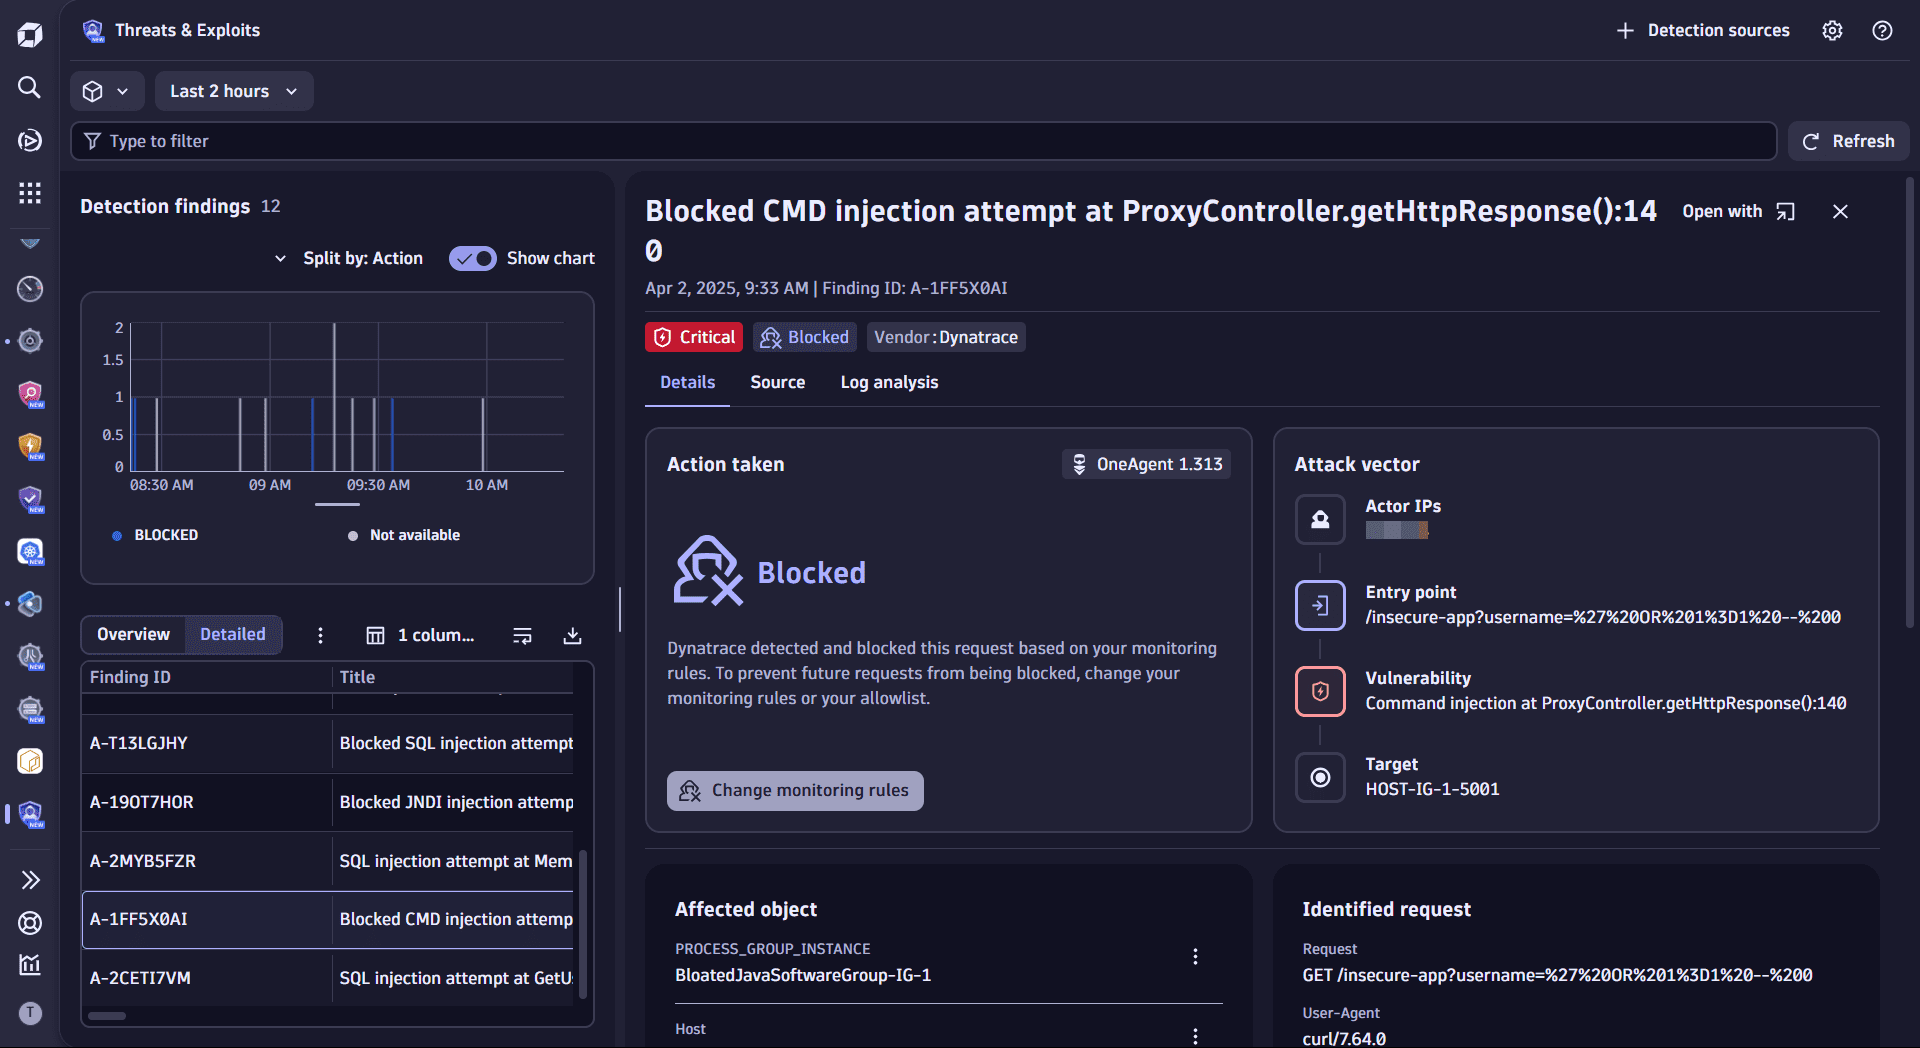
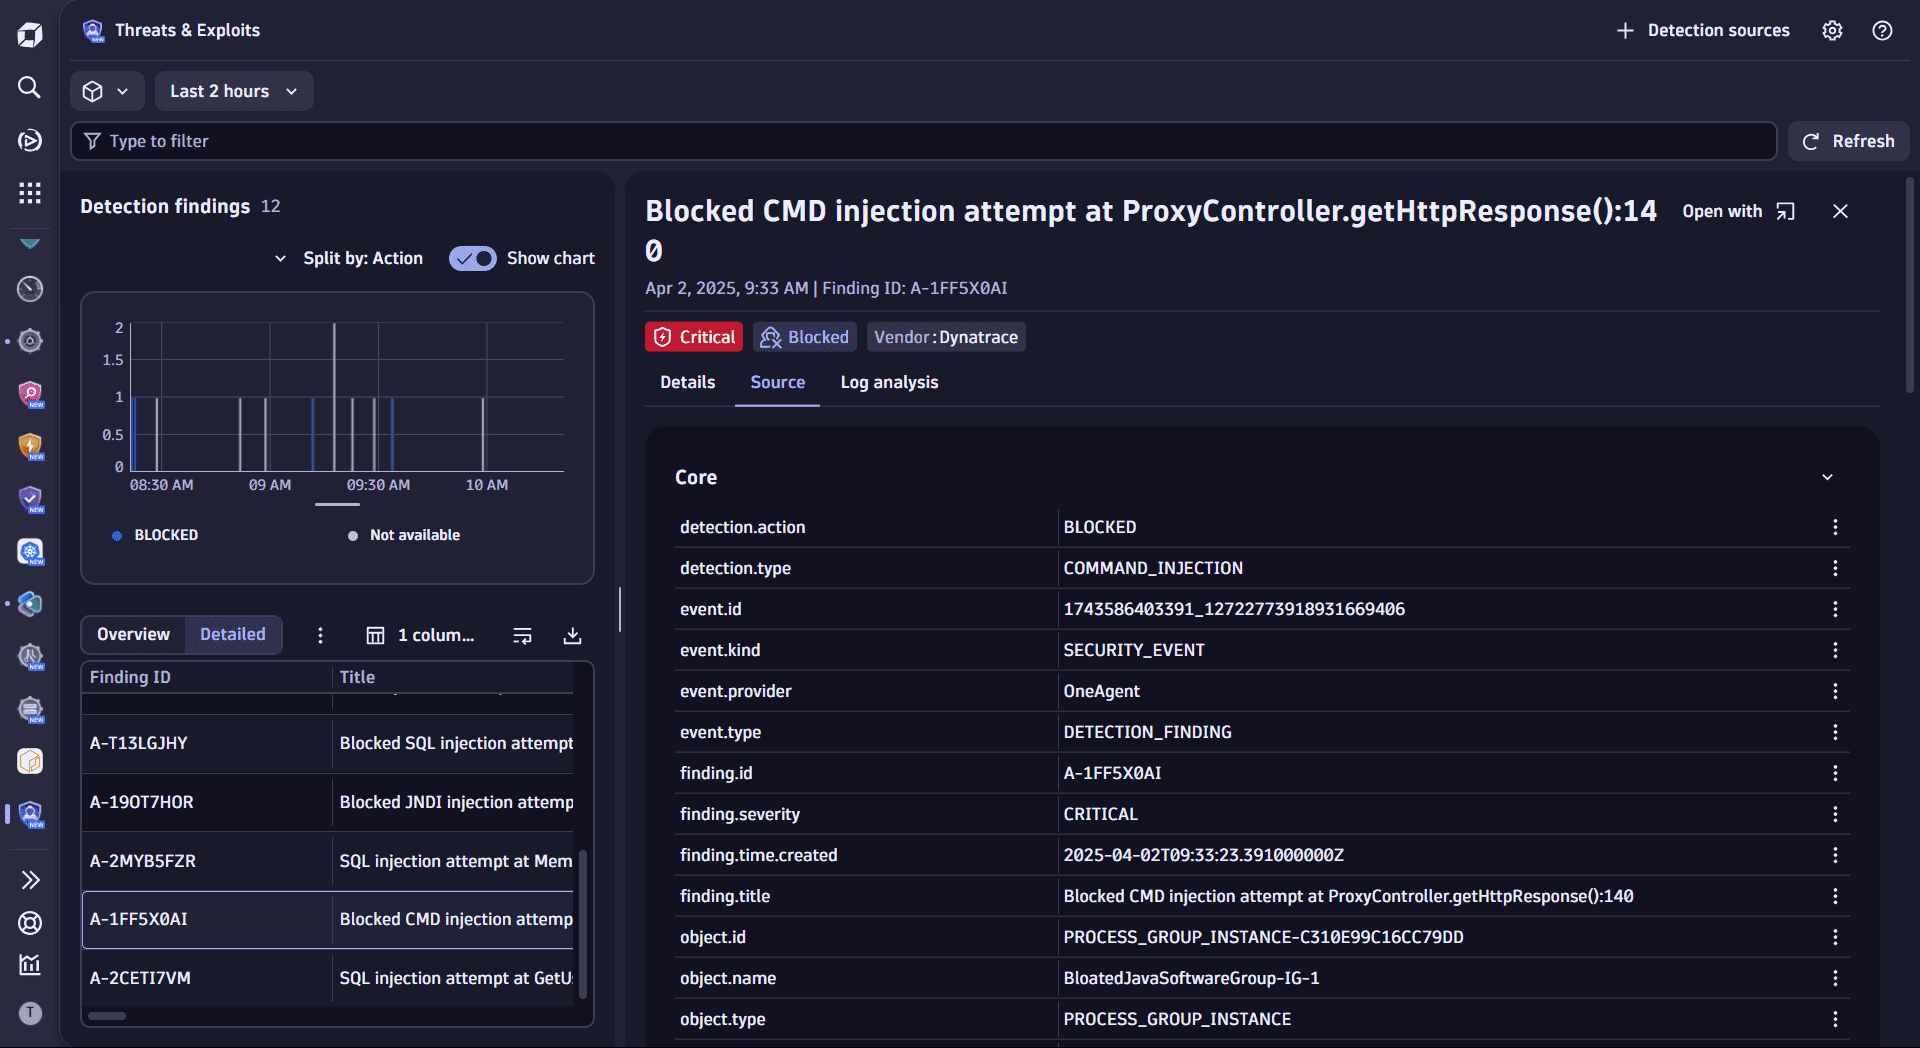
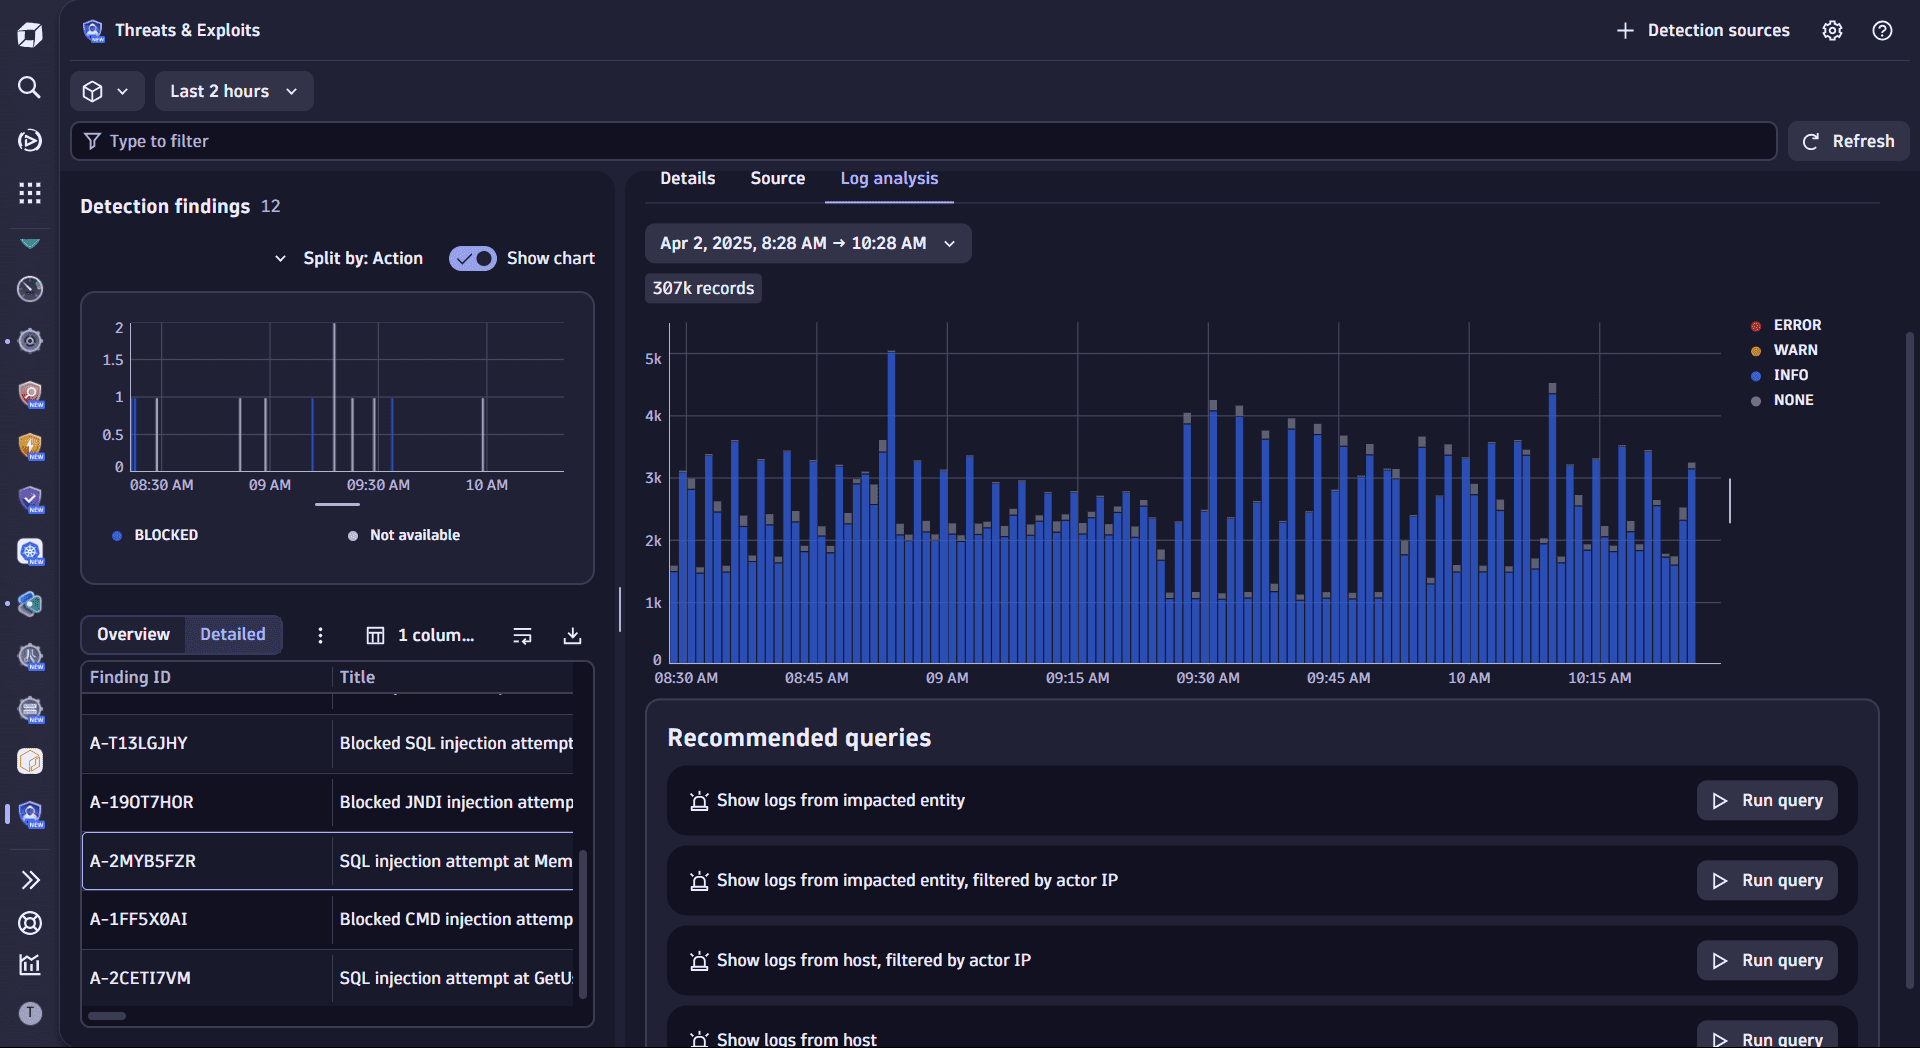
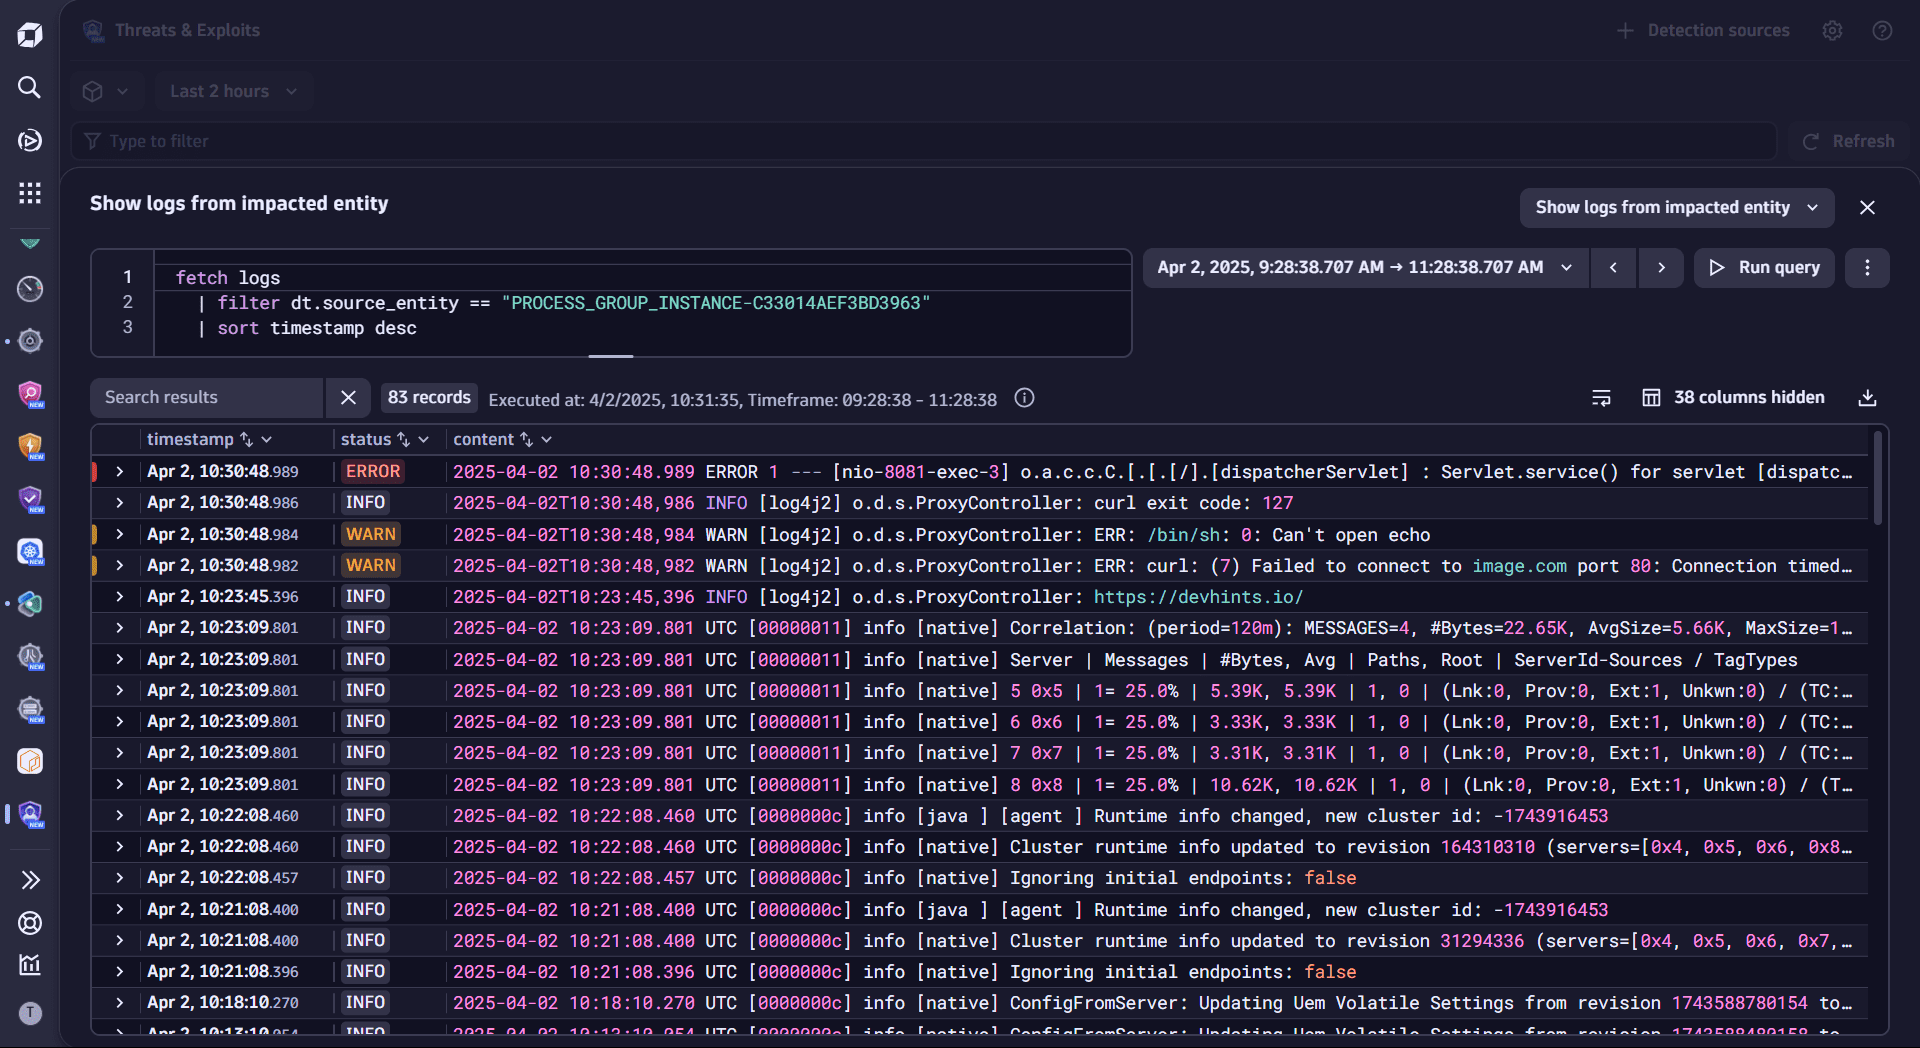
Once you open  Threats & Exploits, you can see the list of findings from your ingested data.
- To add an integration, go to Detection sources and select one of the available options in Integrations.
- To configure your Runtime Application Protection settings, go to Detection sources and select Runtime Application Protection > Set up.
Learning modules
- Explanation
- Concepts that are specific to the Dynatrace Threats & Exploits app.
- How-to guide
- Filter, format, and sort detection findings.
- How-to guide
- Drill into detection findings for detailed information.
- How-to guide
- Interact with other apps for further insights and share results with stakeholders.
 Threats & Exploits