Upgrade Problems Classic to Problems on Grail
- Latest Dynatrace
- Upgrade guide
- 2-min read
If you analyze incidents in your environment in Dynatrace and use the problems feed and problem details page, you can improve your experience with the new  Problems, backed by data from Grail.
Why upgrade?
You can use  Problems Classic and the latest Problems side by side. By upgrading to Problems, you can unlock new capabilities and functionality. For example, with the latest Problems you can:
- Focus on what matters with dynamic segment-based filtering.
- Speed up ownership using customizable, Grail-powered problem attributes.
- Link troubleshooting guides to problems for improving future remediation.
- Gain improved root cause insights with the redesigned Visual Resolution Path.
- Analyze and automate problems end-to-end with the full Grail and DQL access.
- Apply consistent, record-level access controls using Dynatrace IAM.
- Investigate faster with context handoff, such as drill-downs in the
 Kubernetes or
  Distributed Tracing, across Dynatrace apps.
 - Build higher-signal automation using precise problem and intelligence triggers.
What is new?
When you upgrade to the Problems, the core backend RCA engine continues to operate unchanged, while the user experience is upgraded in the following ways:
- Upgraded UI, including the problem feed, problem details view, and investigation mode.
- New data filtering options, such as segments and ad hoc filtering, which allow you to apply dynamic filters.
- Addition of custom problem fields, which you can define and display in addition to default problem fields.
- Dynatrace Intelligence summaries and guided RCA drill-downs.
You can continue using the Problems Classic alongside Problems for now. However, Dynatrace is currently in the process of complete transition from Problems Classic to Problems.
Layout
The problem feed allows operations and SRE users to review all incoming active problems and the history of resolved ones. The general feed layout and structure is preserved in Problems, ensuring a smooth upgrade with little visual changes.
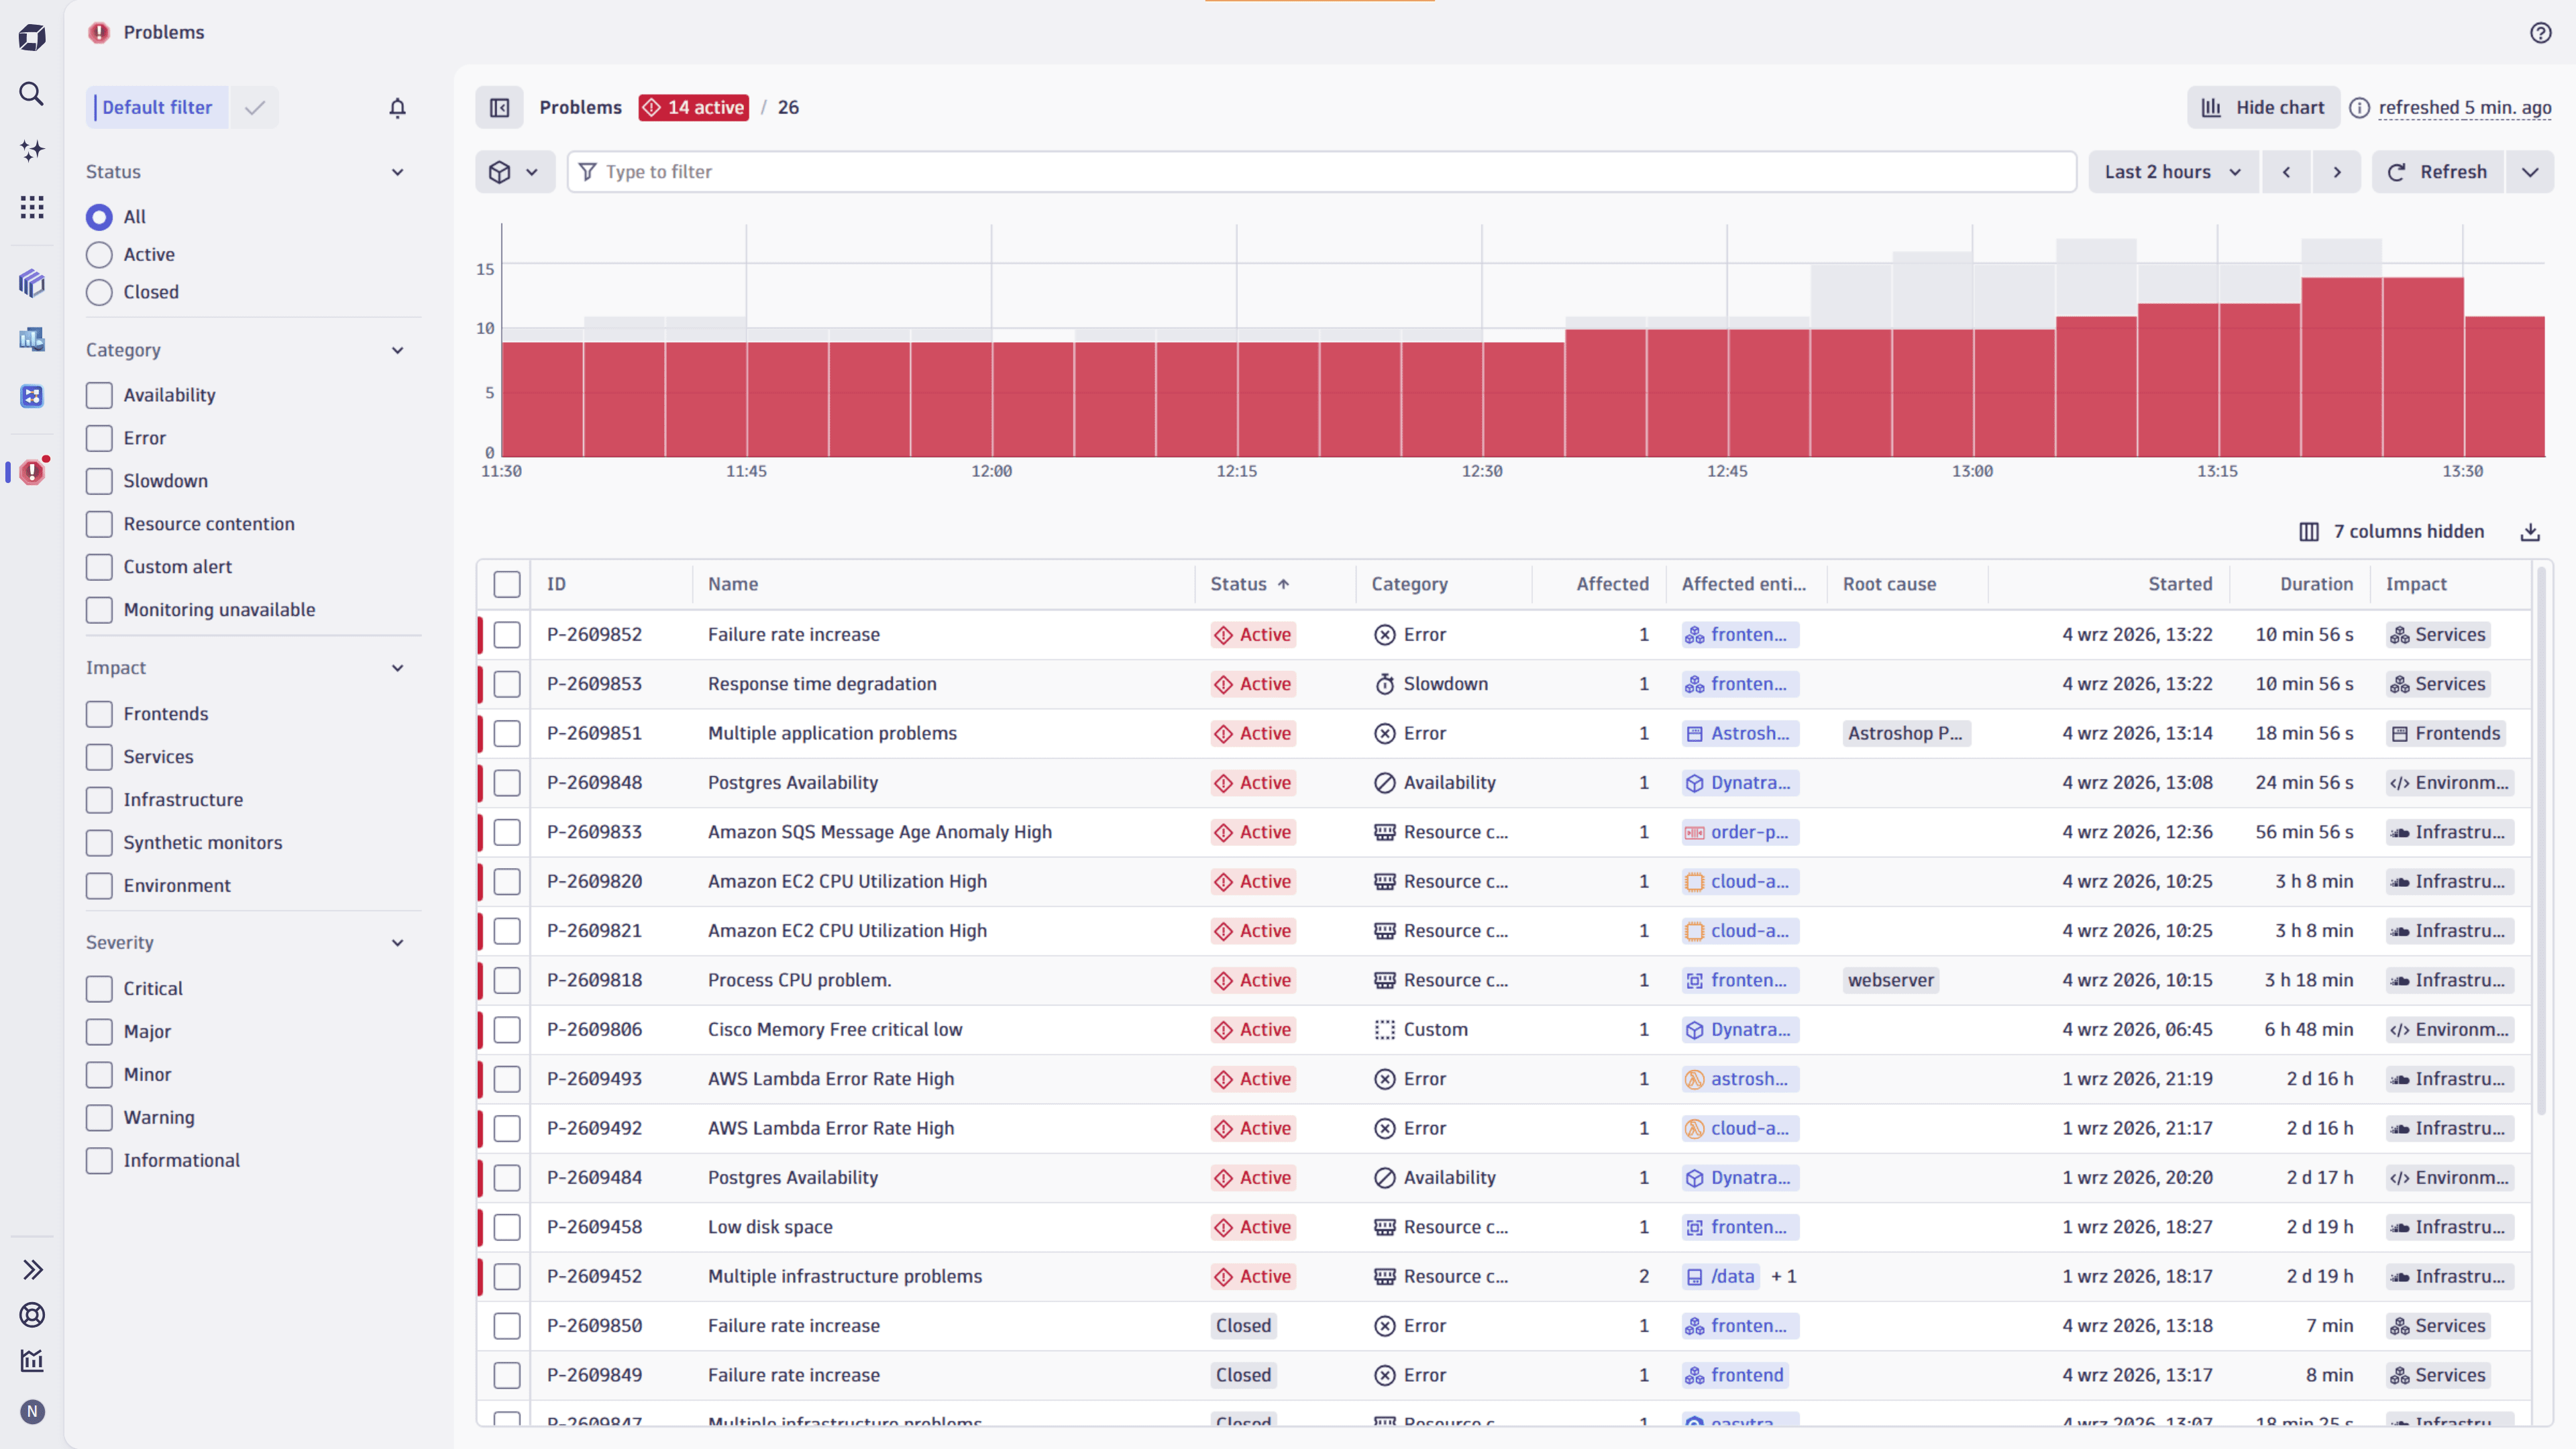
The problem feed layout in Problems features a similar problem feed with a filter bar, chart, column table, and a left side panel with default filters. Additionally, Problems introduces a number of new elements, such as:
-
The global problem indicator: the indicator located above the filter bar reflects the number of active and all problems (for example,
14 active/25) based on your access and applied filters. Both Problems Classic and Problems source and list the same generated problems, which means that the number of problems is identical between the apps. -
Segments and dynamic filters: left to the filter bar, you can find segments , predefined filters used for quickly filtering the data. You can use a set of team-specific segments and choose one or more segments to apply pre-made filters relevant to your area. Additionally, you can apply your own dynamic filters in the filter bar, choose the timeframe, refresh the feed to apply new filters, and set the automatic refresh with available interval options.
Segment filters replace the Management Zone filters.
-
User-defined columns: you can rearrange the column order and search, hide, and display specific columns, tailoring the feed to your needs. You can customize column settings by selecting Columns.
-
Custom problem fields: in addition to standard fields propagated to
Problems by default, you can create and modify custom fields like app.id,aws.regionto include relevant information. -
Downloading table data: you can download all table data or selected rows in CSV format by selecting .
-
New default filters: Status, Impact, and Severity filters on the left panel, present in
Problems Classic, are also featured in Problems. However, Severity filter in Problems allows you to choose the level of problem severity from InformationaltoCriticalin alignment with ITIL framework standard. A problem category can be chosen from the Category filter instead.
Global problem indicator and default problem filters
The global problem indicator displays a total number of currently active problems. The count is based on your platform policy-related read access within the problem events table in Grail and on the default filter that you have set in the problem feed.
In the latest Dynatrace, the global problem indicator is always visible at top of the Problems app and in the dock, regardless of which app you are currently working in.
Access policies that are defined on top of events reduce the number of problems you can see both in the problem feed and in the global problem indicator. Additionally, if you set a personal default problem filter directly within the problem feed, it'll also apply to the global problem indicator and impact how many active problems you see. For example, you can reduce the global active problem count by configuring the default filter categories on the side panel. You can save your new default filter by selecting as seen below:
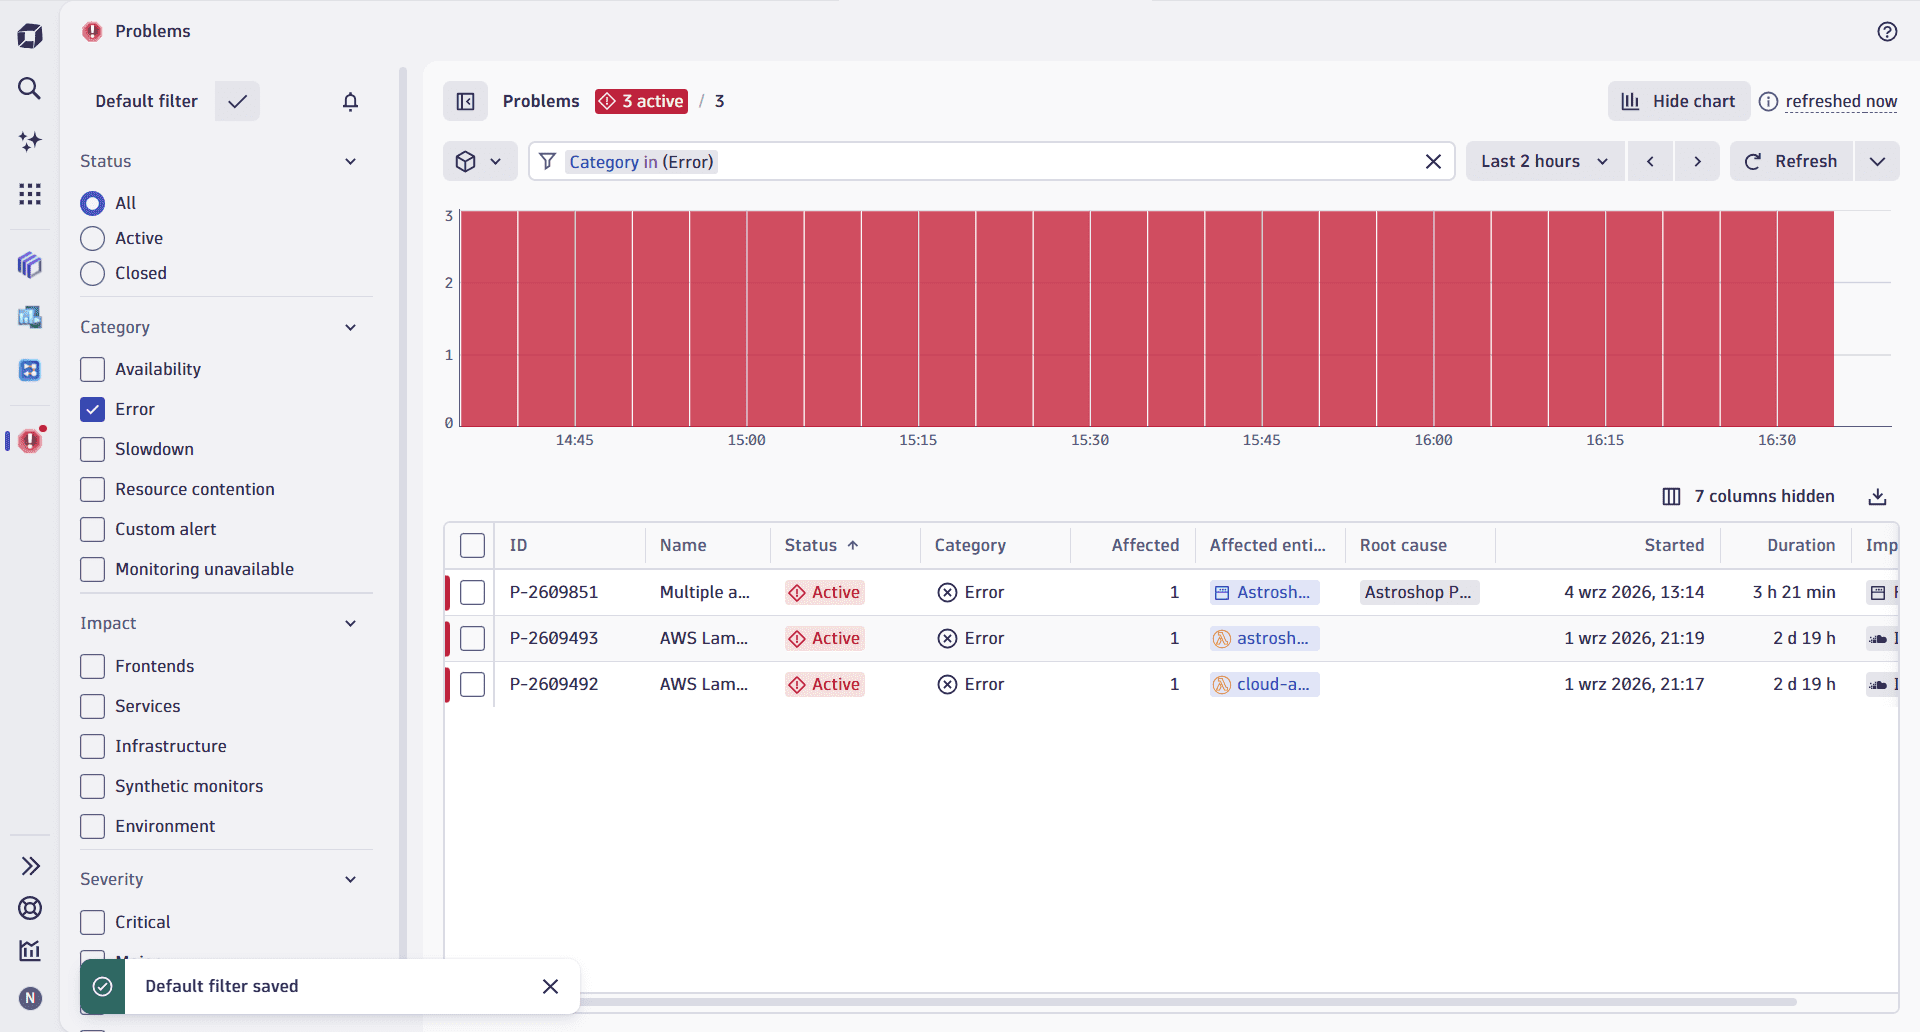
You can also turn on email notification for problems matching the default filter by selecting > Turn on notifications.
Segment filters and data segmentation
Segment filters were introduced across the Dynatrace platform to replace Management Zones for UI-based filtering and sharing preconfigured filters to onboard your teams.
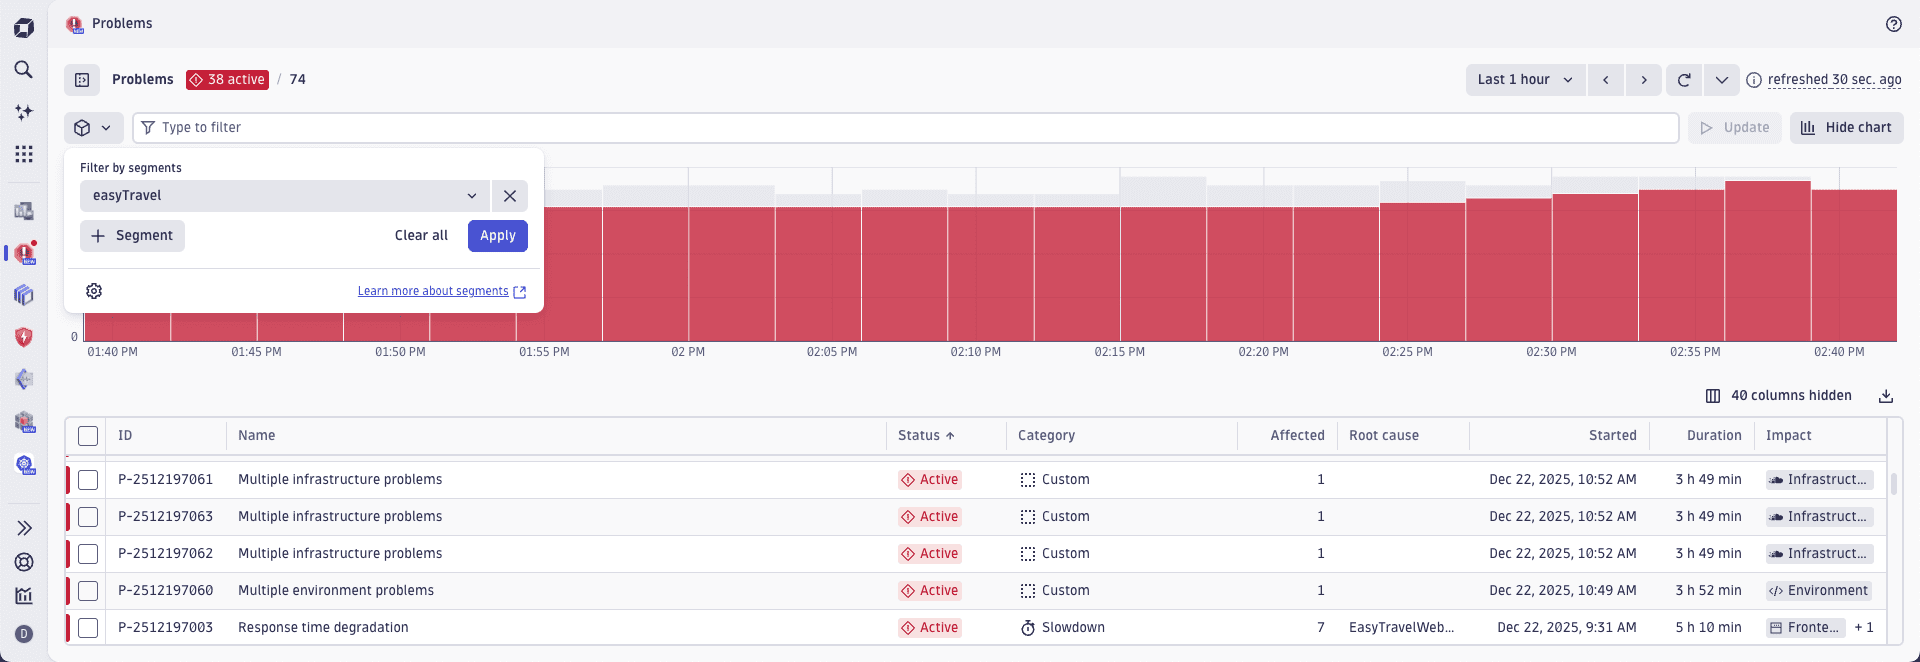
Compared to Management Zones,  Segments help your teams manage their filters by offering the ability to use variables that form dynamic conditions of include blocks. This allows you to avoid creating multiple individual configurations and helps deduplicate other segments. By defining one variable that uses Grail field values, multiple individual management zones can be replaced with a single segment config as shown below:
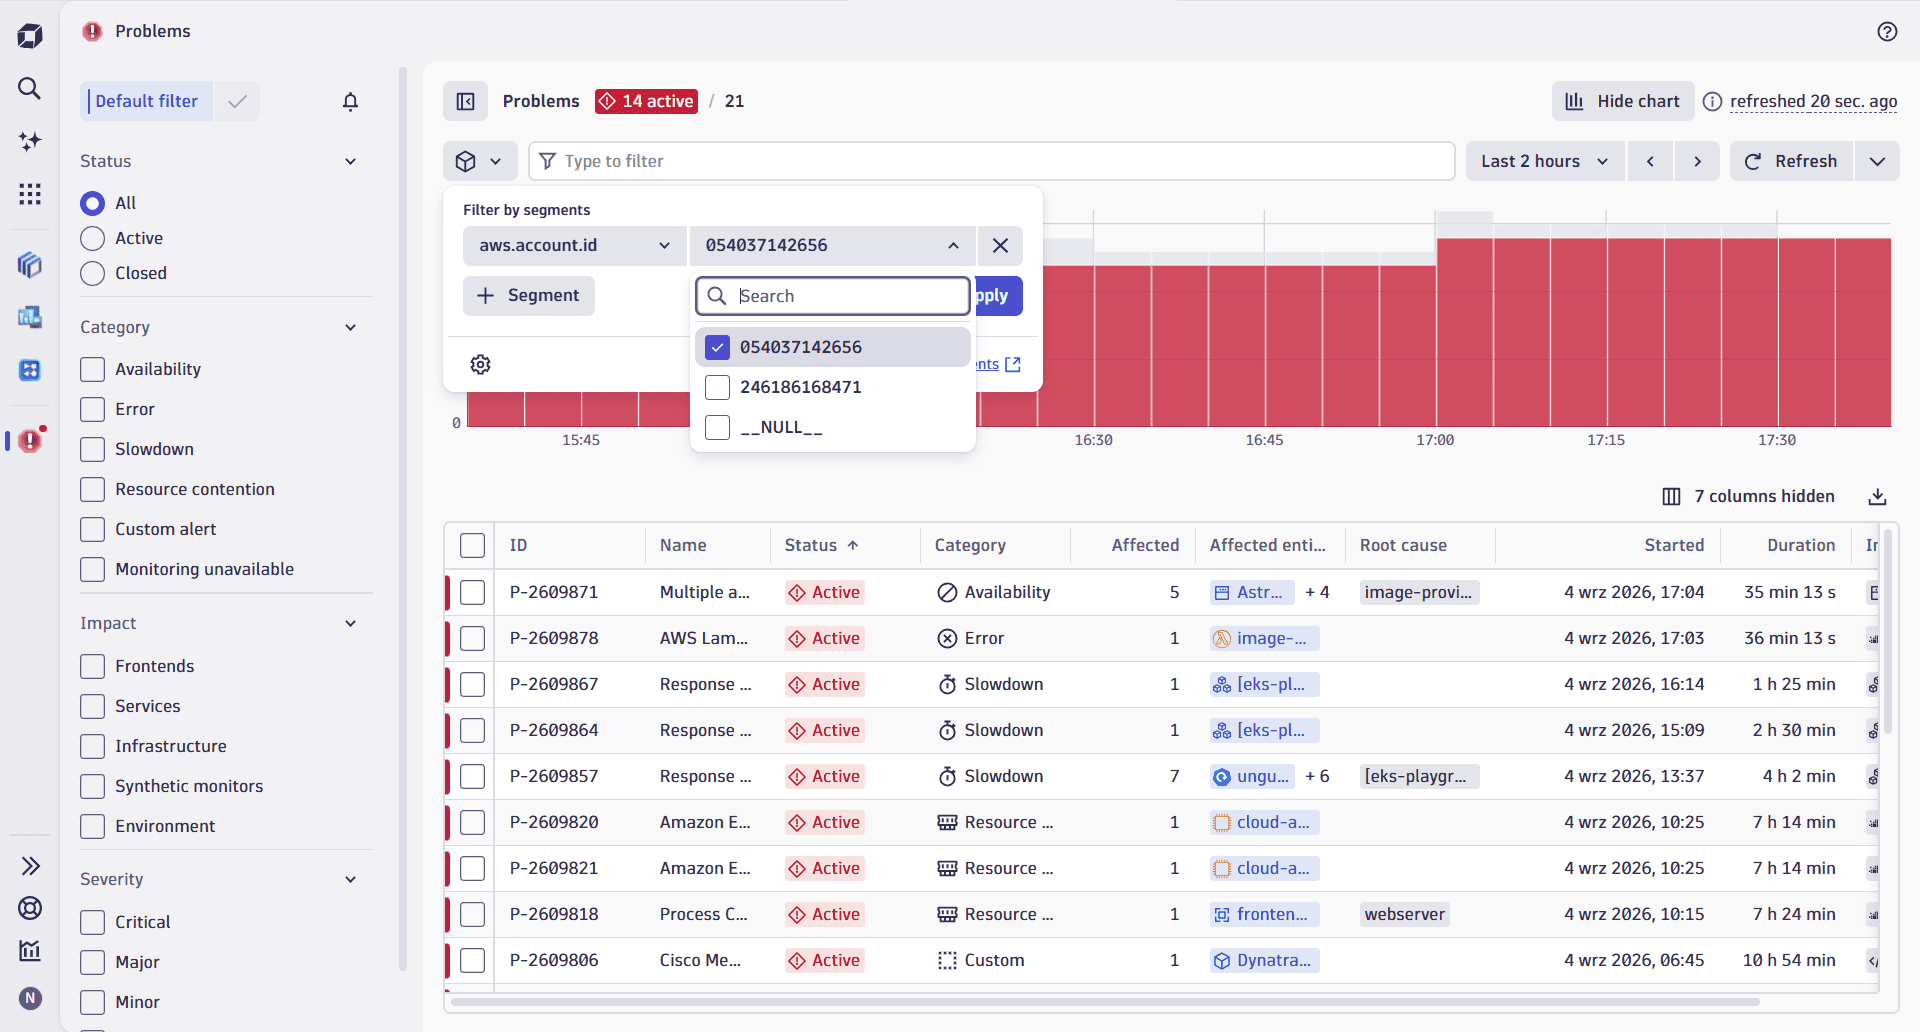
Instead of creating a separate management zone per AWS account ID, you can use a single segment with several selectable ID variables instead.
Filtering the problem feed with filter bar
Aside from Segment filters, the new problem feed offers multiple ways of filtering open problems for improved triaging including the filter bar.
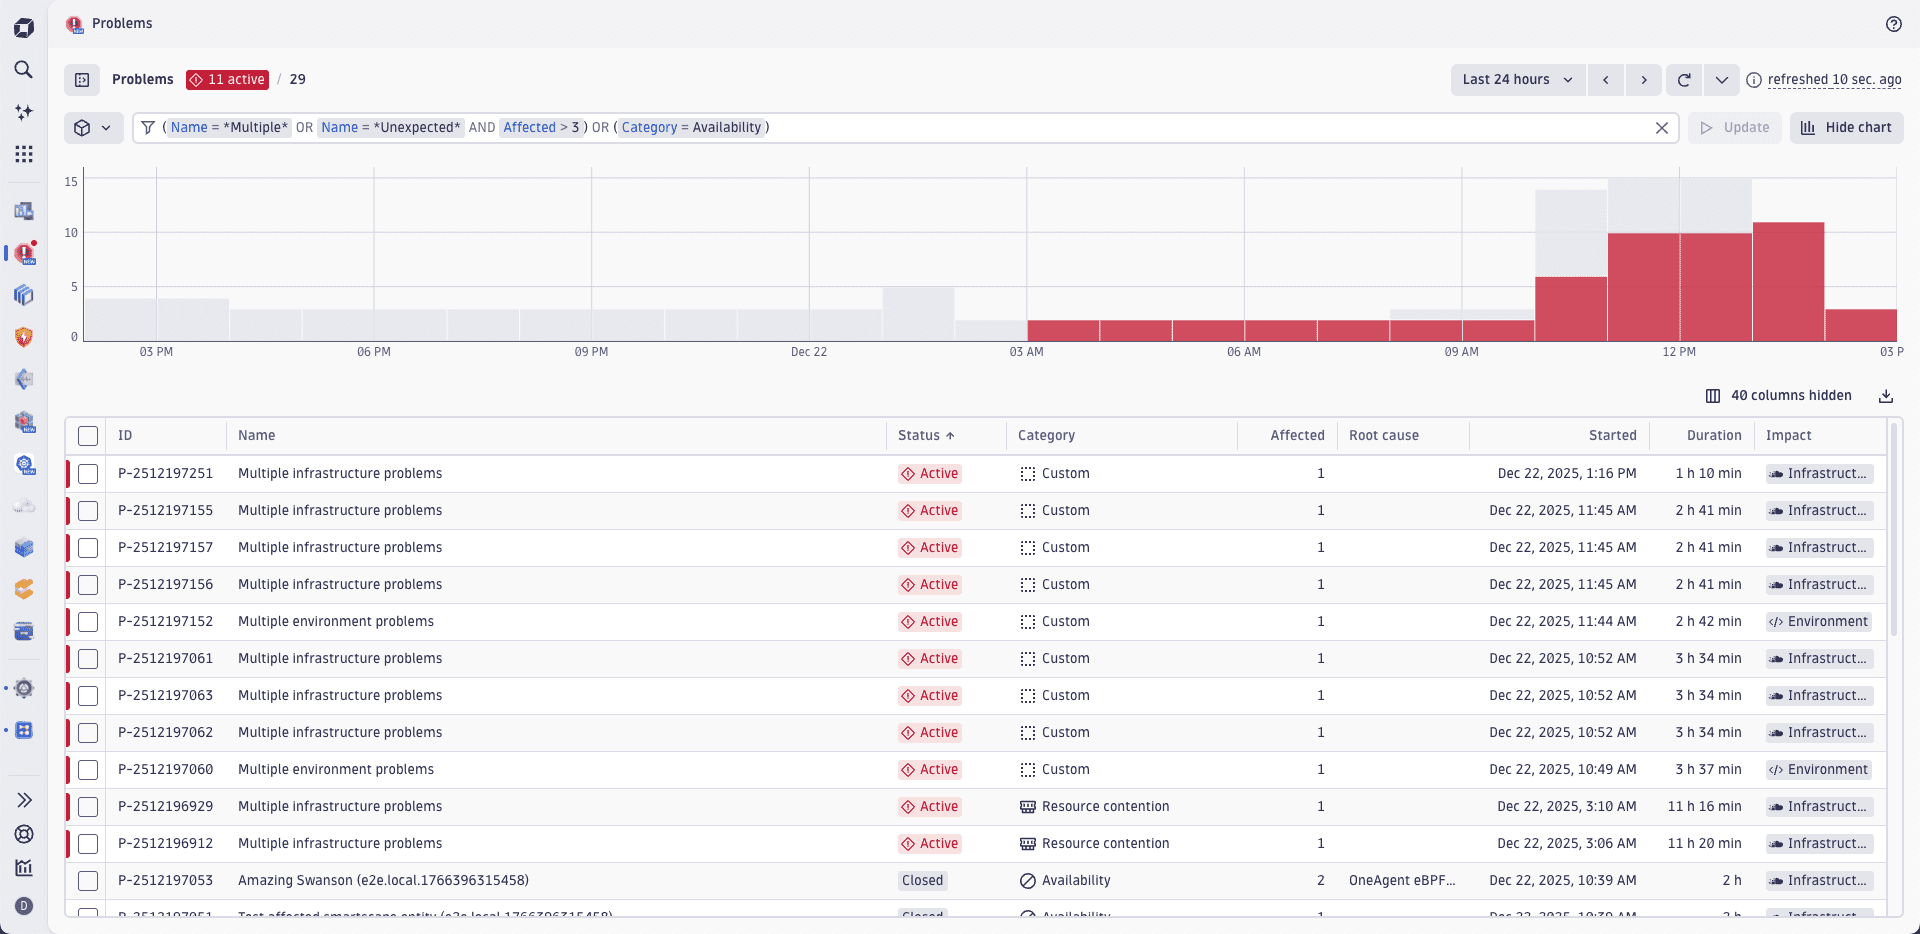
The filter bar offers a number of filter possibilities such as logical operators AND and OR combined with complex filter statements and the possibility to use wildcard text filtering as shown below:
Custom problem fields and user-defined columns
Problems introduces a new feature unavailable in Problems Classic—custom problem fields that you can define and display in the problem feed. By surfacing customer-specific information within the problem feed, operation teams can speed up the process of triaging the ownership and responsibility of incoming problems.
By configuring which event fields are extracted and propagated into a problem via  Settings, you can:
- Decide which columns should be used and included in the problem feed.
- Define which event information you want to display directly in problems.
Custom problem fields can also be used in any problem DQL query in  Notebooks and
  Dashboards.
Additionally, you can use Settings to check which fields are surfaced in problems and where they come from. For example, policy-relevant fields such as cloud.region, dt.host_group.id, or k8s.cluster.name and fields related to cost allocation, such as dt.cost.costcenter or dt.cost.product, are displayed in problems by default. The owner of these default fields is listed as Problems, indicating that they come from the app and weren't created by a user.
Problem details
Similar to Problems Classic, Problems provides a problem details page that shows impact and root cause of a larger scale incident.
The details page is structured similarly to Problems Classic, where the key important information about the problem is shown in the header, such as the problem name, its status, unique problem number (for example, P-25032996), its category (for example, Error), and its start time and duration.
Additionally, the problem header in Problems offers a possibility to ask Dynatrace Intelligence to summarize the entire problem and provide hints about possible remediation steps. You can do so by selecting Explain problem.
In Problems, the problem details page shows the general information at the top, the impact on the left side and surfacing the root cause on the right side.
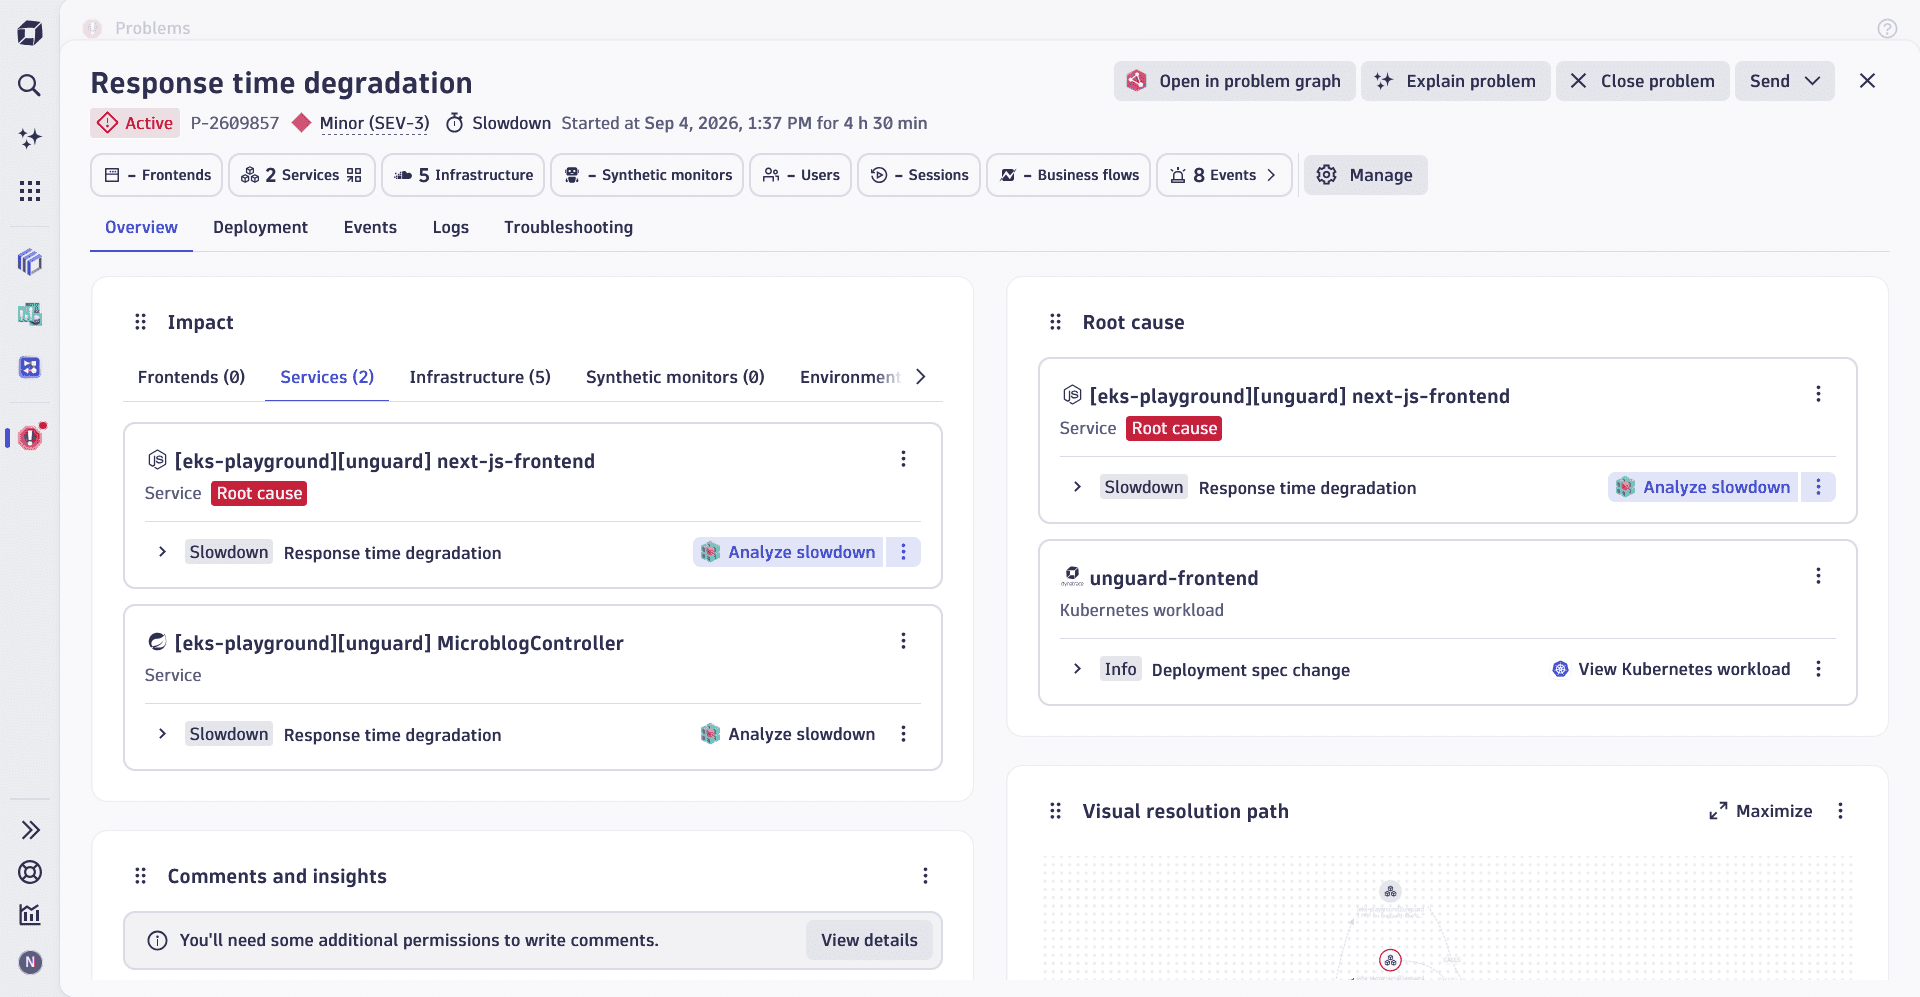
The general information at the top of the page includes a number of KPI measures, such as the number of affected SLOs, affected frontends, affected services, infrastructure entities, and the number of affected users.
You can see the root cause identified by the Dynatrace causal AI highlighted in red both in the Impact on the left and the Root cause on the right side of the details page in the Overview tab. Aside from the general key data, the Overview tab shows a list of connected running workflows below the Visual resolution path and Comments that serves the same function as in Problems Classic.
Additionally, problem details page in Problems introduces other new capabilities, such as
- Creating and linking troubleshooting guides (Troubleshooting tab)
- Showing related log entries (Logs tab)
Visual resolution path
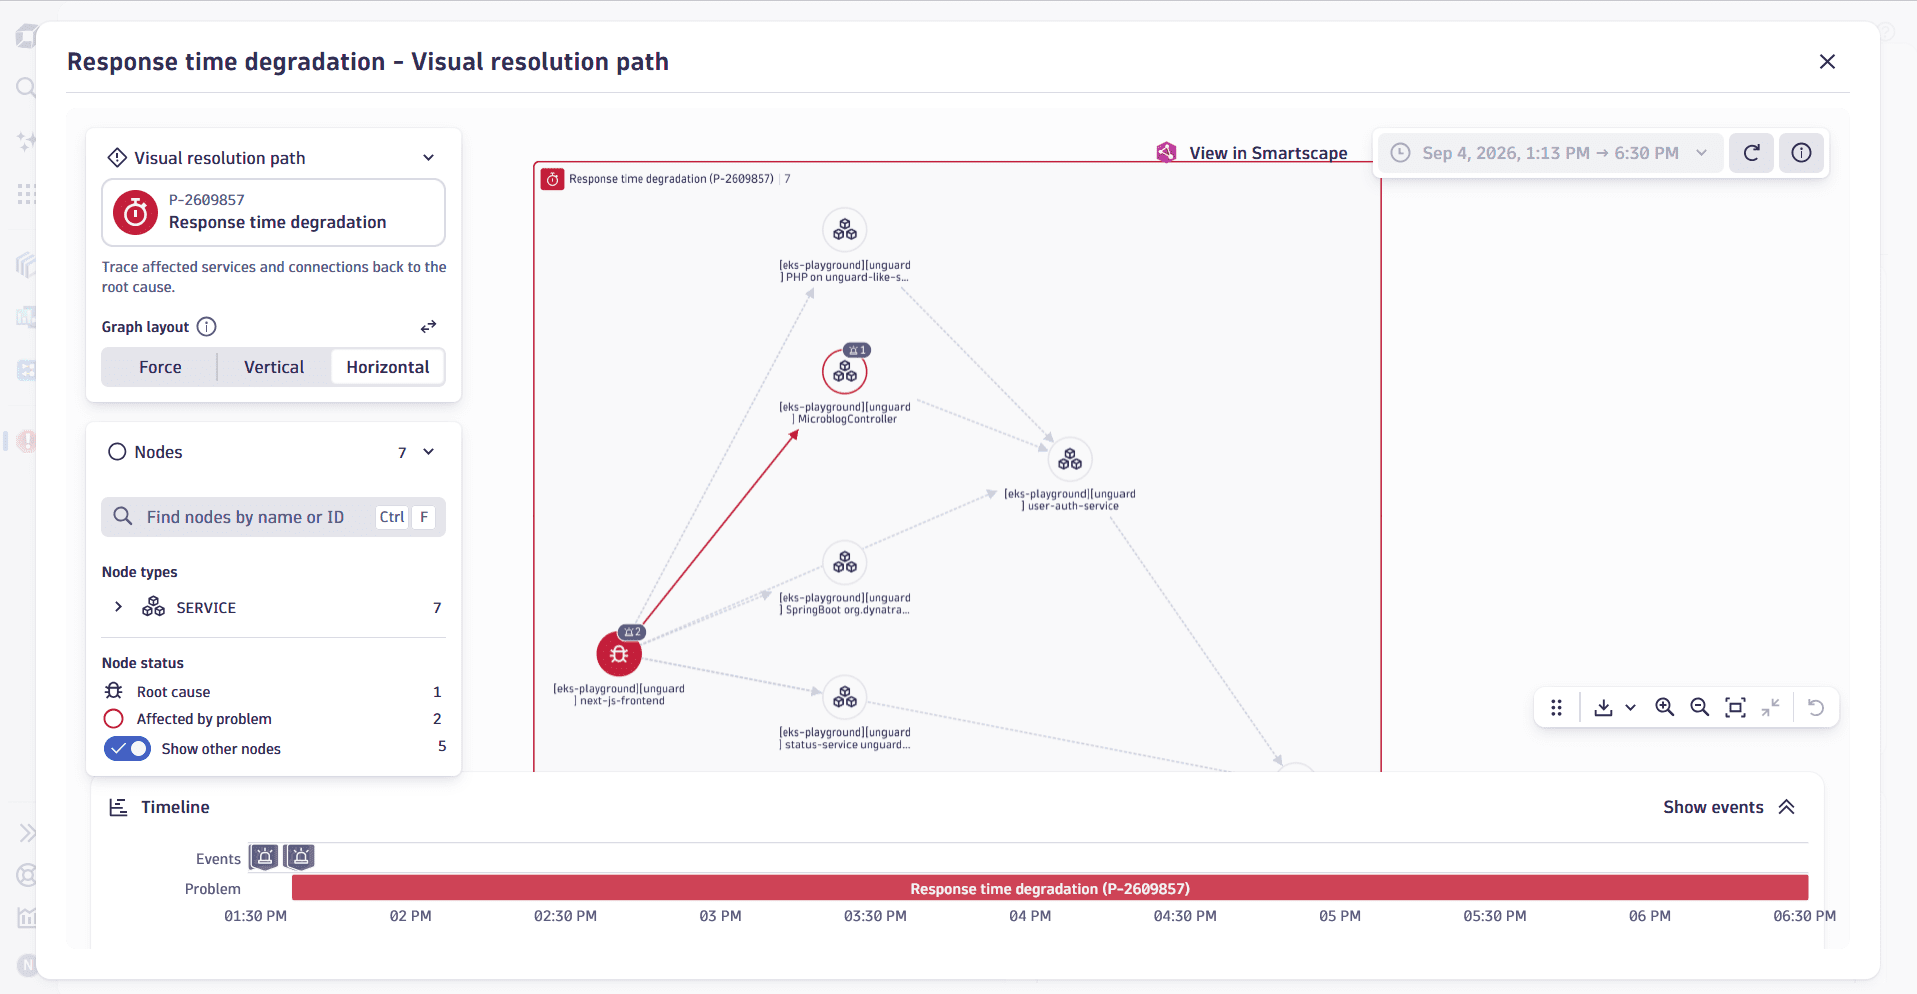
The Visual resolution path helps you understand how Dynatrace Intelligence identified the root cause backend service. It graphically illustrates the relationships between frontends, services, and backends involved in the issue. Each node represents a Smartscape entity, such as frontend, service, or backend, where a health issue was detected.
By selecting Maximize on the top right, you can open the detailed view, complete with a timeline on the very bottom that shows when related events have been fired:
Drill-down actions
The drill-down actions available on the problem details page help you pinpoint the cause on a code level by navigating you to a specialized app like  Services or Distributed Tracing. These apps have an integrated investigation mode that allows you to work across apps by carrying over the information from the problem details page. For example:
- The receiving app shows a reference to the problem at the top of the page. For example,
Problem: P-2609857. - The problem timeframe is carried over from the Problems.
- All problem-relevant aspects related to the given app context are highlighted (for example, setting an entity filter and highlighting a violating metric or health indicator).
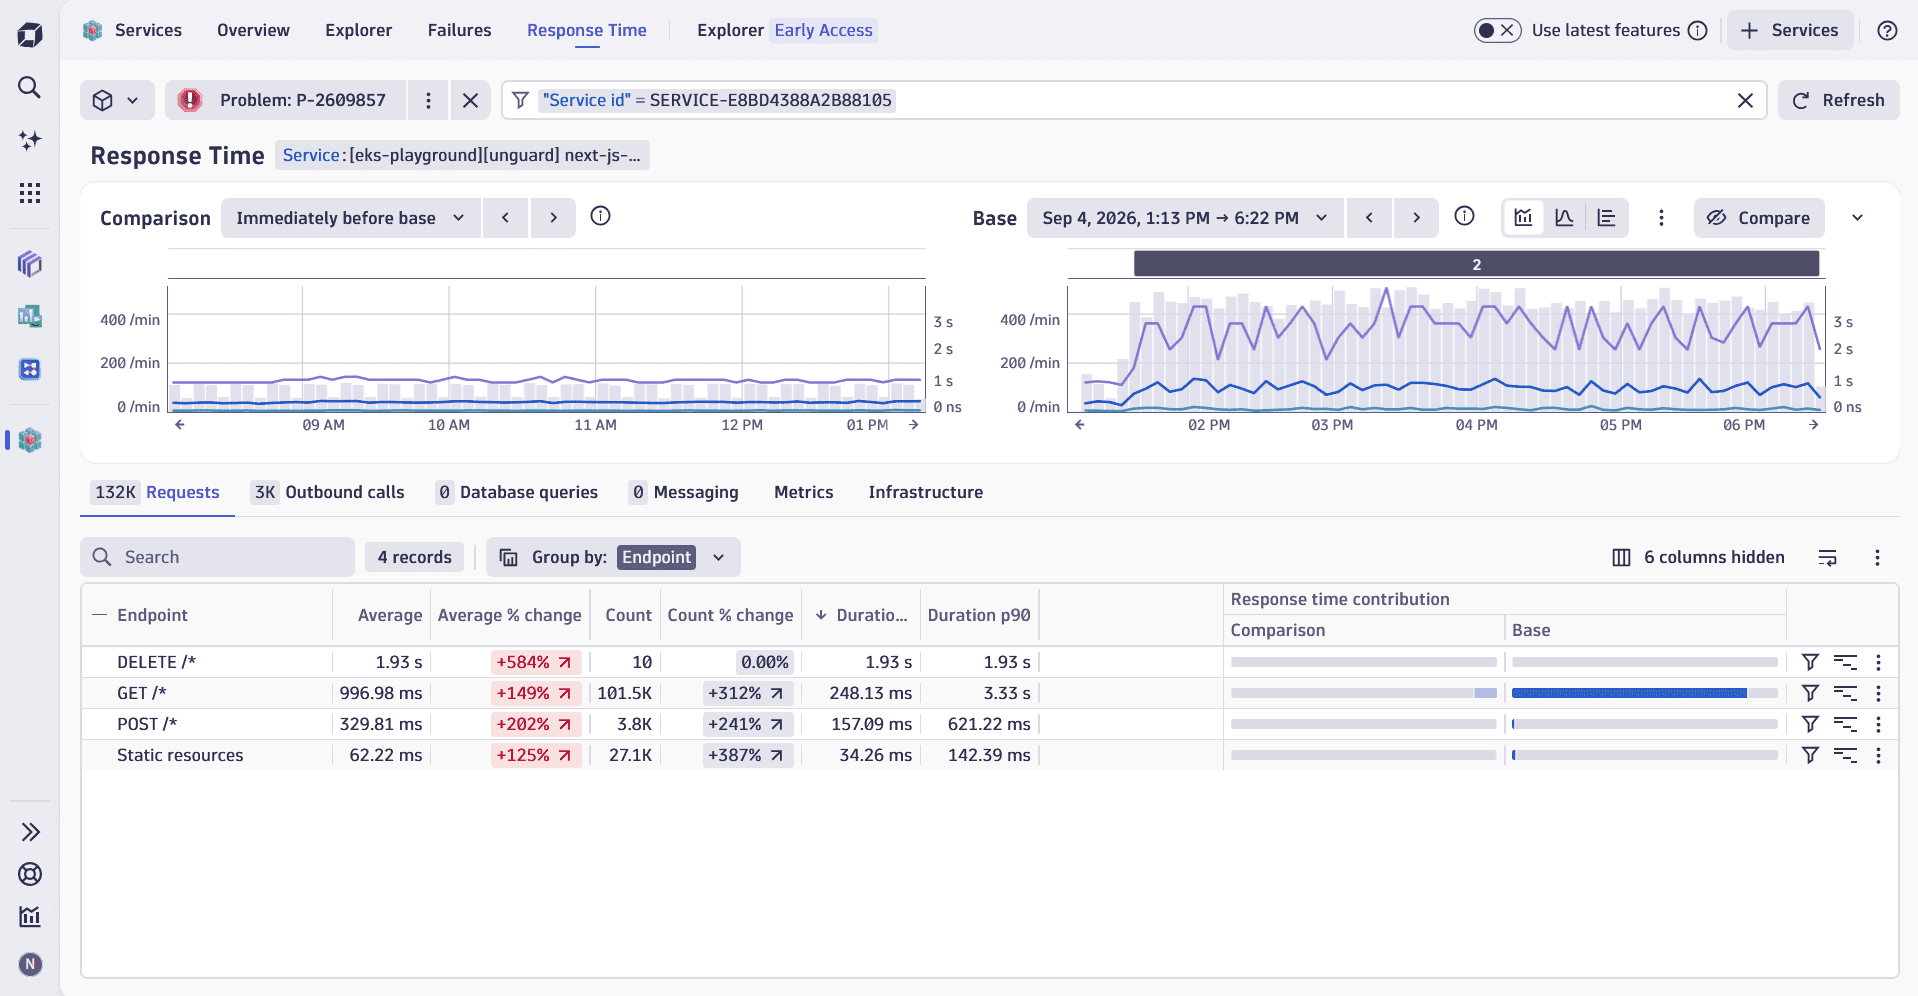
The drill-down action available to the left of the (for example, Analyze slowdown) shows the primary analysis option recommended by Dynatrace based on the identified root cause. Meanwhile, displays a list of relevance-ranked secondary actions. All the app-related actions automatically lead to a Problem investigation mode on the receiving application side, which is indicated by a badge at the top of the page.
For example, by navigating to Services via drill-down actions in the Root cause section, you can check the response time analysis of a detected service slowdown:
Automation and remediation triggered in related workflows
Automation and remediation triggered by <problem-number> section in Overview tab displays a list of connected workflows and their status.
 Workflows offers dedicated triggers to either react to incoming active events or newly created active problems. These Workflow triggers are used to send alert notifications or implement automations on top of Dynatrace-detected situations, which allows you to automate fixes to known potential problems or receive notifications for workflows configured with a problem trigger.
Automation and remediation triggered by <problem-number> allows you to track and check the status of all connected workflows without navigating to Workflows and checking individual configurations.
Technical updates
Problems and event persistence and queries
Problems and events are stored in Grail along with their record fields. The problem feed and problem details view use DQL to surface all details in a UI tailored for operations teams and SREs.
You can write DQL queries to directly access the same information within Dashboards, Notebooks, and Workflows to define custom reports and implement automations on top of Dynatrace-detected events and problems:
fetch dt.davis.eventsshows the last state of any given alerting event with all its event fields.fetch dt.davis.events.snapshotsdelivers all the individual update and refresh events that were received while the event was in an active state.fetch dt.davis.problemsshows the last state of any given problem with all its event fields.fetch dt.davis.problems.snapshotsdelivers all the individual updates that were received while the problem was in an active state.
Which DQL query you should use depends on your particular use case. For example:
- If you want to know how many active
Slowdownevents you currently have on all your services, use thedt.davis.eventsquery. - If you want to show the timeline of state changes for a given alarming event and when a field was altered, use the
dt.davis.events.snapshotsquery.
The same principles apply to the problem queries, which deliver all the details about problems detected and analyzed by Dynatrace Intelligence.
All four queries implicitly apply a bucket filter that only fetches events from Davis event buckets instead of loading from the much larger general event bucket.
The flexibility of querying events and problems allows you to freely create custom dashboards and reports, as shown in this example:
Problem and event REST API
Integration partners building apps on top of the platform or outside of Dynatrace use the Grail Service API along with DQL to query events and problems detected by Dynatrace Intelligence.
Both the Grail Service API and the Grail Service SDK apply table-based access policies. This ensures consistency in accessing records independently of the client context like Notebooks, Dashboards, workflow automations, SDK, or API.
Transition of access policies
Dynatrace Classic uses Management Zones to define data access. In latest Dynatrace we replace Management Zones by introducing two new concepts, IAM Policies and Boundaries, for configuring data access management.
These new concepts apply to Problems and event records in Grail, meaning that access policies can be used to restrict a user's ability to see problems to a smaller defined subset.
Since defining policies on records within Grail is restricted to a subset of well-defined record fields, called Record level permissions in Grail, it's important that those fields are properly set and enriched in Problems.
If you need to use one or more custom fields in Problems to define the access scope, we recommend using the dt.security_context field. There are several ways to add a dt.security_context field to a problem or an event:
- If the field is already present in an event, you can configure a custom problem field to display the event field in a Problems.
- If the event source isn't controlled by you, you can use OpenPipeline to set the security context (Set
dt.security_contextprocessor) field within the Problems or Davis event pipeline. - Recommended If the event source is controlled by you (for example,
 Anomaly Detection setting or OneAgent), you can use the source side tagging on the agent side to add the security context field directly to the source.
Before you begin
Prerequisites
While Problems doesn't require you to upgrade to Dynatrace Platform Subscription (DPS), you need DPS to be able to utilize the full potential of the improved problem analysis on the latest Dynatrace. To use the full scope of the latest Dynatrace and Problems functionality, ensure that your license agreement includes Dynatrace Platform Subscription (DPS).
Prior knowledge
Before you start your transition from Problems Classic to the Problems, we recommend familiarizing yourself with related concepts of the Dynatrace platform:
Breaking changes
Some of the Problems Classic concepts and behaviors are not carried forward:
- Management Zones aren't supported. Instead, we highly recommend using Segment filters for scoping and filtering.
- Static filters and fixed filter presets are replaced by dynamic filter expressions.
- Saved views and layouts from Problems Classic aren't migrated.
- One‑to‑one parity in problem grouping, timing, and boundaries is not guaranteed due to the Grail‑backed data model and updated UI behavior.
- Classic‑only visualizations and layout patterns are deprecated and aren't be reproduced in Problems.
New concepts
The latest Dynatrace is introducing a couple of new concepts and capabilities that differ between Problems Classic to the Problems app. It's vital to understand the differences before upgrading.
Access to data from Grail
- Problems Classic exposes problem information through a dedicated UI with limited options for reuse outside the app. Problem details, timelines, and impact context are primarily consumed within the Problems Classic experience.
- In the latest Problems app, all problem and event records are stored directly in Grail, making them available across the Dynatrace platform.
- Data stored in Grail
Grail stores problem and event data in tables, allowing you to query, join, and analyze it consistently alongside other observability data. You can access problem data using DQL from
Problems, Dashboards, Notebooks, and Workflows, without relying on app-specific or legacy views. This unified data layer allows you to explore problem timelines, impact context, and related events from a single source, using the same query language and tooling as the rest of the platform.
Filtering
With the latest Dynatrace, filtering problems is based on segments that replace static Management Zone–based filtering used in Problems Classic.
- Segments
Segments provide a dynamic and multidimensional way to filter problem data across apps. They're designed to scale for enterprise environments and can be defined based on logical structure such as applications, environments, ownership, or responsibilities. Segments support logical expressions like
AND,OR, and wildcard matching and adapt automatically as your environment changes. Unlike Management Zones, segments aren't applied globally, but are carried over when navigating between apps using Open with drill-downs, which allows to preserve the investigation context.
Problem fields customization
Problems Classic exposes a fixed set of problem attributes that can't be extended to include organization-specific metadata. Meanwhile, in the latest Problems, you can define custom problem fields to display selected event attributes directly in problem records. This allows you to surface business, ownership, or infrastructure metadata directly in the problem feed.
- Custom problem fields
Custom problem fields are record fields that aren't propagated to a detected problem by default and have to be configured and subscribed to by the user. Fields modified by the user are also counted as Custom problem fields.
How to upgrade
To upgrade, you need to install the new Problems app. To do so
- In Dynatrace Hub, select Problems.
- Select Install.