Metric events
- Dynatrace Classic
- Overview
- 5-min read
Dynatrace Classic
We encourage you to try Anomaly Detection  for more advanced configuration options such as:
- The ability to use DQL queries in addition to Grail records
- Alerting on data such as logs, spans, and business events
- The ability to create advanced queries with and include a higher number of data records
You can easily migrate your metric event configurations to Anomaly Detection and choose the desired monitoring strategy with minimal changes to your existing configuration. To learn more about Anomaly Detection capabilities and uses, see Introduction to Anomaly Detection based on DQL video.
Dynatrace Davis® AI automatically analyzes abnormal situations within your IT infrastructure and attempts to identify any relevant impact and root cause. Davis relies on a broad spectrum of information sources, such as a transactional view of your services and applications, as well as all events raised on individual nodes within your Smartscape® topology. One of the sources for events in Dynatrace is metric events, that is, events based on metric data. They are configured in the global settings of your environment and are visible to all Dynatrace users in your environment. There are two types of metric events based on how the metric is queried for event evaluation:
- Metric key. Metric key events evaluate the incoming measures of a single metric. You can use only static thresholds with this query type.
- Metric selector. Metric selector events evaluate a complex query defined by the selector. This query type can include historical data and even arithmetic operations with multiple metrics.
Dynatrace uses three monitoring strategies for such events:
- Static threshold—the threshold that doesn't change over time.
- Auto-adaptive threshold—Dynatrace calculates the threshold automatically and adapts it dynamically to your metric's behavior.
- Seasonal baseline—Dynatrace calculates a confidence band for a metric with seasonal patterns.
- Auto-adaptive thresholds and seasonal baselining are available only for metric selector events.
- The number of metric event configurations (both metric key and metric selector) is limited to 10,000.
Metric events overview
Dynatrace provides an overview of all your metric events, with information about limitations and metric event failures within the last 24 hours. To access the overview, go to Settings > Anomaly detection > Metric events.
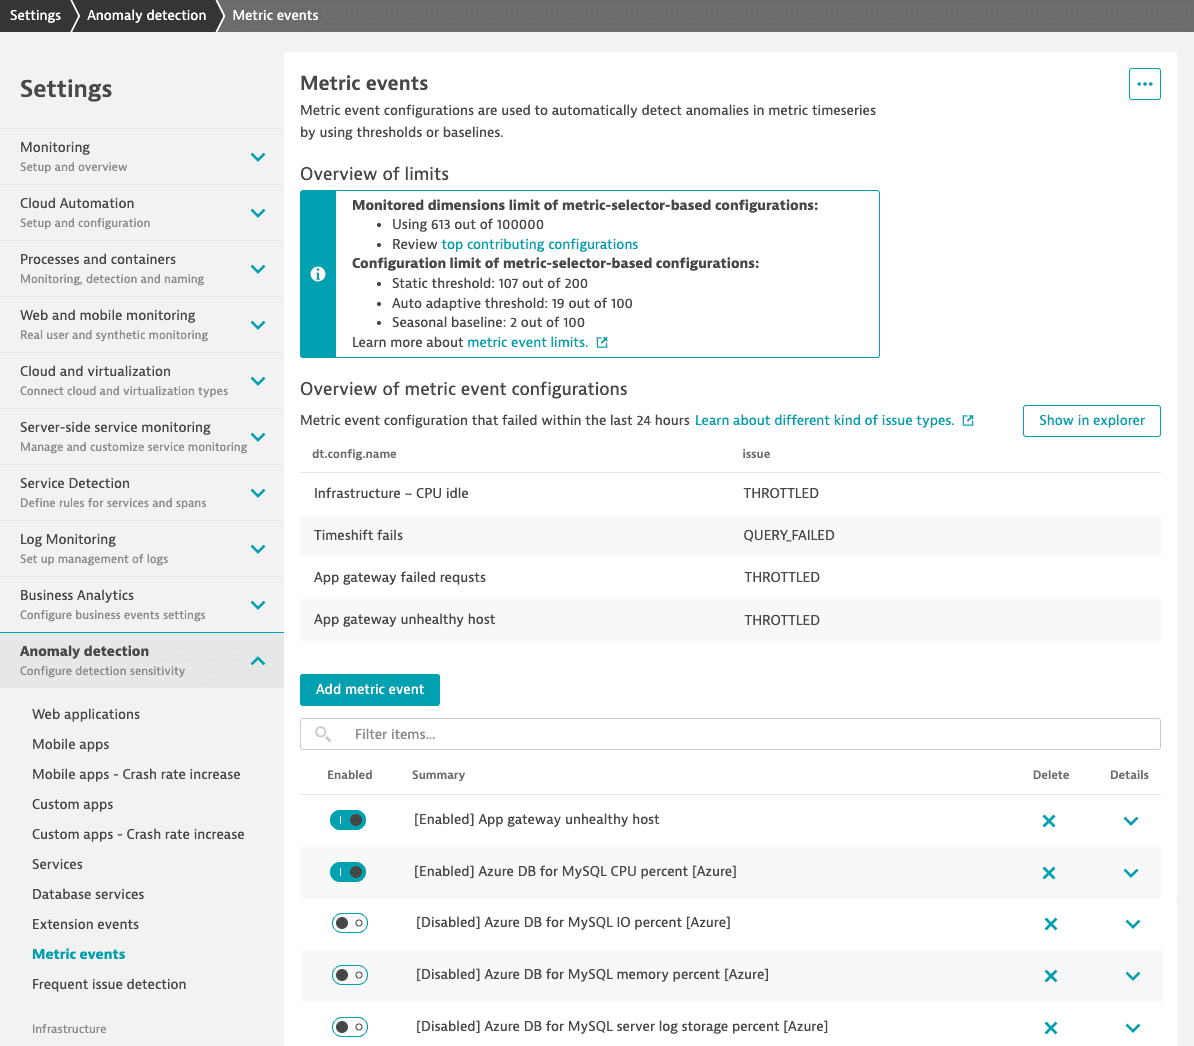
The overview of limits tells you how much of each limit type has been consumed. The review link takes you to Data Explorer with a pre-filled query set to display top-consuming configurations.
The metric events overview includes the configurations that experienced issues during the last 24 hours. Monitored issues include:
THROTTLED: The configuration reached the query limits of the metric selector.QUERY_FAILED: The metric query of the configuration has failed. Some possible reasons for query failure include:- Management zones or tags are no longer available.
- Metric data is no longer available.
- The queried data is not available in 1-minute resolution.
CONFIG_BLOCKED: The configuration causes a significant load and has been blocked to avoid negative impact on other custom alerts.
Management zones in metric events
If you have management-zone-level permissions, you can create metric event configurations that are tied to these management zones. Such configurations use only data coming from the specified management zone. You can also see all management zone configurations that use the management zone you have access to.
To create metric events without management zone scopes, you need admin access.
Management zones set up via dimensional data rules are not supported for metric events.
Topology awareness
Topology awareness and context are the key themes of the Dynatrace observability platform. Data—such as metrics, traces, events, and logs—is not simply reported and stored within the platform. Such data is rich with references to the topology where the data originated. For example, with process metrics, each measurement references the associated hosts and processes. Davis AI uses this topological information to automatically perform root cause detection and impact analysis for detected anomalies. The same applies to all metric events in your environment.
When an anomaly detection configuration raises an event, Dynatrace automatically identifies the most relevant entity to map the event to. If multiple entity references are detected, the most relevant one is automatically selected. For example, if a metric with reference to both a host and a process leads to an event, the event is raised on the process.
Metric ingestion enables you to submit all types of metric measurements, regardless of the number of entities they relate to. The following scenarios exist:
Measurements aren't related to any entity
If you define a metric event on a non-topological metric, the resulting event will be raised on the monitoring environment itself, and not on a specific Smartscape entity.
Example: revenue numbers measured for all retail shops per geographic region
business.revenue,shop=shop111,city=NewYork 234business.revenue,shop=shop999,city=Atlanta 499
Measurements are related to a single entity
If you define a metric event on a measurement that is related to a single entity, the resulting event will be raised on that entity.
batchjob.executions,dt.entity.host=HOST-1111111,hostname=hostA,ip=53.43.23.12 23batchjob.executions,dt.entity.host=HOST-2222222,hostname=hostB,ip=53.43.23.12 23
Measurements are related to multiple entities
When multiple entities are specified for each measurement, Dynatrace selects the most appropriate entity on which it should raise the event. In the case of a host and a process, the measurement presumably relates to the process rather than the host, so the event is raised on the process.
batchjob.executions,dt.entity.host=HOST-1,dt.entity.process_group_instance=PROCESS-GROUP-INSTANCE-1,hostname=hostA,ip=53.43.23.12 23batchjob.executions,dt.entity.host=HOST-2222222,dt.entity.process_group_instance=PROCESS-GROUP-INSTANCE-2,hostname=hostB,ip=53.43.23.12 23