Assess and troubleshoot cluster health
- Latest Dynatrace
- Tutorial
- 2-min read
") Kubernetes streamlines the process of assessing the health of clusters, enabling you to easily monitor health signals and metrics across your environment. It provides clear insights into cluster health, helping you identify and address issues, and ensuring your clusters are functioning efficiently.
Kubernetes streamlines the process of assessing the health of clusters, enabling you to easily monitor health signals and metrics across your environment. It provides clear insights into cluster health, helping you identify and address issues, and ensuring your clusters are functioning efficiently.
Dynatrace Intelligence health status
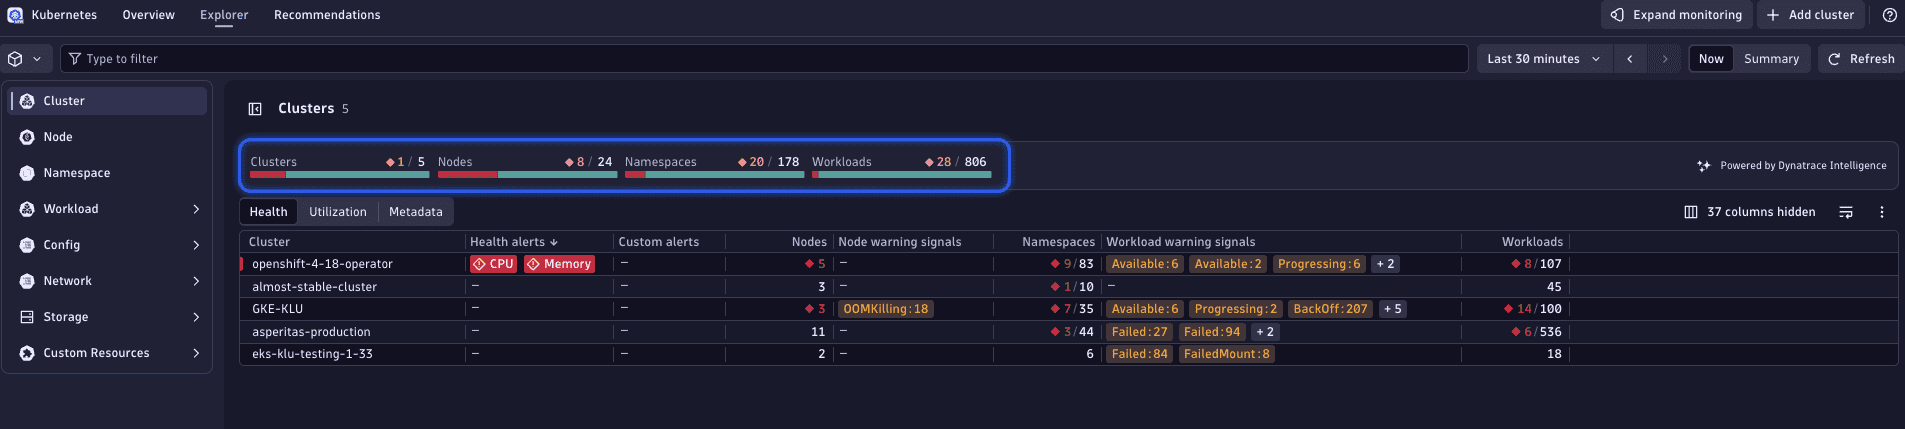
Get a quick health overview using the Dynatrace Intelligence health status. Dynatrace Intelligence automatically assesses and aggregates the health of Kubernetes clusters, nodes, namespaces, and workloads. This feature visualizes the current health state at a high level, enabling you to easily identify both healthy and unhealthy clusters, nodes, namespaces, and workloads.
Troubleshoot unhealthy resources
In this example, we observe in the Cluster tab that some nodes, namespaces, and workloads are in an unhealthy state, marked as red.
To troubleshoot these unhealthy Kubernetes objects
1. View unhealthy nodes
Select the red number in the Nodes section of the Dynatrace Intelligence health status bar.

This action reveals a list of the unhealthy objects in the corresponding node list table, providing additional insights into the nature of the problems they are facing. For instance, you might notice a node showing BackOff warning with the last termination reason out-of-memory killed, indicating the container exceeded its memory limit and Kubernetes is delaying restarts.
2. Analyze node memory utilization
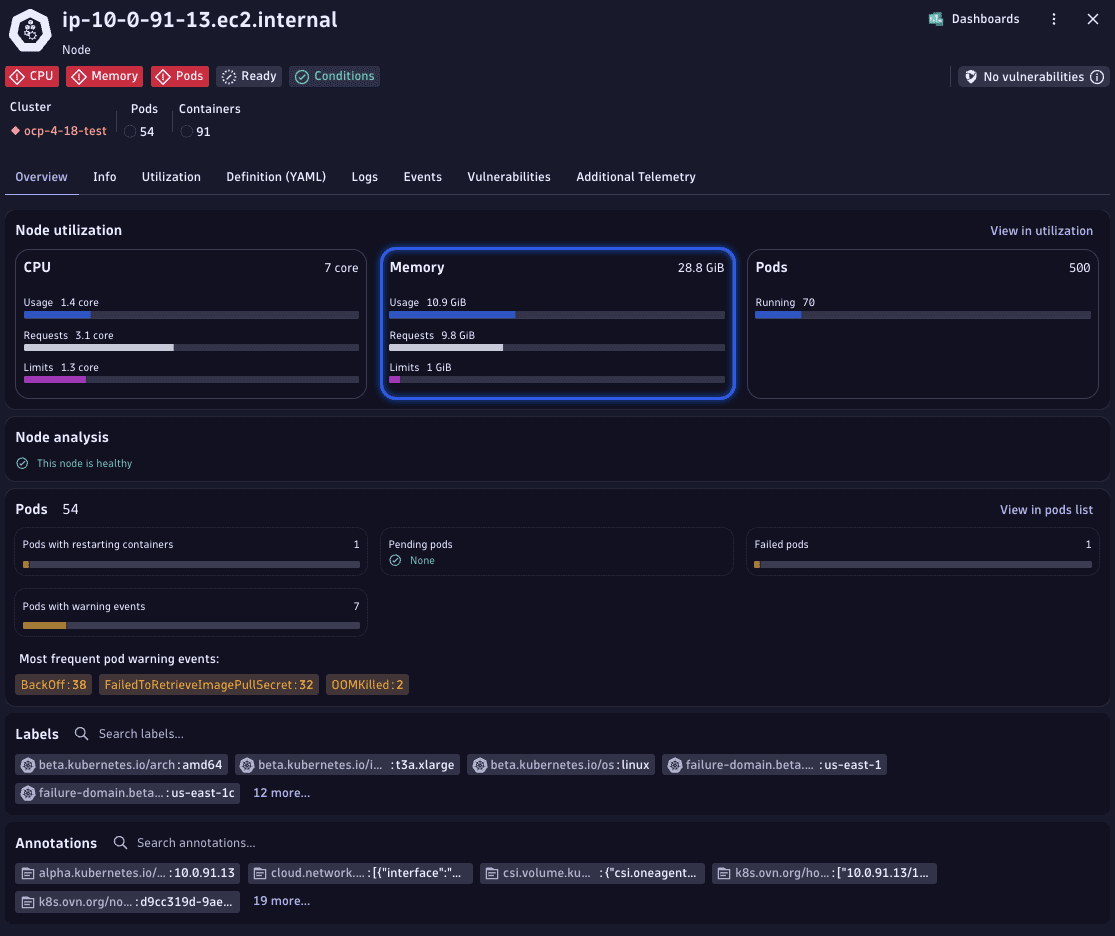
In the details view, you can see a breakdown of the node resource utilization.
Pay attention to the Memory tile. If memory usage exceeds the allocated requests, it indicates a potential resource strain.
Kubernetes, in an effort to maintain node stability, might begin evicting pods to free memory. This is often a response to pods consuming more memory than available, based on their reserved requests. Kubernetes may report memory pressure at the node level, and affected containers can be terminated with out-of-memory killed when they exceed their limits.
3. Go to node events
To identify which pods have been out-of-memory killed, go to the Events tab for this node.
4. Identify out-of-memory killed pods from events
Search the events list for BackOff, select the relevant entry, and drill down to view the full event details. In the event details, you can identify the pod and deployment that were terminated due to an OOMKill after exceeding the memory limit.

5. Inspect the affected workload
Close the details view and go to Workload > Top level workloads. Filter by the deployment name to find the relevant workload and select this workload to display details.
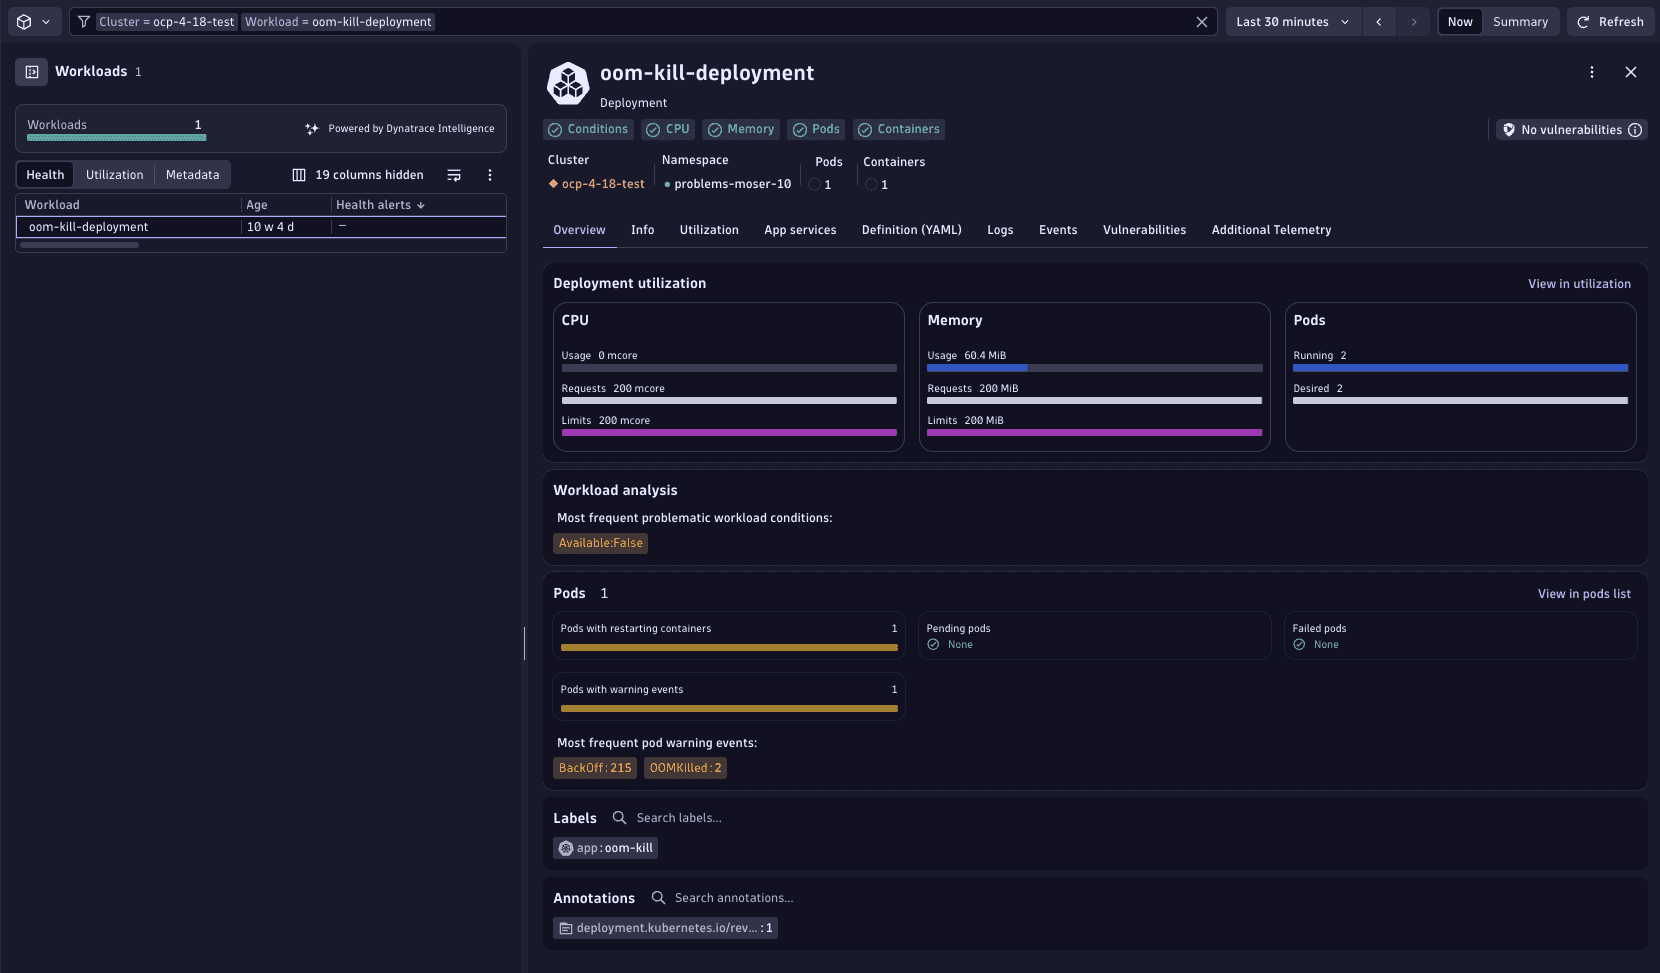
In the Utilization section, you should be able to quickly spot misconfigurations of resource requests.
Kubernetes