HTTP monitors reporting results (classic)
- Explanation
- 13-min read
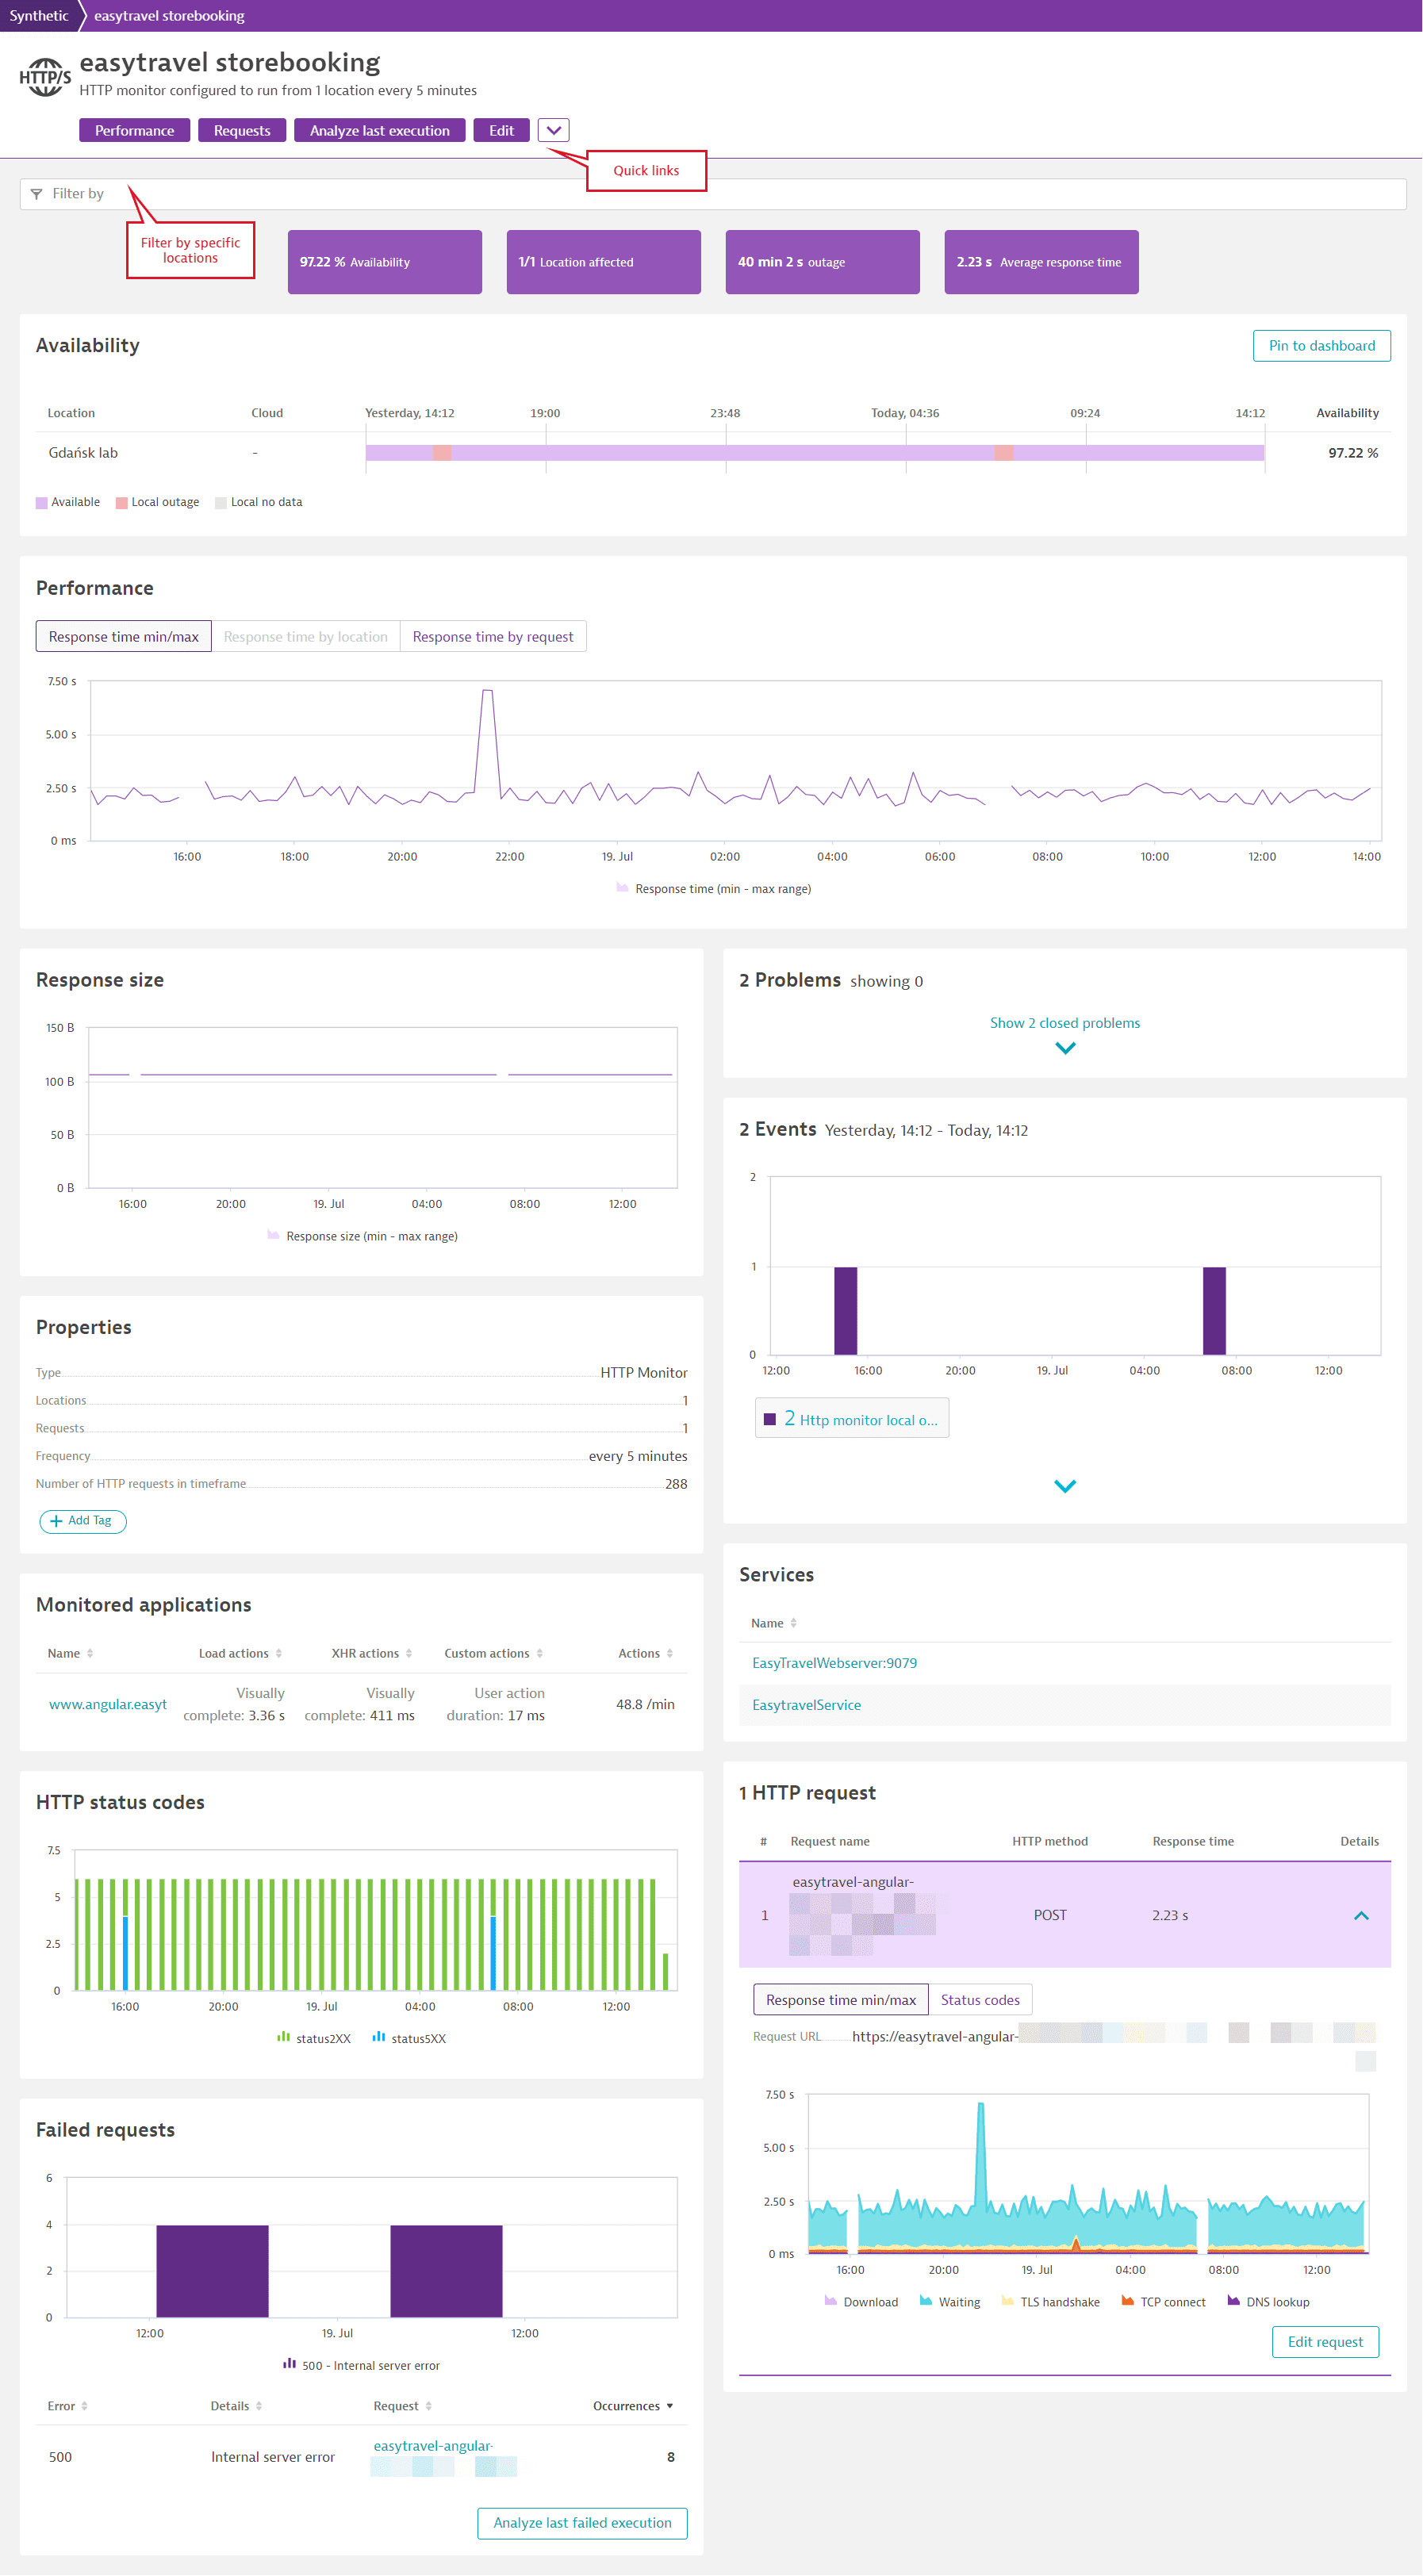
Go to Synthetic Classic and select an HTTP monitor to open the Synthetic details page, which provides an overview of monitor execution results, result visualizations, and monitor properties. Powered by the Dynatrace AI engine Davis, the Synthetic details page shows you at-a-glance information and graphs, with ready links and filters to drill right down to problem details and edit monitor settings.
Metric visualizations
The top panel shows overall monitor availability and performance infographics for the selected timeframe.
Use the filter bar at the top of the page to filter all HTTP details by one or more locations.
Select the quick links in the upper-left corner to go directly to different cards in the details page or to access HTTP monitor settings (Edit, Disable, Delete). Analyze execution details displays the results of the most recent successful and failed executions per location in JSON format.
Tags applied to your HTTP monitor are shown below the monitor name. Select Add tag to apply additional tags. Note that tags can only applied and deleted from the details page.
Purple bars above the availability or performance timelines indicate maintenance windows.
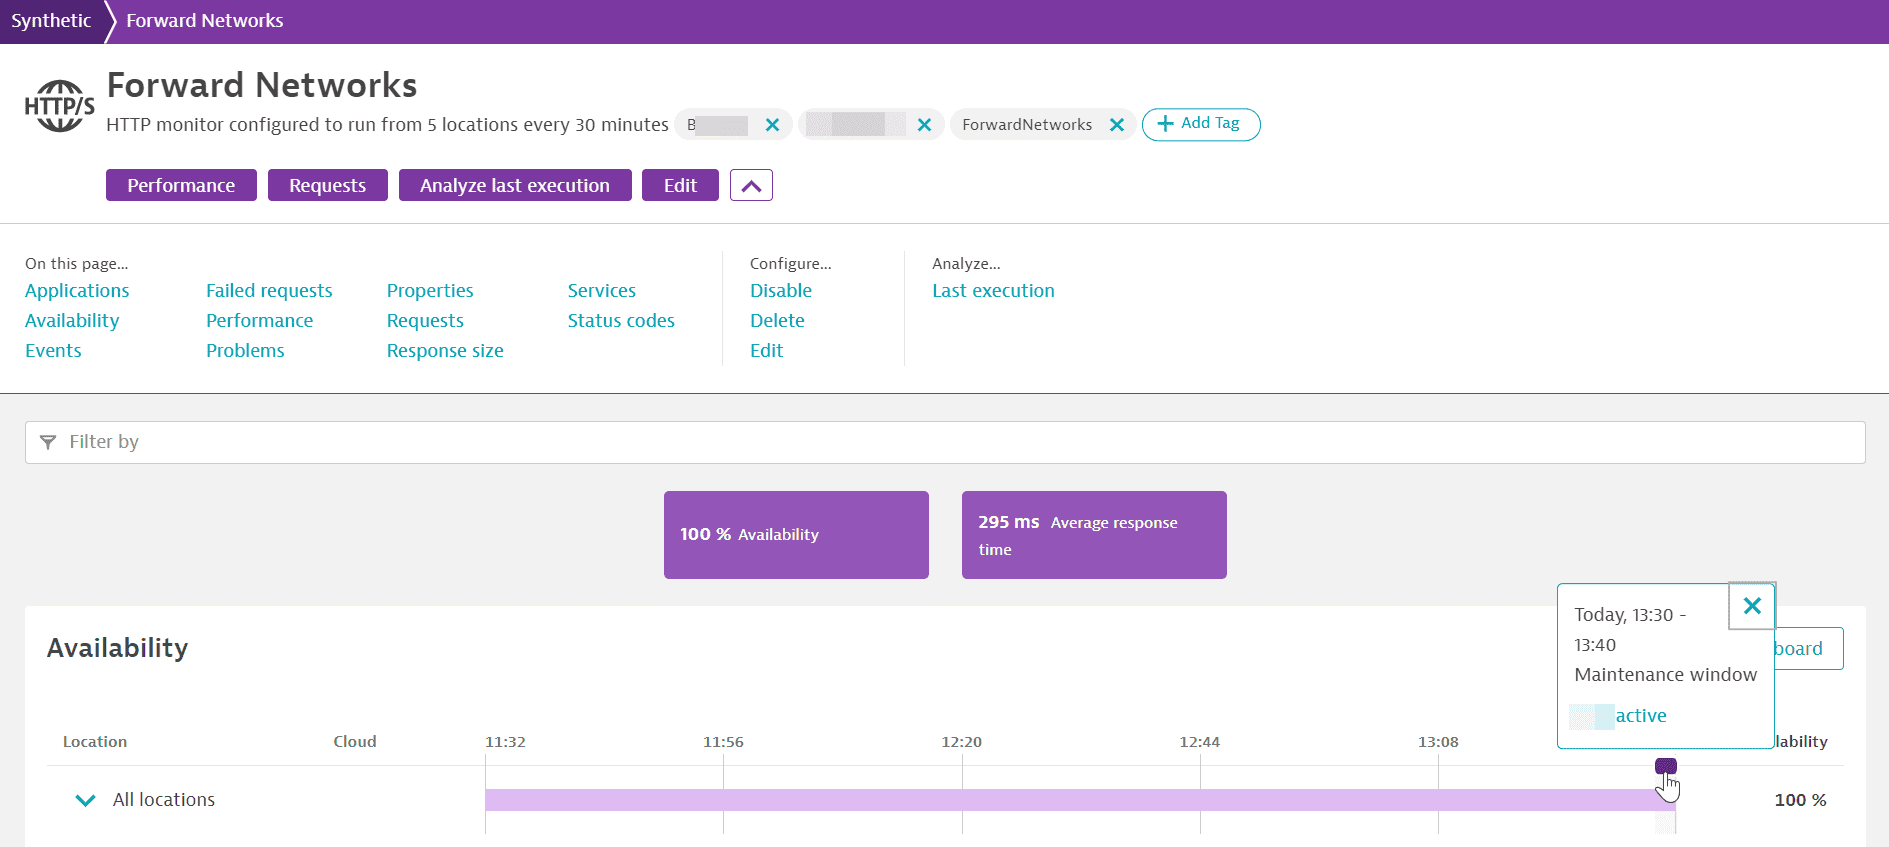
- Whether or not you see problems and receive alert notifications during maintenance windows depends on how you configure the maintenance windows.
- Maintenance windows may be excluded from availability calculations by applying a global setting.
Availability
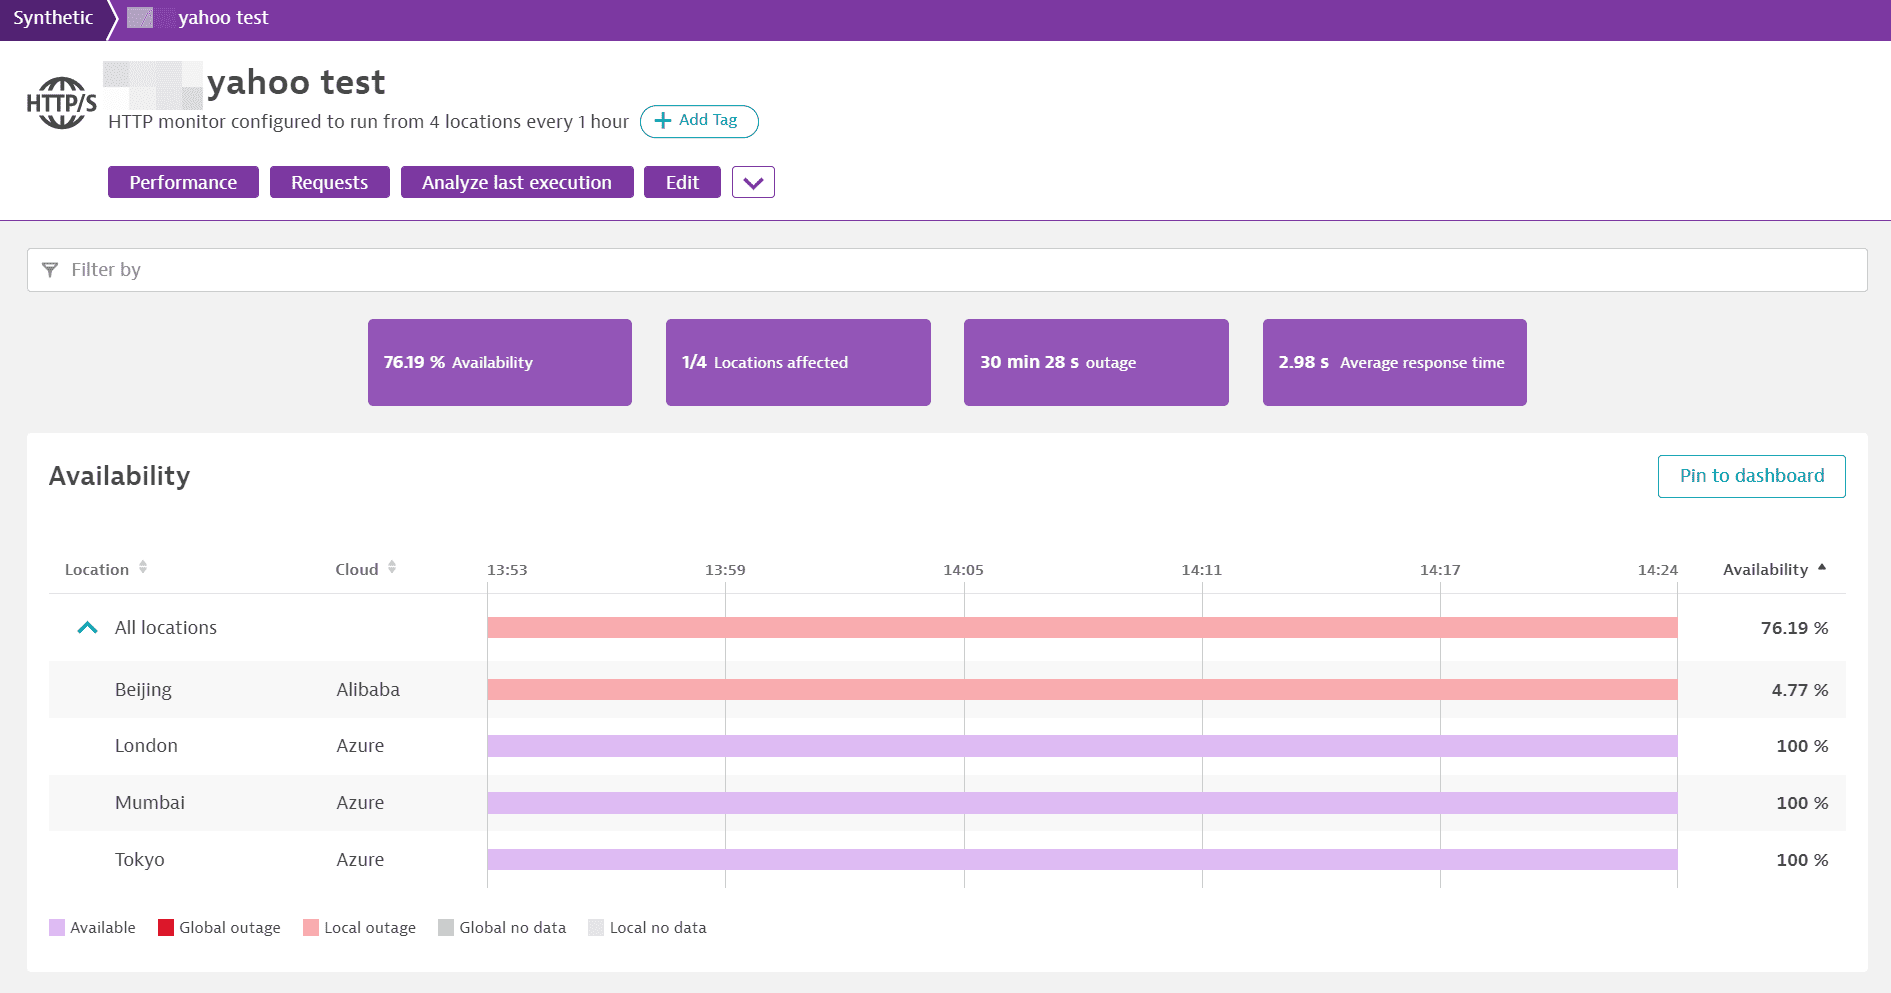
The availability infographics at the top of the page display the monitor's availability for the selected timeframe, with details of downtime and affected locations, if any. Outage (downtime) duration and affected locations infographics are displayed if the monitor is down (unavailable) at one or more locations. The number of affected locations is also displayed if there's no data from any locations for any reason.
Note that a monitor can be down at one or all locations even if no outage thresholds (global or local) have been set up. The outage duration is the sum of all downtimes in the selected timeframe, not counting overlapping downtimes. See Synthetic calculations for details on how availability and downtime are calculated.
The Availability card shows overall availability across all monitor locations, with annotations for global/local outages and global/local missing data (as when the monitor is disabled).
Hover over the All locations graph to view information about the number of locations with outages or missing data at any given point in time. Expand All locations to view availability graphs for each location. Select a block of monitor downtime (red) or availability (purple) in any availability timeline and then select Analyze to filter all HTTP details by the duration of that block.
Select Pin to dashboard to pin an HTTP monitor tile to a classic dashboard you own or a new classic dashboard.
Performance
The performance infographic at the top of the details page displays the HTTP monitor's average performance, that is, response time for the sum of all requests across all locations for the selected timeframe. Additional metrics are captured per request and are shown in the requests card.
The Performance card shows trend lines for minimum and maximum response time for the sum of all requests, with the shaded area representing the difference between the two values at any given time. Note that if your monitor runs from a single location, the minimum and maximum trend lines coincide.

Optionally, view trend lines for the average sum of all requests Response time by location or average Response time by request across all locations.
If the monitor violates a performance threshold, whether for the sum of all requests or an individual request, a solid red line appears above the performance graph for the problem duration. Additionally, any threshold for the sum of all requests appears as a dotted red line. Select the solid red bar to display a link to the problem overview page.

Analyze execution details
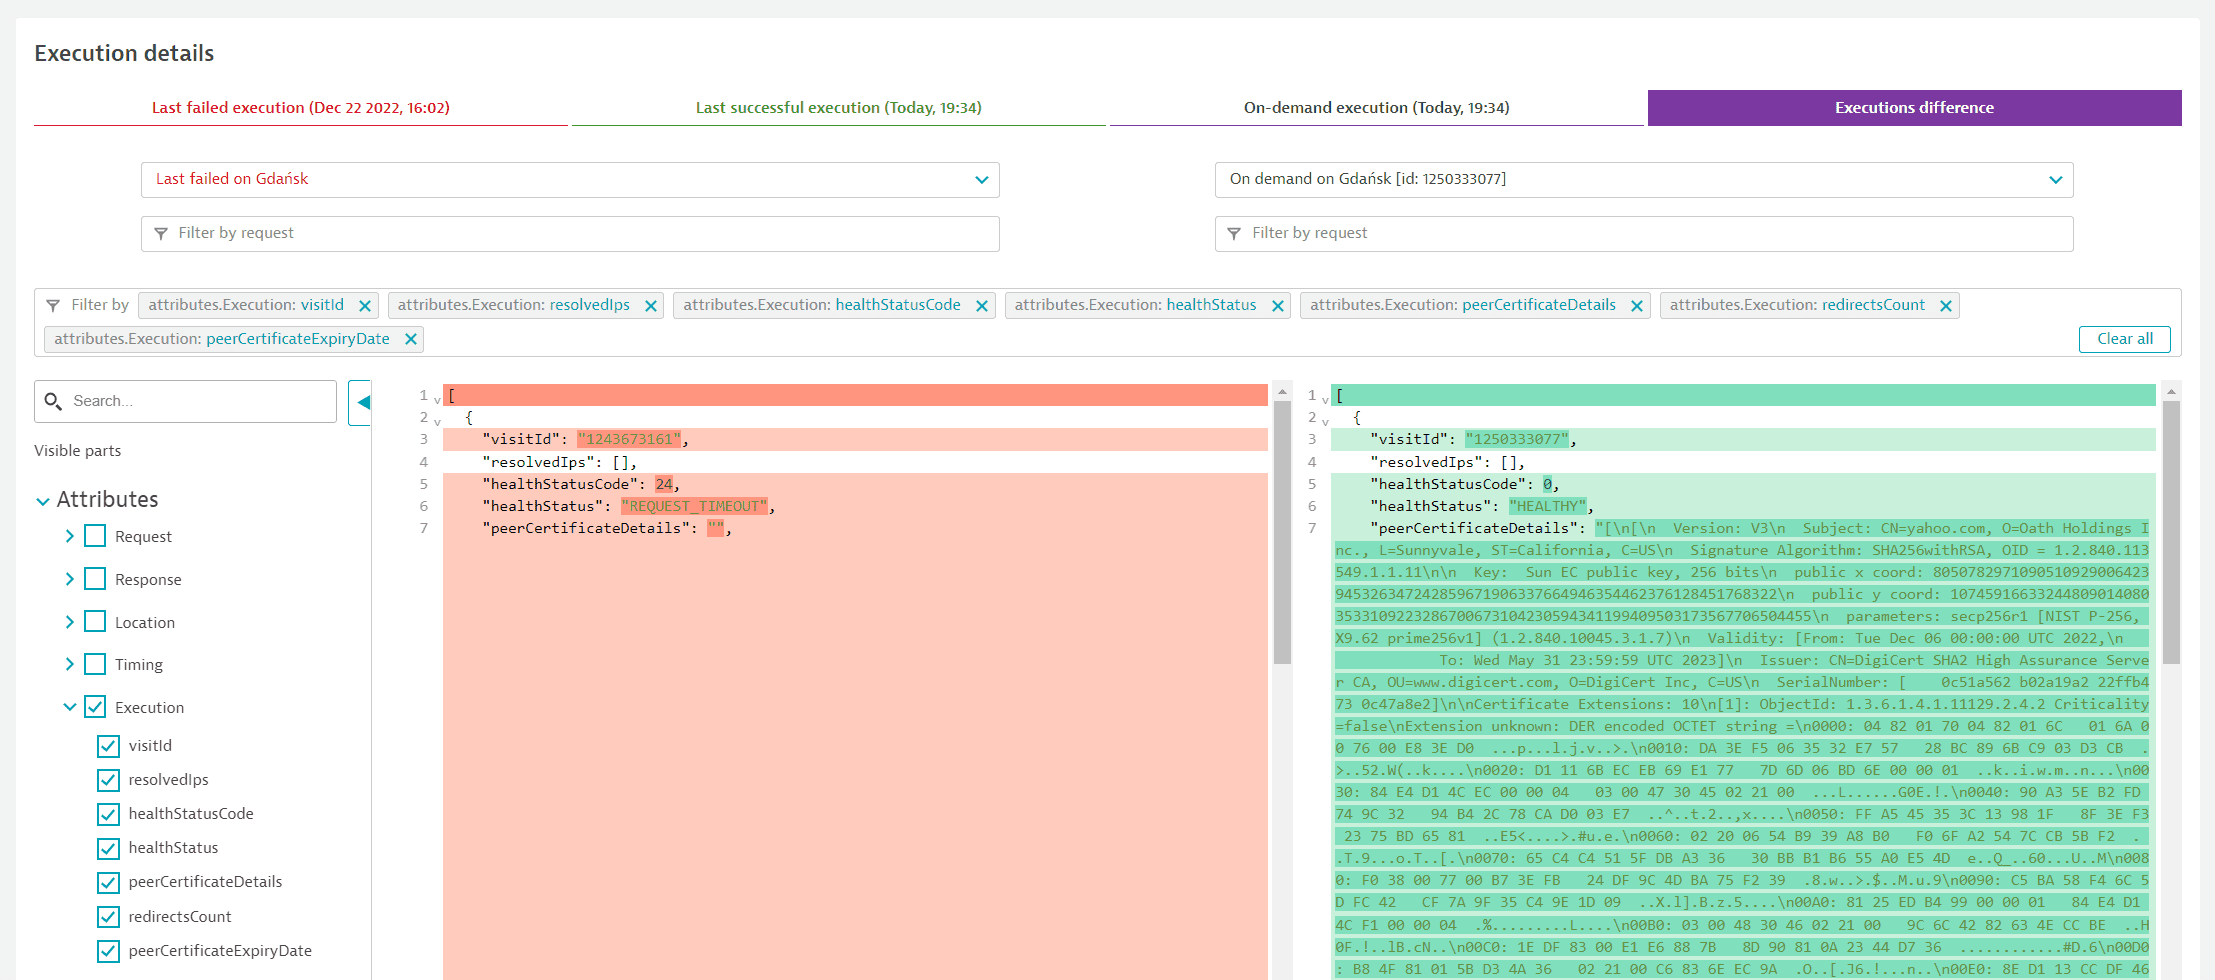
Select Analyze execution details at the top of the details page or Analyze last failed execution in the Failed requests card to view the most recent successful, failed, and on-demand executions of the HTTP monitor per location in JSON format. Select Executions difference to view the color-coded difference between the last successful, failed, or on-demand executions.
Any response body and captured HTTP metrics are also displayed along with the HTTP status code per request. If the monitor contains credentials sent in the request URL, HTTP header values, or request body, the JSON only displays the credential ID in the corresponding element. (This feature requires ActiveGate version 1.229.)
You can limit the display of sensitive information (such as credentials returned in the response body) in execution details by selecting Do not store and display request and response bodies, header values, and peer certificate details in execution details in monitor settings.
You need to do this for each request you wish to limit the display of. Request and response bodies, values of request and response headers, and peer certificate details are then replaced by placeholder text.
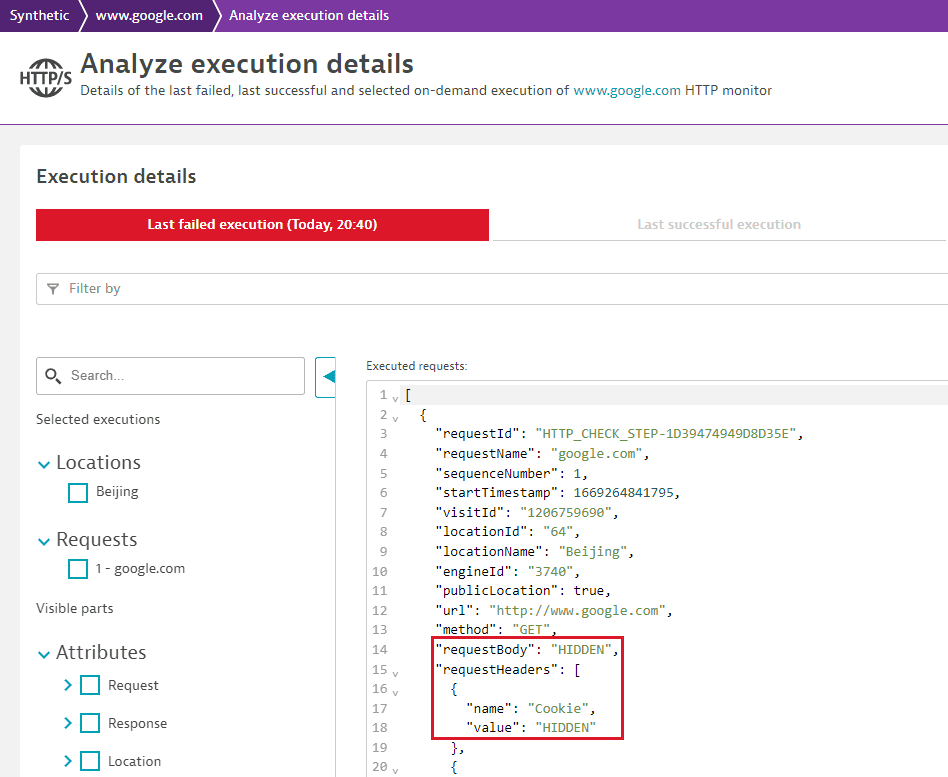
For successful or failed executions, the tabs hold JSON data for all locations. Use the filters at the top or the left of each tab to filter execution details. You can view and Download the corresponding filtered JSON file for successful or failed executions. For on-demand executions, you can download the JSON file for the single selected execution. You can also Copy your environment URL for retrieving JSON files via API. Note that GET API calls for fetching synthetic monitor executions require API tokens.
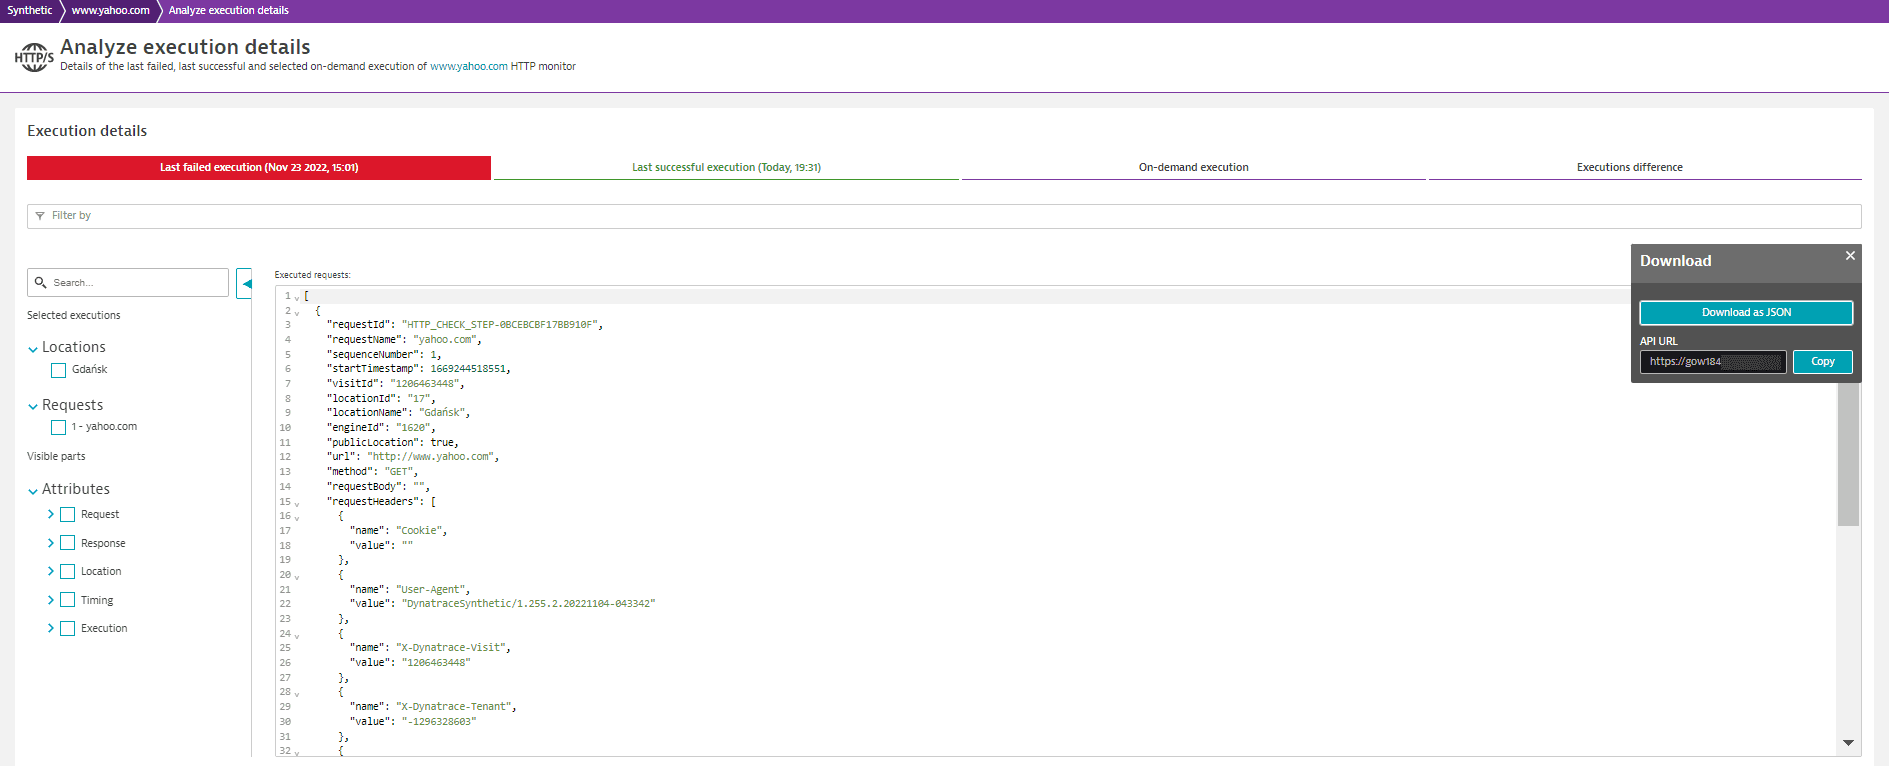
The customLogs attribute displays the timestamp, log level, and message for each custom log line defined using the api.info(), api.warn(), api.fail(), or api.error() scripting methods. (This feature requires Dynatrace version 1.255+ on public locations and ActiveGate version 1.255+ on private locations.)
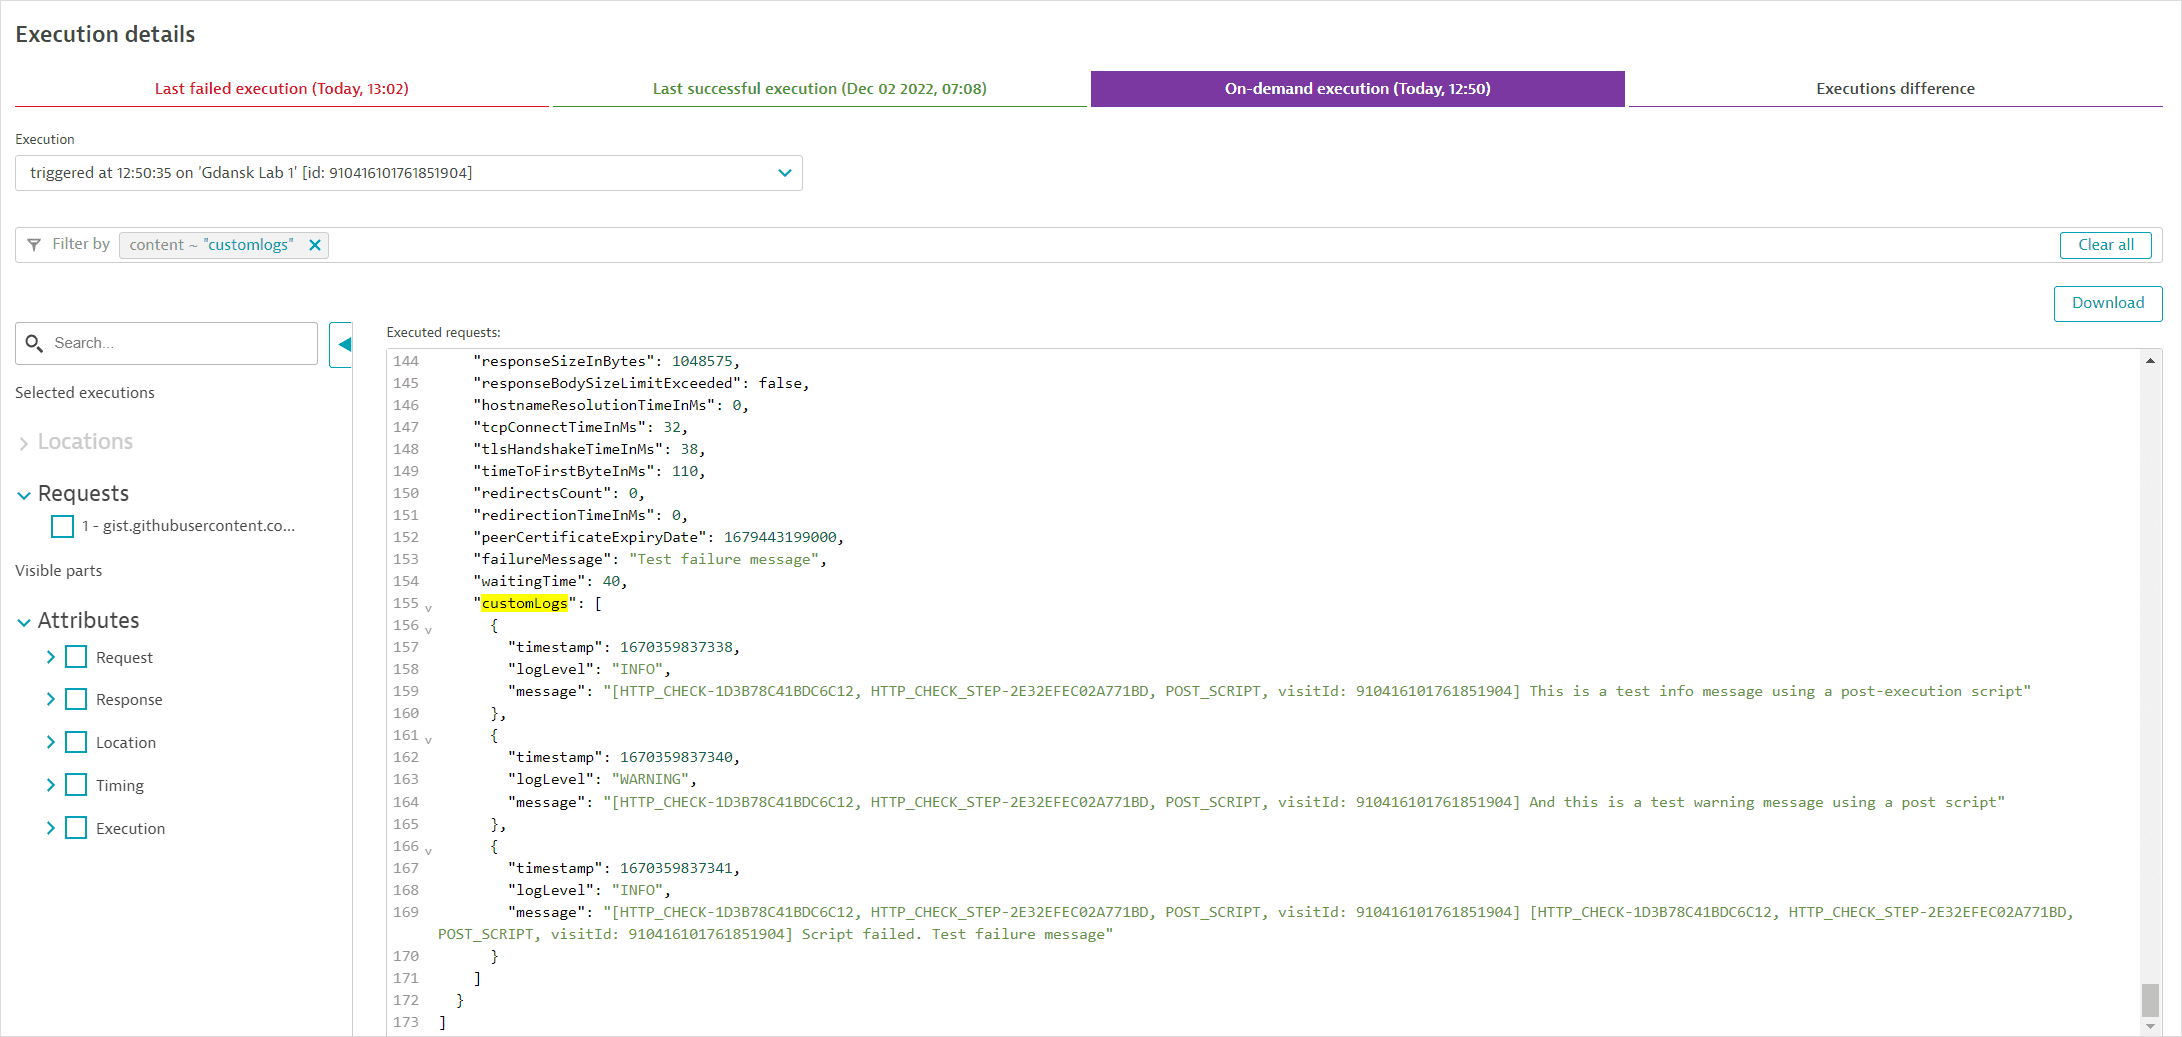
The On-demand execution tab is overwritten with each on-demand execution. Use the dropdown list to select any on-demand execution for the monitor from the preceding six hours. If the on-demand executions are in Standard or Disable problem detection modes, details are also written to the last failed/successful execution tabs. Note that in these modes, if you fail a monitor for violating a performance threshold, the execution appears in the tabs for successful and on-demand executions.
Filters and comparisions
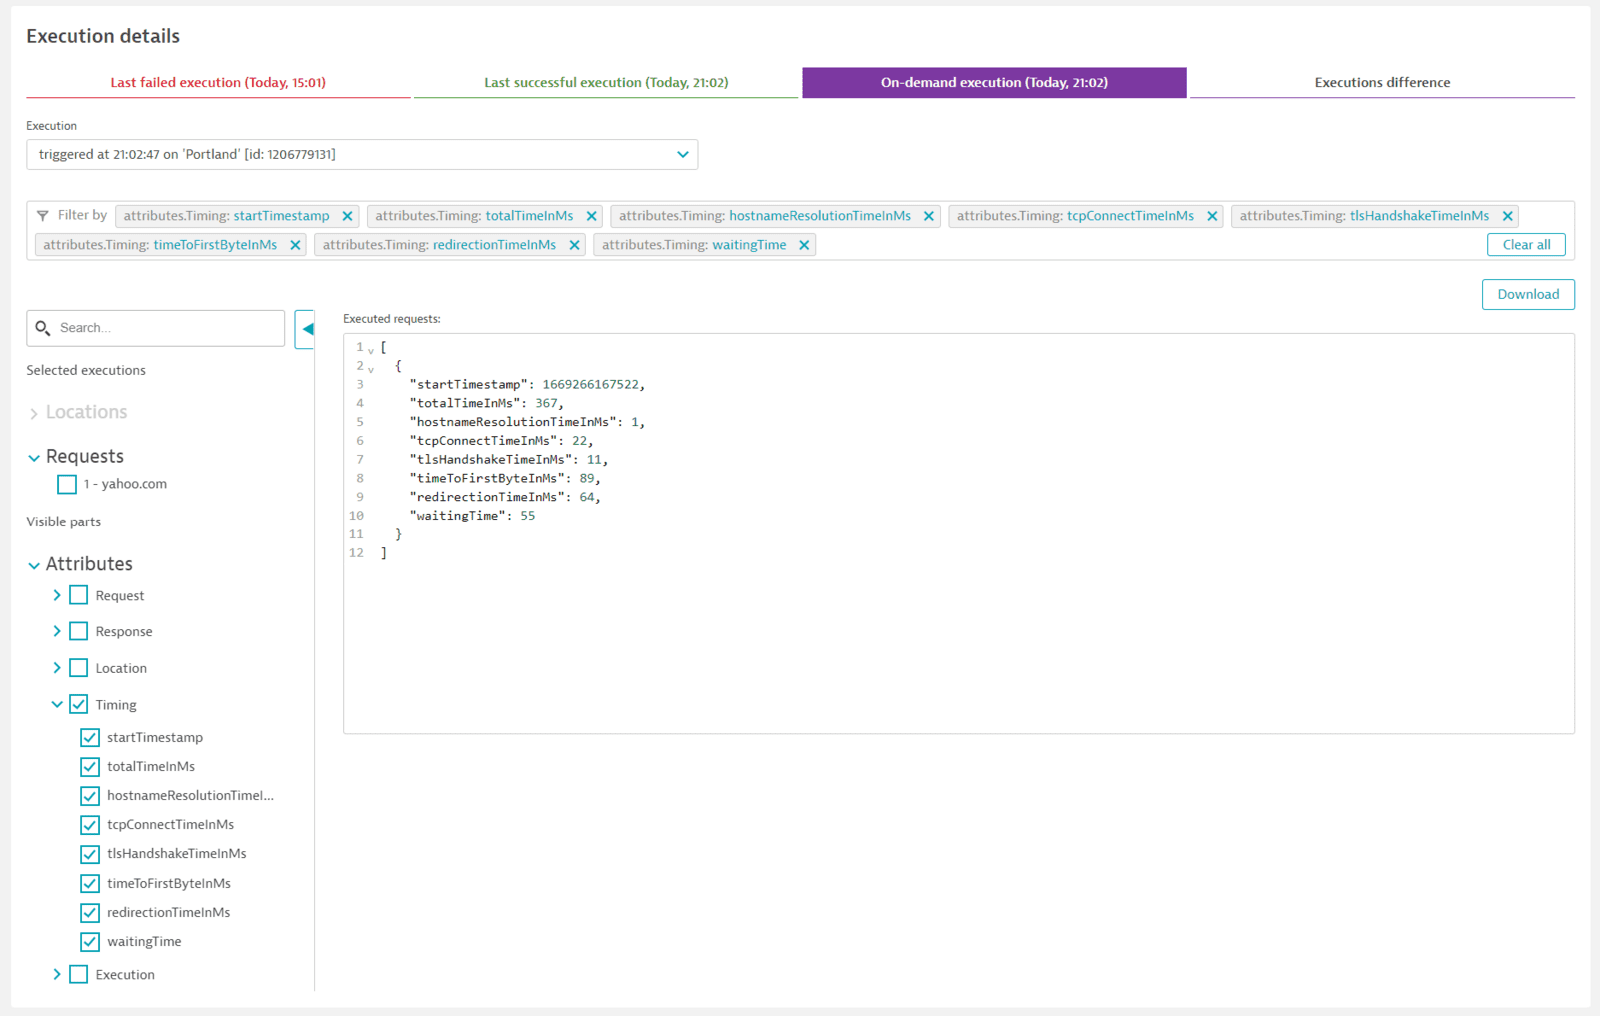
Use the filter bar at the top and left of each tab to narrow down execution details—you can have different filters for each tab. You can select from provided options to filter by Locations, Requests, and JSON Attributes (either individually or in groups—see below).
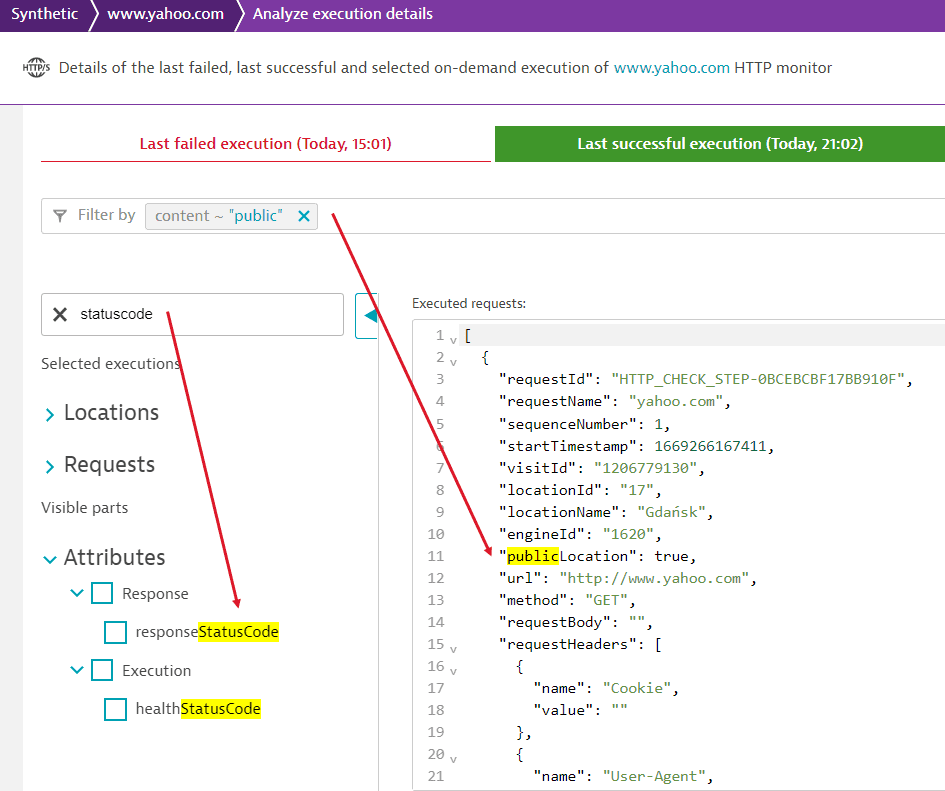
In the top filter bar, you can also search for specific content—simply enter the string (not case sensitive) to look for. In the left bar, you can search for specific filter criteria.
The Executions difference tab enables you to view a color-coded, object-by-object comparison of two executions—the last failed and successful executions for each assigned location or any on-demand execution within the last six hours. Any filters apply to both compared executions—this is especially useful to compare executions by an entire attribute group like Execution (see below).
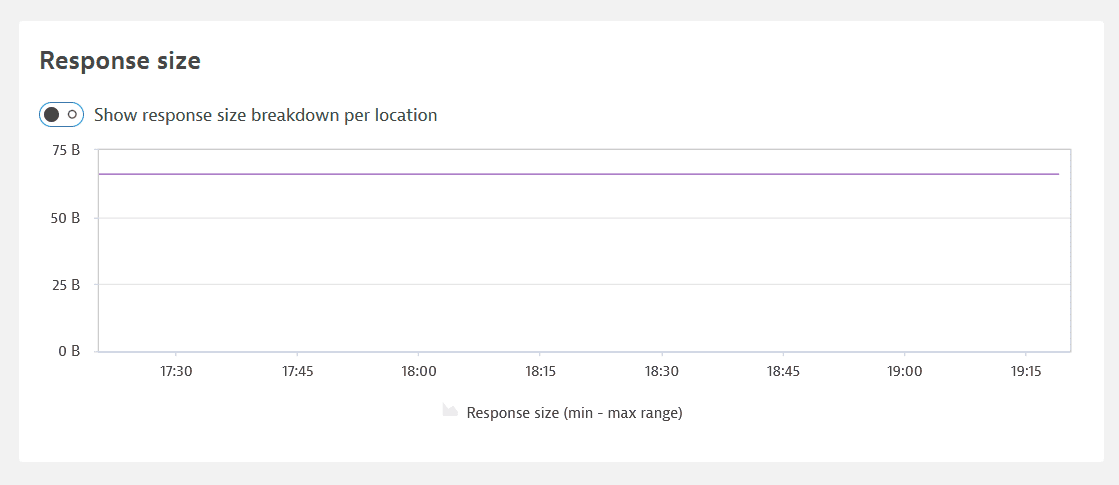
Response size
The Response size card shows trend lines for minimum and maximum response size for the sum of all requests, with any shaded area representing the difference between the two values at any given time. The trend lines might coincide (as shown below), as when your monitor runs from a single location. However, response size might vary, for example, when different responses are sent based on location.
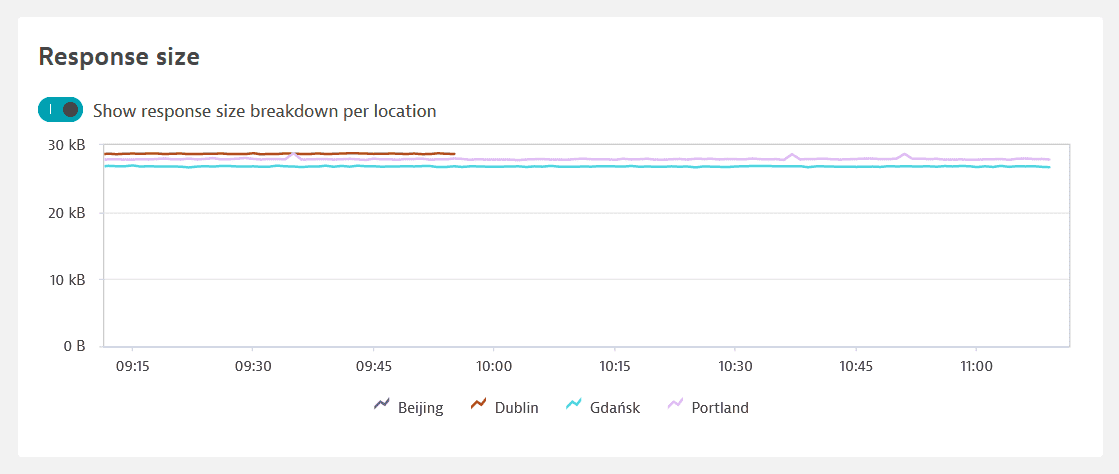
To track such differences, you can Show response size breakdown per location. Note that if you filter the entire details page by any locations, the toggle is no longer available.
HTTP requests
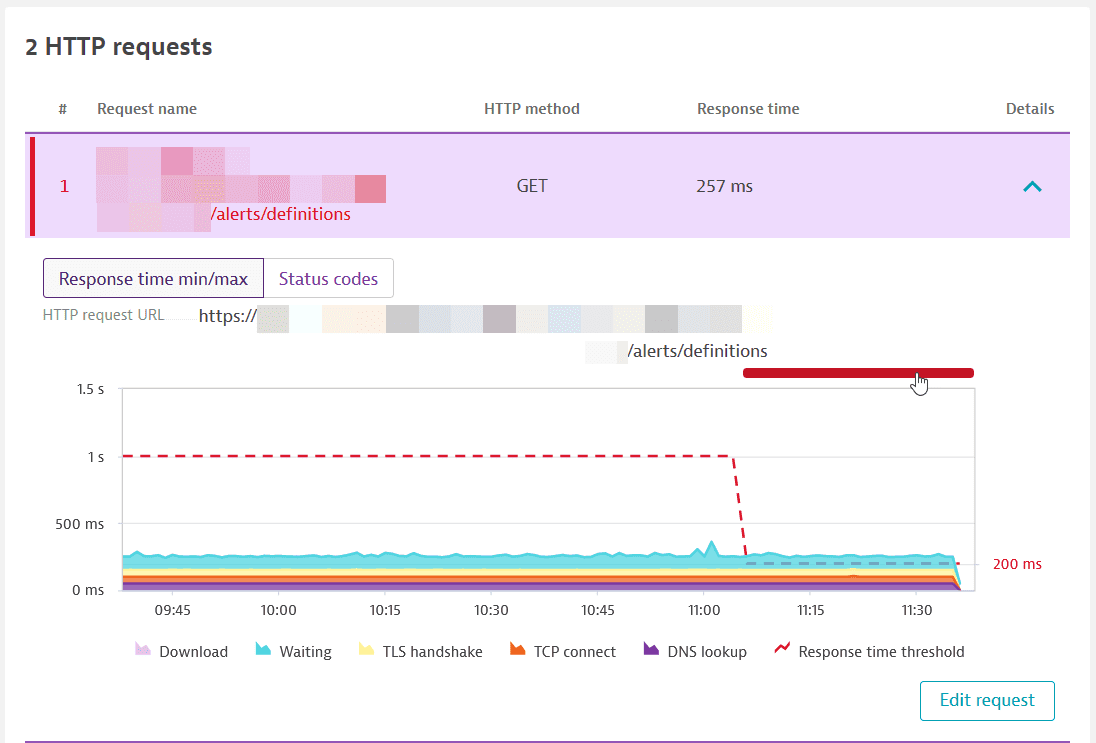
An HTTP monitor can consist of one or multiple HTTP requests. The HTTP requests card gives you an overview of all executed requests, their order, name, request URL, and the HTTP method used. For each request, the HTTP requests card splits performance (Response time) by the following metrics (see more in HTTP monitor metrics):
- DNS lookup time
- TCP connect time
- TLS handshake time
- Waiting
- Download
Response time is the summation of these different metrics.
Expand a request from the list to view all performance metrics in one chart. Select a metric in the legend to remove/add it to the performance chart. Select Edit request to go to monitor settings from this card.
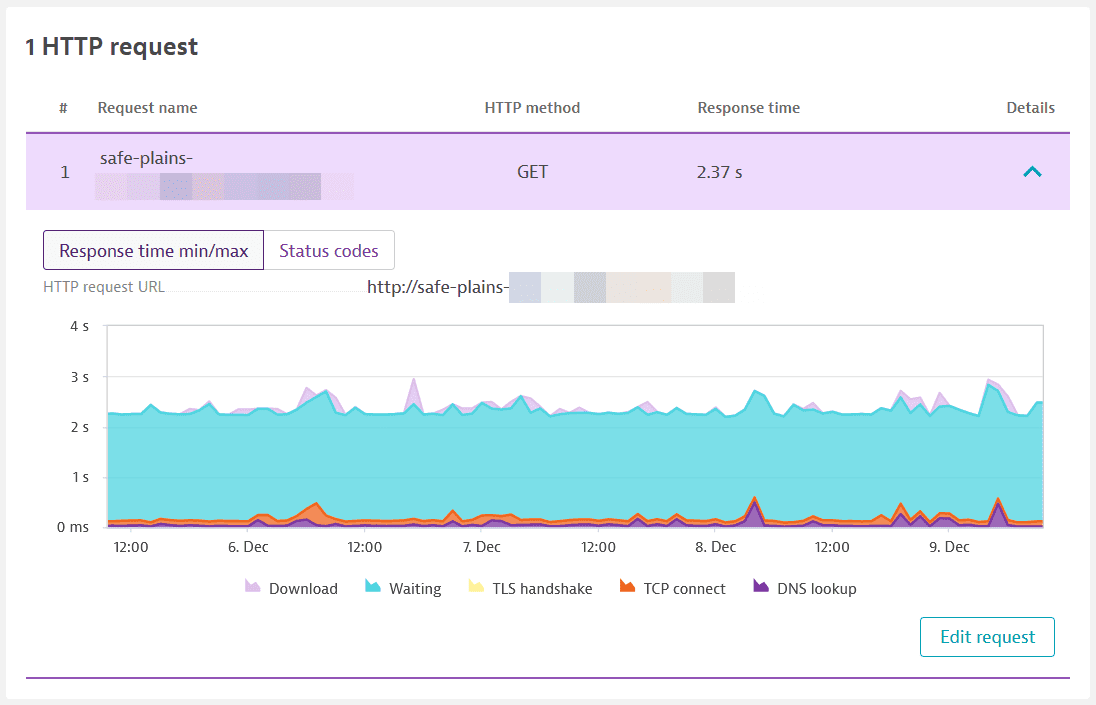
The Status codes tab shows the timeline of returned HTTP status codes for a particular request. (The HTTP status codes card shows the returned HTTP status codes for your HTTP monitor as a whole.)
When a request is in violation of its event-specific performance threshold, it is highlighted in red. Expand the request to see the performance timings and the threshold violated. A solid red line appears above the stacked graph for the problem duration; the request threshold appears as a dotted red line. Select the solid red bar to display a link to the problem overview page.
Properties
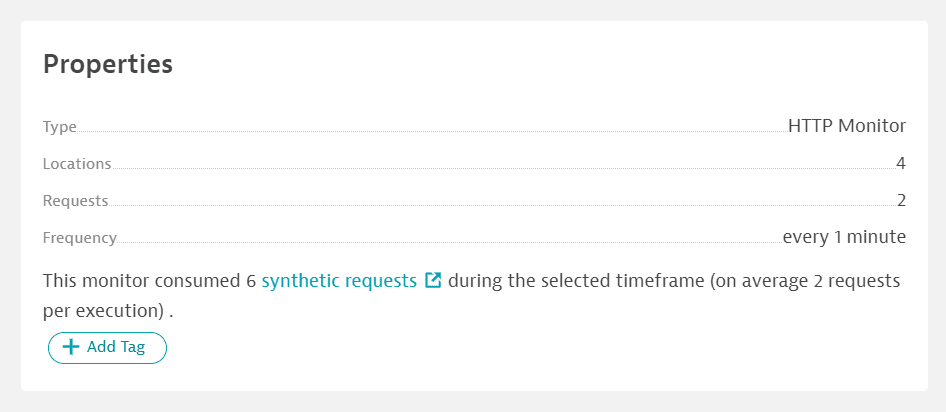
This informational card shows the number of requests, locations, frequency of monitor execution, and any applied tags. You can also see the consumption of DEM units in the selected timeframe. Select Add tag to apply additional tags. Note that tags can only applied and deleted from the details page.
Services
The Services card displays any monitored services that are automatically associated with the HTTP monitor. This card appears when the HTTP endpoint being monitored is hosted on a OneAgent-monitored host and the endpoint URL is handled by one of the discovered services. The association between the HTTP monitor and the service is made based on data provided by OneAgent. Therefore, at least one monitor execution needs to be completed before a service can be associated with the monitor. Select the link for a displayed service to view the service overview page, filtered by the HTTP monitor.

Monitored applications
HTTP monitors enable you to monitor internal resources and API endpoints, for example, for key backend APIs for login or search operations used by your mobile apps. You can link such HTTP monitors to the monitored mobile, web, or custom applications. Select Assign monitor to application. (You can link an application directly in monitor settings.)

If Real User Monitoring (RUM) is enabled for the applications your synthetic monitor runs against, Dynatrace automatically links the RUM applications to the monitor, and the Monitored applications card is displayed. You can see the key metrics of the application and jump directly to RUM data from here.
After you've linked an HTTP monitor to an application, synthetic monitor availability is displayed directly in application details, and Davis automatically associates detected synthetic monitoring problems with the linked application.
Note that you cannot block Synthetic Monitoring traffic for RUM applications by excluding bots, spiders, or the IP addresses of Synthetic locations.
Problems
The Problems card shows performance (threshold violation) and availability (local or global outage) problems when you enable the respective thresholds in monitor settings. Expand the card to see active as well as resolved problems for the selected timeframe.
See Configure HTTP monitors for information on how to define performance and availability thresholds. See Synthetic calculations for how availability and performance are calculated and how problems are generated and dismissed. See the Synthetic alerting overview for alerting workflow and concepts, including setting up notification profiles and templates.
There are three main problem types for HTTP monitors:
- Global outage (availability)
- Local outage (availability)
- Performance threshold violation (performance problem for sum of all requests or individual requests)

- Performance problems may combine threshold violations at the monitor as well as request levels.
- Concurrently occurring problems may be combined into a single problem (Multiple application problems).
Select a problem to view the problem overview page. Drill further into the problem to see the HTTP details page filtered by the problem duration.
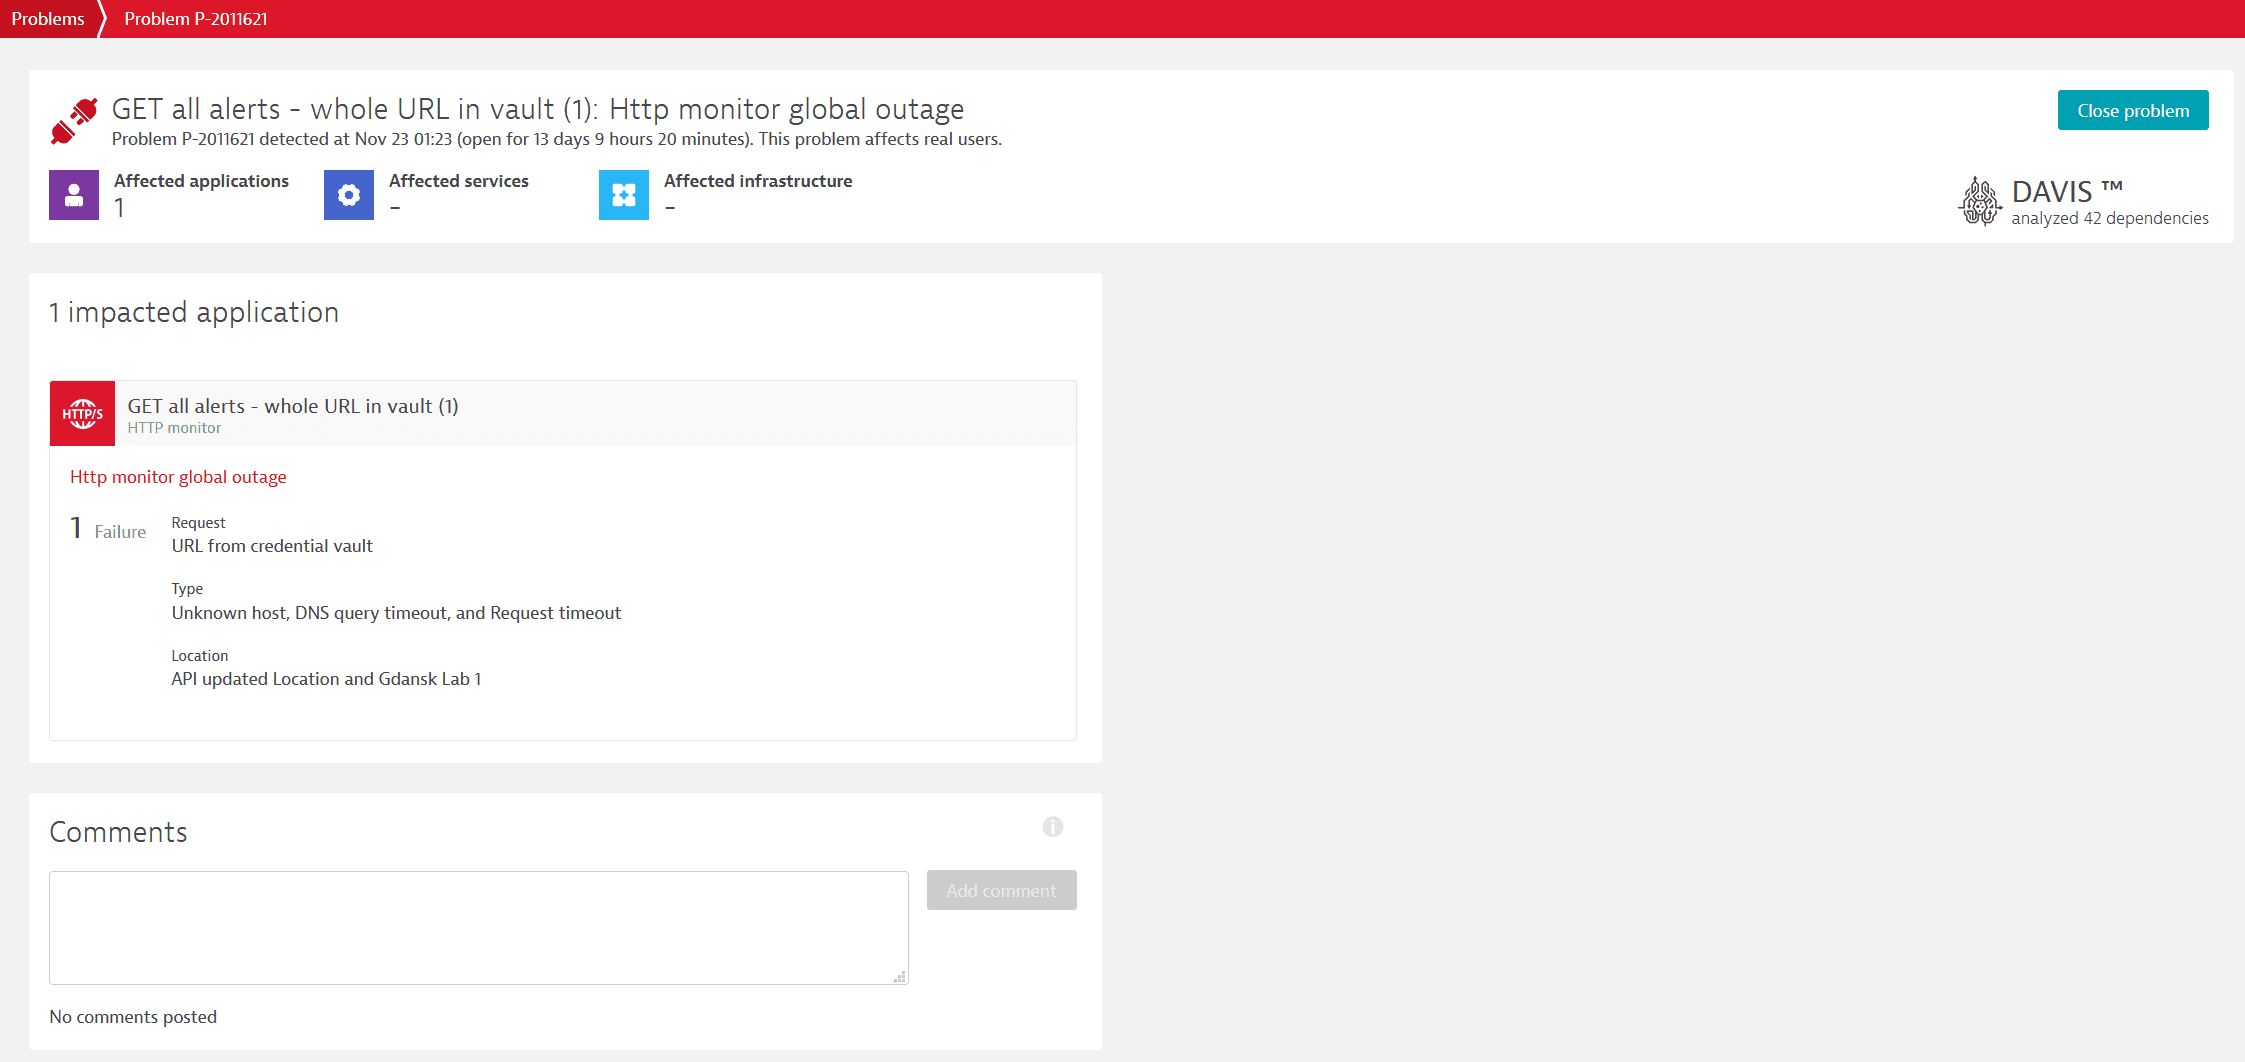
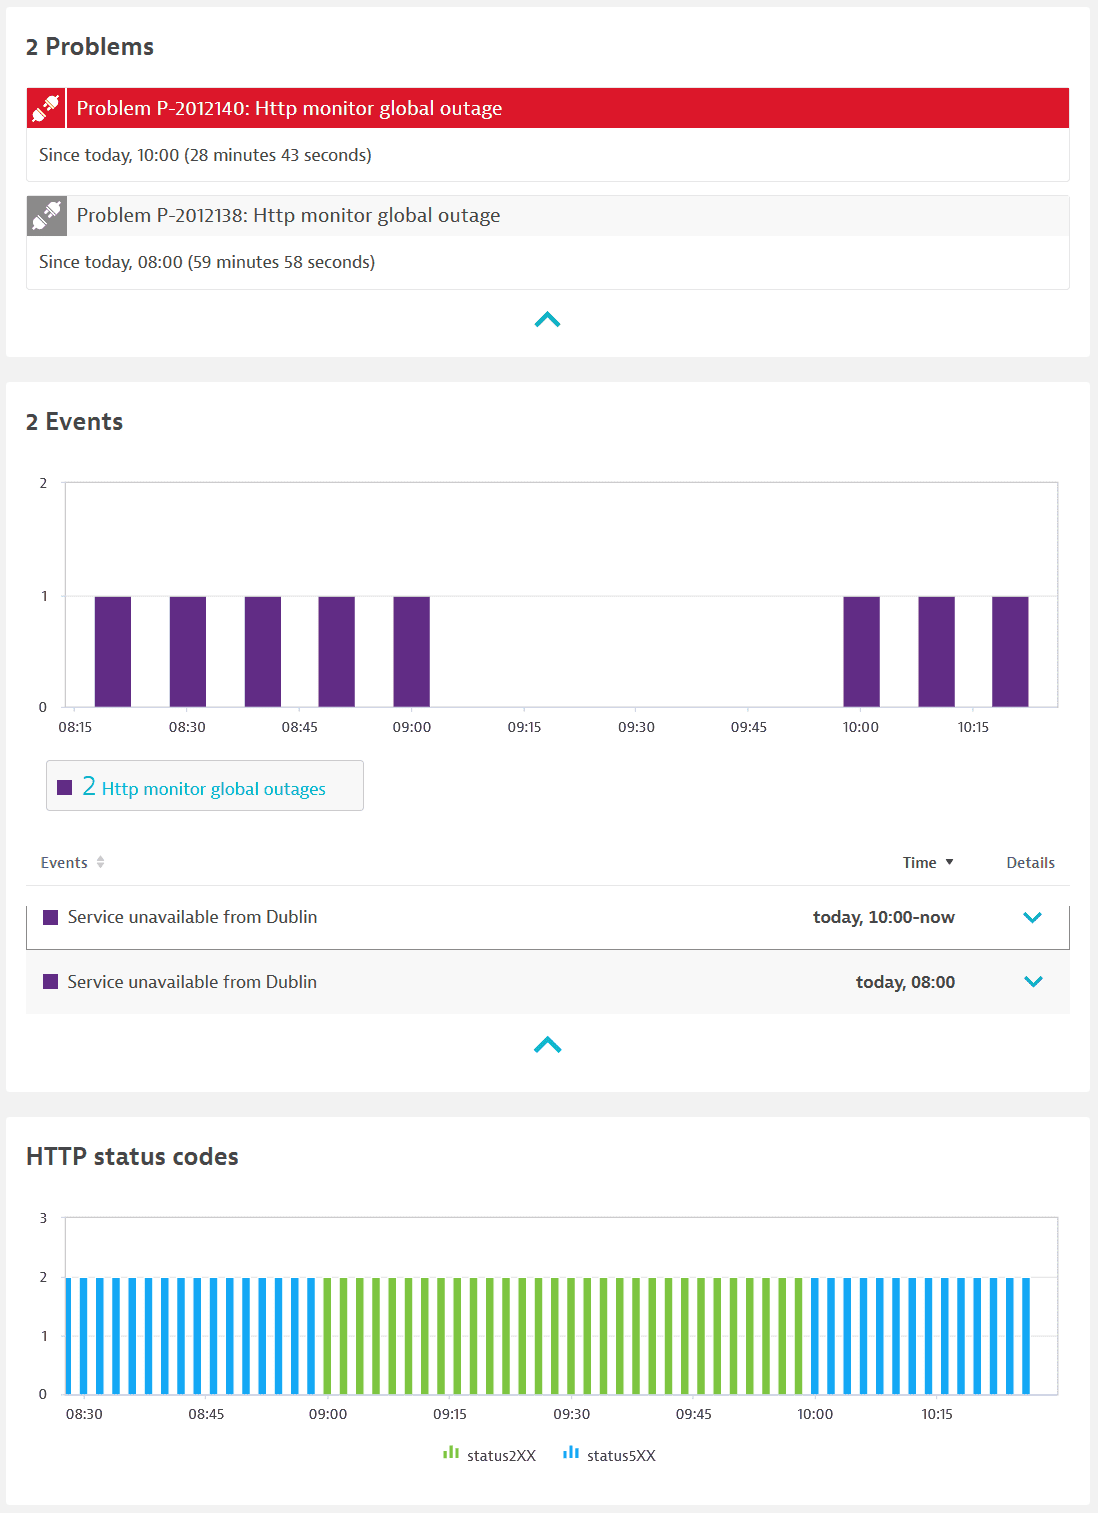
Problems, along with their constituent events and any corresponding status codes give you a full picture of the number and scope of your monitor's issues.
Events
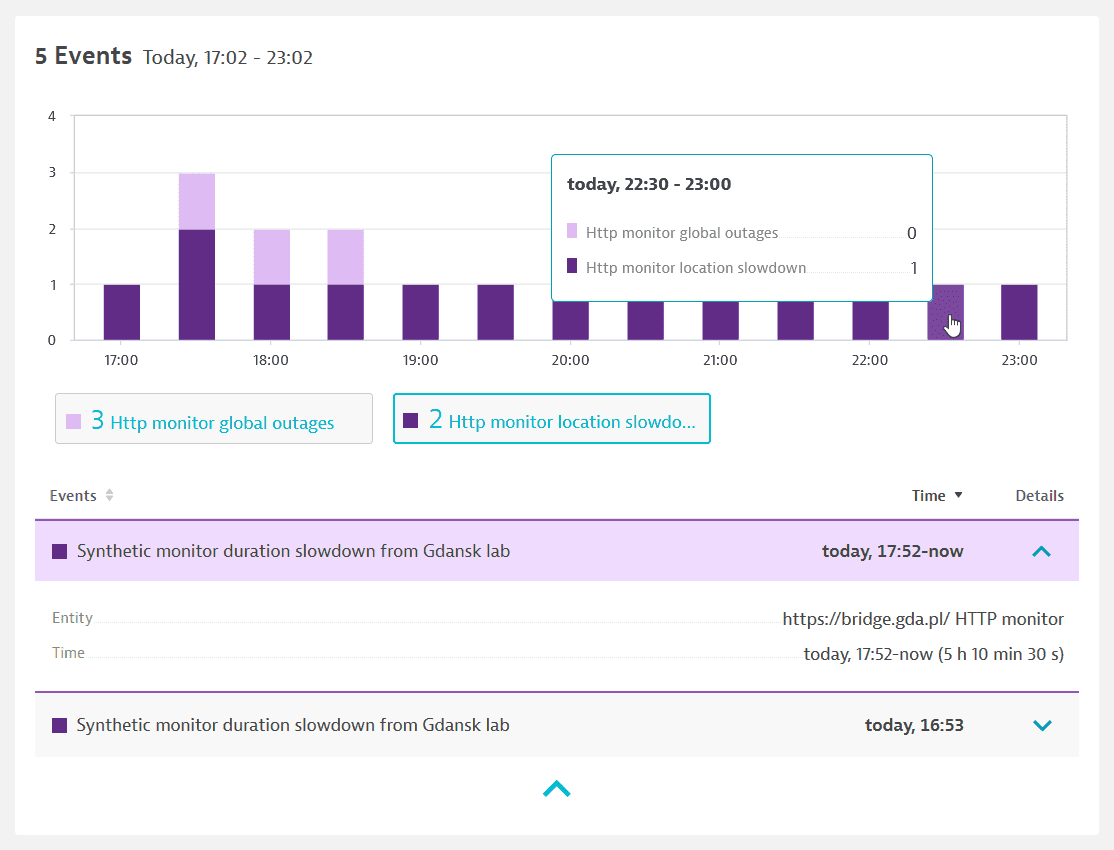
The Events card shows all events that compose problems. Events for active as well as resolved problems show up in the list and timeline.
Hover over a time slot in the event timeline to see the type and number of events generated in that interval. Select a time slot to view a tooltip with the events that took place in it.
Select an event type, for example, HTTP monitor location slowdown, to see the list of events. There is always one slowdown event created per location where your monitor violates request- or monitor-level performance thresholds. Select an individual event to see details.
The api.fail() method can be used to define a custom Failure message that appears in the Events card in case of failure. Custom log messages also appear in the customLogs attribute in HTTP monitor execution details.
Failed requests
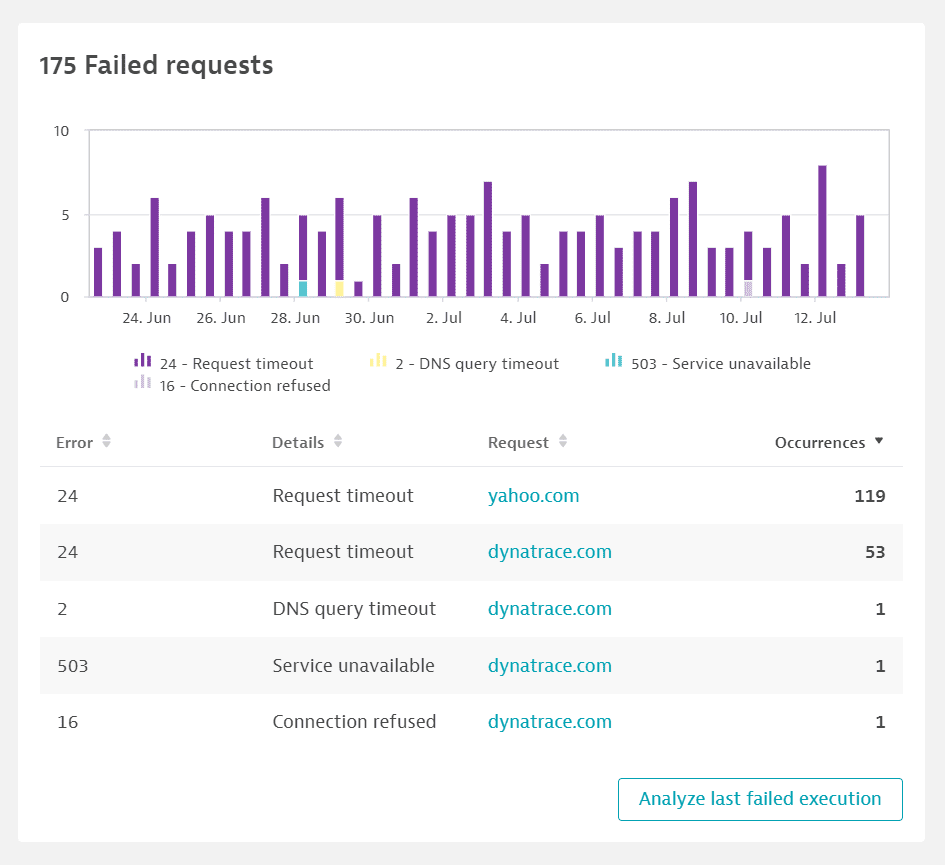
The Failed requests card shows the count of every failed request in your HTTP monitor executions within the selected timeframe, broken down by request name and error code. The timeline graph shows the count of error codes—hover over any time slot to see the count of different status codes in that interval. Select an error code in the legend to hide/show it in the graph.
Select a request name to edit it in monitor settings. Select Analyze last failed execution to see the most recent failed and successful executions in JSON format.
Note that a monitor that experiences downtime due to failed requests will only trigger outage problems when outage thresholds have been set up.
HTTP status codes
The HTTP status codes card displays the timeline of returned HTTP status codes for your HTTP monitor executions as a whole, which is the status code for the last executed request in the monitor, whether successful or failed. If your monitor has multiple requests, say, three, and the monitor fails at the second request, the third request is not executed. The status code reported is for the second request.
Hover over any time slot in the timeline to see the count of different status codes during that interval. Select a status code in the legend to hide/show it in the graph.

Related topics
 Synthetic Classic