Manage results
See below how you can grasp information from the DQL query response in a structured and viable way.
Wrap lines
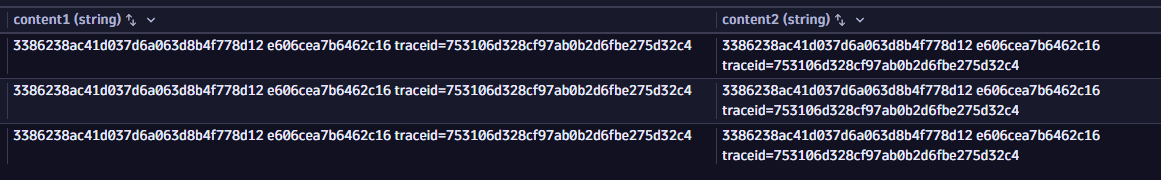
You can view longer log lines without horizontal scrolling with the Enable line wrap option. You can perform this action from the query results table menu without executing a query.
Example view when line wrapping is disabled (content1) and enabled (content2):
-
In the query results table menu, select the column header for the field you are interested in.
-
Select
 Enable line wrap.
To reverse this action, select
Disable line wrap.
View multiline logs
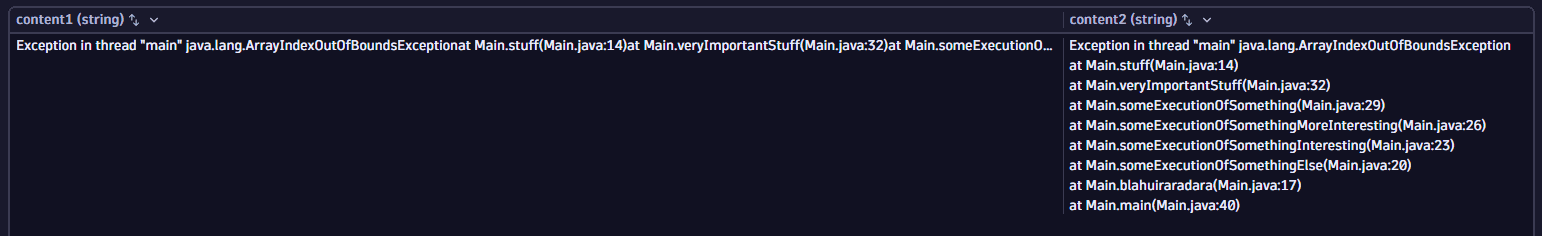
For a better understanding of data, you can view the multiline logs like stack traces with their line breaks and tabulation in their original form with the Enable multiline option. You can perform this action from the query results table without executing a query.
Example view when multiline is disabled (content1) and enabled (content2):
-
In the query results table menu, select the column header for the field you are interested in.
-
Select
 Enable multiline.
To reverse this action, select
Disable multiline.
View query metadata
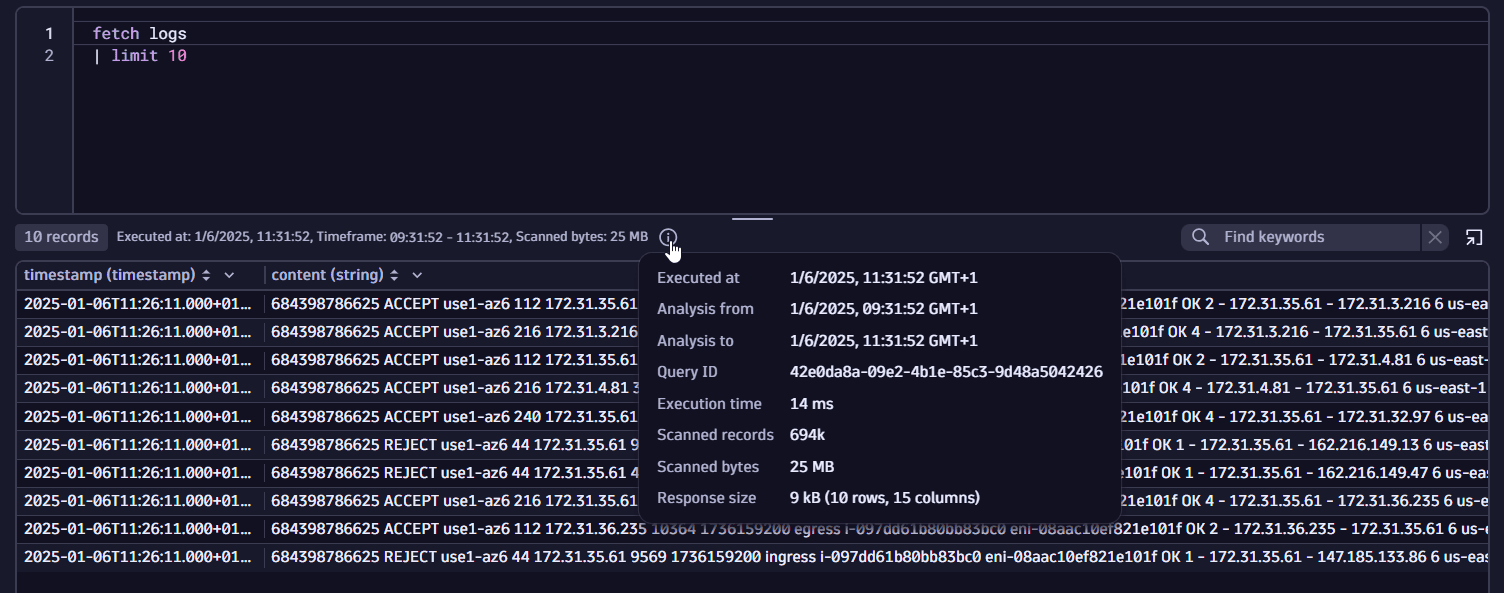
Once you execute a query, you can view the query metadata when you select the information icon below the query input.
Enhance queries
You can group and aggregate records with the same value for a given field with the Summarize option, available from the query results header menu or from the record details window. Selecting this option modifies the current query and adds the summarize command to the query input.
Explore data in the original format
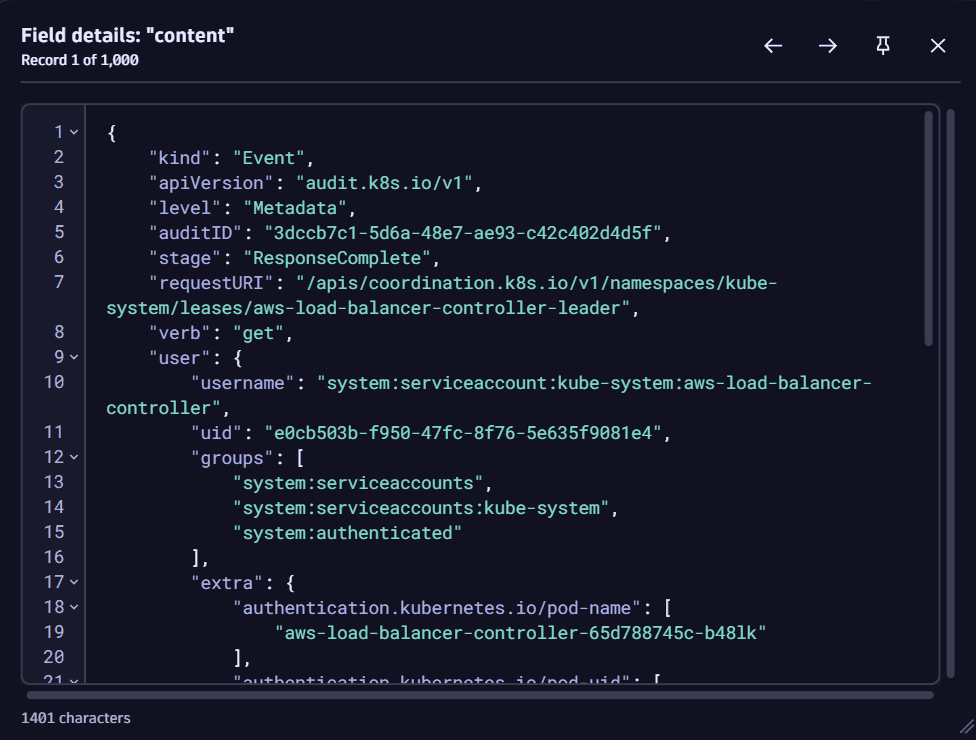
- With the View field details option, you can examine the data in its original format, regardless of the content, and without horizontal scrolling, even if it contains non-printables like tabs, multiple spaces, or line breaks. Security Investigator recognizes and formats popular data structures like JSON, making it easier to read in the field details view.
- With the View record details option, you can display a single selected record in a pivoted way. All fields are displayed vertically, thus saving you time from horizontal scrolling and enabling faster access to the data.
Example field view
-
Data in a field:

-
Data in a field upon viewing details:
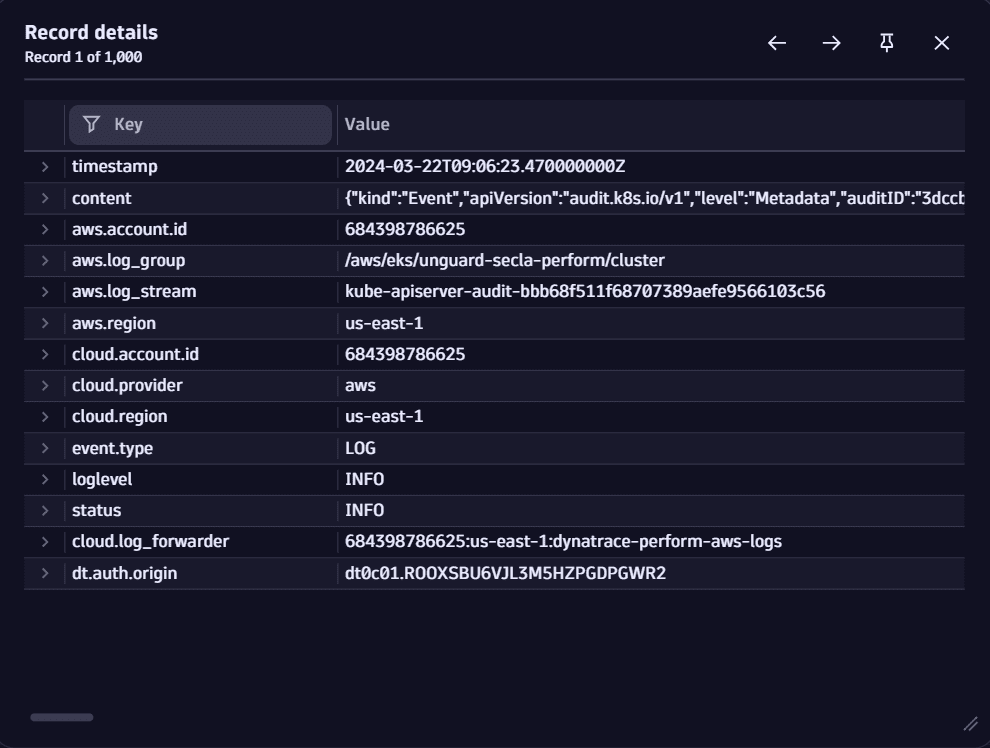
Example record view
-
Data in a record:

-
Data in a record upon viewing details:
How to view details
In the query results table, right-click on a field and select View field details or View record details.
- To view record details, you can also double-click on any record in the query results table.
- You can use keyboard arrows (or arrows in the record details window) to navigate between records: you don't have to close the window to open the next record; just use your keyboard.
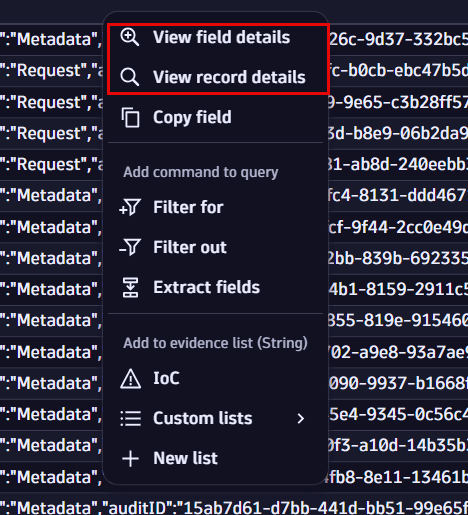
Selecting one of these options opens the field or record details window. From there, your investigation is supported with further options such as filter, extract fields, open in other apps, add evidence, and add fields.
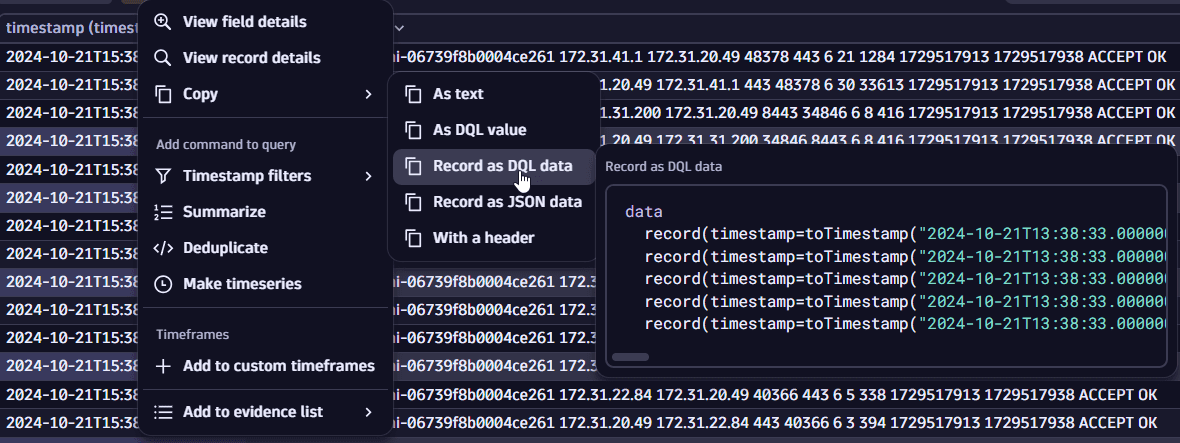
Copy results in various formats
For faster access to data in the results, the Copy option in the query results table menu allows you to copy selected results in different formats, according to your needs.
-
In the query results table, select what you want to copy (partial or full value of a field or multiple fields).
-
Select Copy, then select one of the available format options.
Hover over the available options to display a preview of the output before making a selection.
Available options are described below.
-
As text: Copy value as text. -
With a header: When selecting multiple records, copy them as text with the column name as a header.-
Example result:
timestamp2024-03-06T22:25:23.811000000Z2024-03-06T22:25:24.825000000Z2024-03-06T22:25:22.682000000Z2024-03-06T22:25:22.710000000Z2024-03-06T22:25:22.736000000Z
-
-
As DQL value: Copy value in DQL format.-
Example result:
toTimestamp("2024-09-13T08:06:43Z")
-
-
Record as DQL data: Copy record in DQL format.-
Example result:
data record(timestamp=toTimestamp("2024-09-13T08:06:43Z"),content="some content",number=1231,technologies=array("Java", “tomcat”))
-
-
Record as JSON data: Copy record as a JSON object.-
Example result:
{"timestamp": "2024-09-13T08:06:43Z","content": "some content","number": 1231,"technologies": ["Java","Tomcat"]}
-
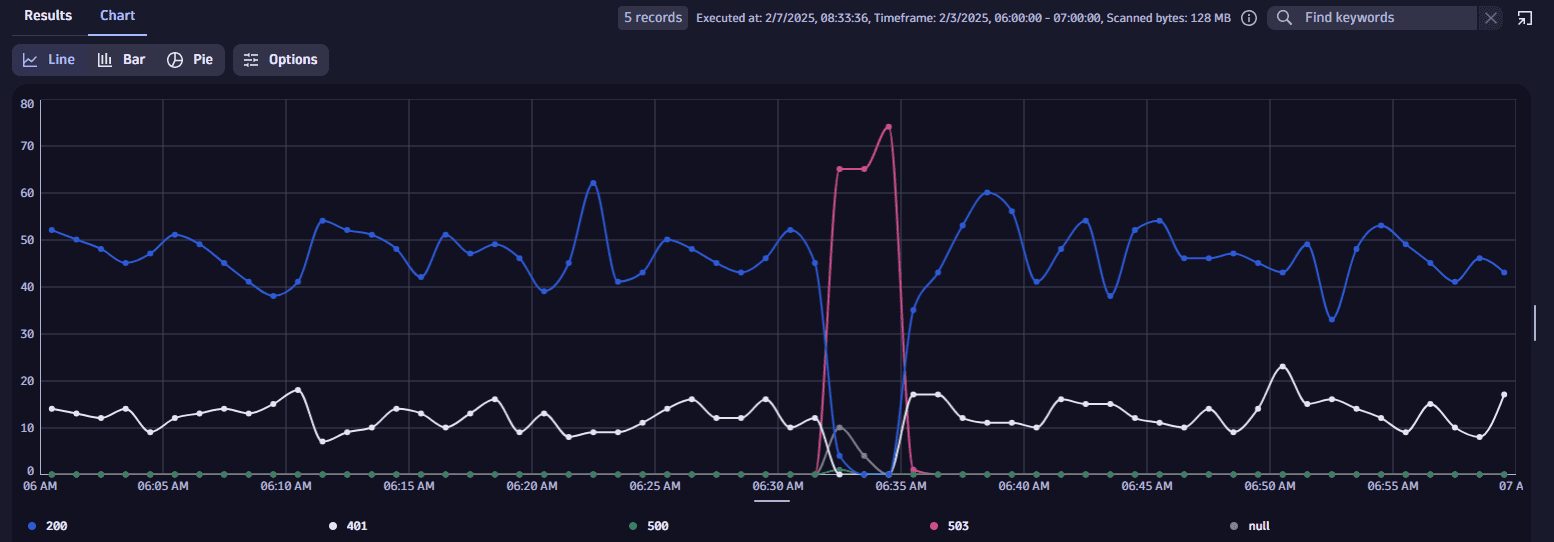
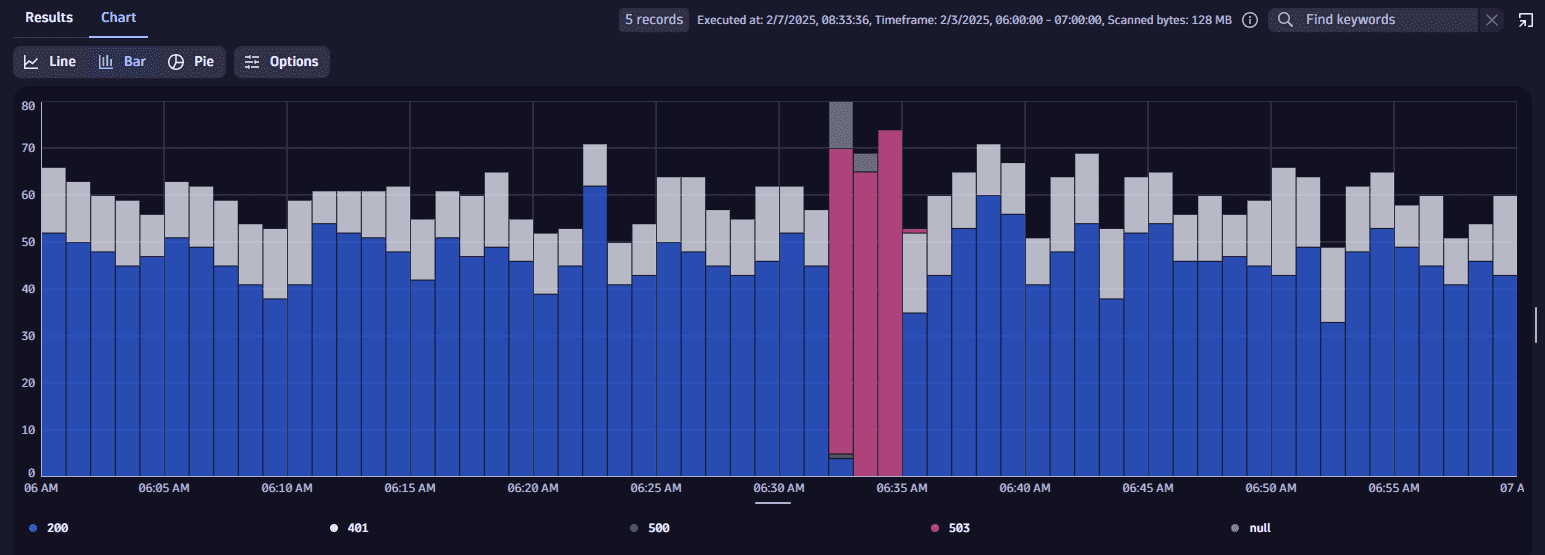
Visualize with charts
Once you execute a query, if the results can be visualized as a chart, the Chart option becomes available next to Results.
Example charts:
-
Line charts
-
Bar charts
-
Pie charts
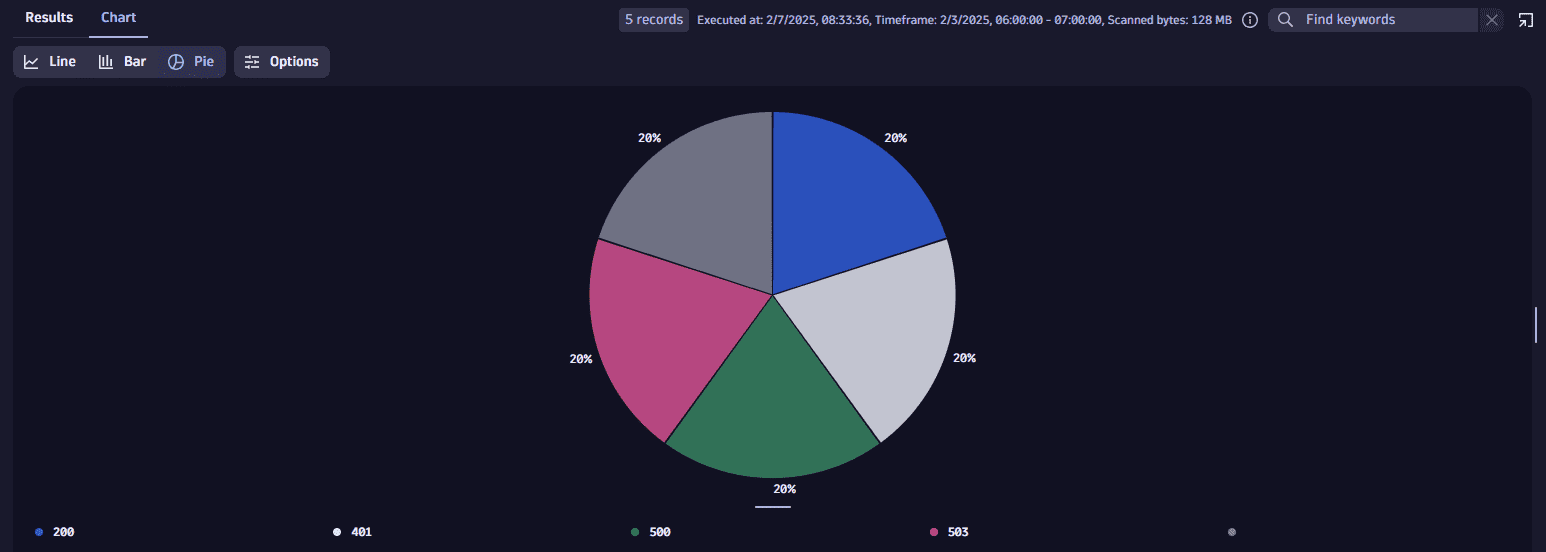
You can configure the charts display in Chart > Options.