Best practices for optimizing network monitoring cost
- Latest Dynatrace
- Best practices
- 8-min read
- Published Apr 28, 2026
Network monitoring costs can grow quickly as you expand device coverage, add interfaces, and select additional feature sets. This guide helps you identify the key cost drivers and take targeted action to reduce them without sacrificing visibility.
The primary cost driver is metrics ingestion. Because retention is included at no cost for the first 15 months and queries are included at no cost, your bill is determined by what you collect—not how long you keep it or how often you query it.
The recommended approach is to start lean by enabling the default feature set first, then expand only for specific, well-defined use cases. This keeps your ingestion footprint minimal by default and ensures every additional metric collected has a clear purpose.
To put this approach into practice, this guide walks you through:
- Understanding ingestion costs: How network monitoring ingestion is calculated and what drives volume.
- Identifying your top cost drivers: How to use DQL queries to pinpoint the devices, interfaces, and feature sets contributing most to your costs before expanding coverage.
- Reducing ingestion at the source: How to lower costs by disabling unused feature sets and filtering out interfaces that don't require monitoring.
- Maintaining cost control over time: How to validate cardinality and use cost allocation to stay in control as your environment grows.
Core concepts
You should understand these core concepts before onboarding and optimizing your network monitoring in Dynatrace.
| Term | Definition |
|---|---|
Feature set | A feature set is a group of metric keys defined in Extensions. You can limit monitoring to one of the feature sets. The default feature set can't be deselected; its metrics are always collected. |
Recommended feature set | A feature set that significantly improves device observability. It is not mandatory and can be deselected. |
Interface | An interface is a network device interface (physical or logical). Metrics are split by interface, producing one timeseries per interface. |
Before continuing, review the core metrics concepts in Best practices for optimizing metrics cost.
Understand cost
Understand how Dynatrace bills for network monitoring
Metrics ingestion is billed based on the number of stored metric data points. An increase in metric data points directly leads to higher consumption.
The number of ingested metric data points depends on three factors:
- The number of metrics
- Cardinality
- Collection intervals
Any increase in these factors leads to higher consumption. The more feature sets are selected, the more metrics are collected. The more devices and interfaces are monitored, the more timeseries each metric produces.
For example, a metric split by dimensions (such as device and interface) creates one timeseries for each distinct combination. The more combinations, the higher the cardinality, and the more data points generated per collection cycle.
Collection intervals are fixed at 1 minute for all network monitoring metrics. You can't adjust the collection interval for these extensions.
Select only the feature sets you need
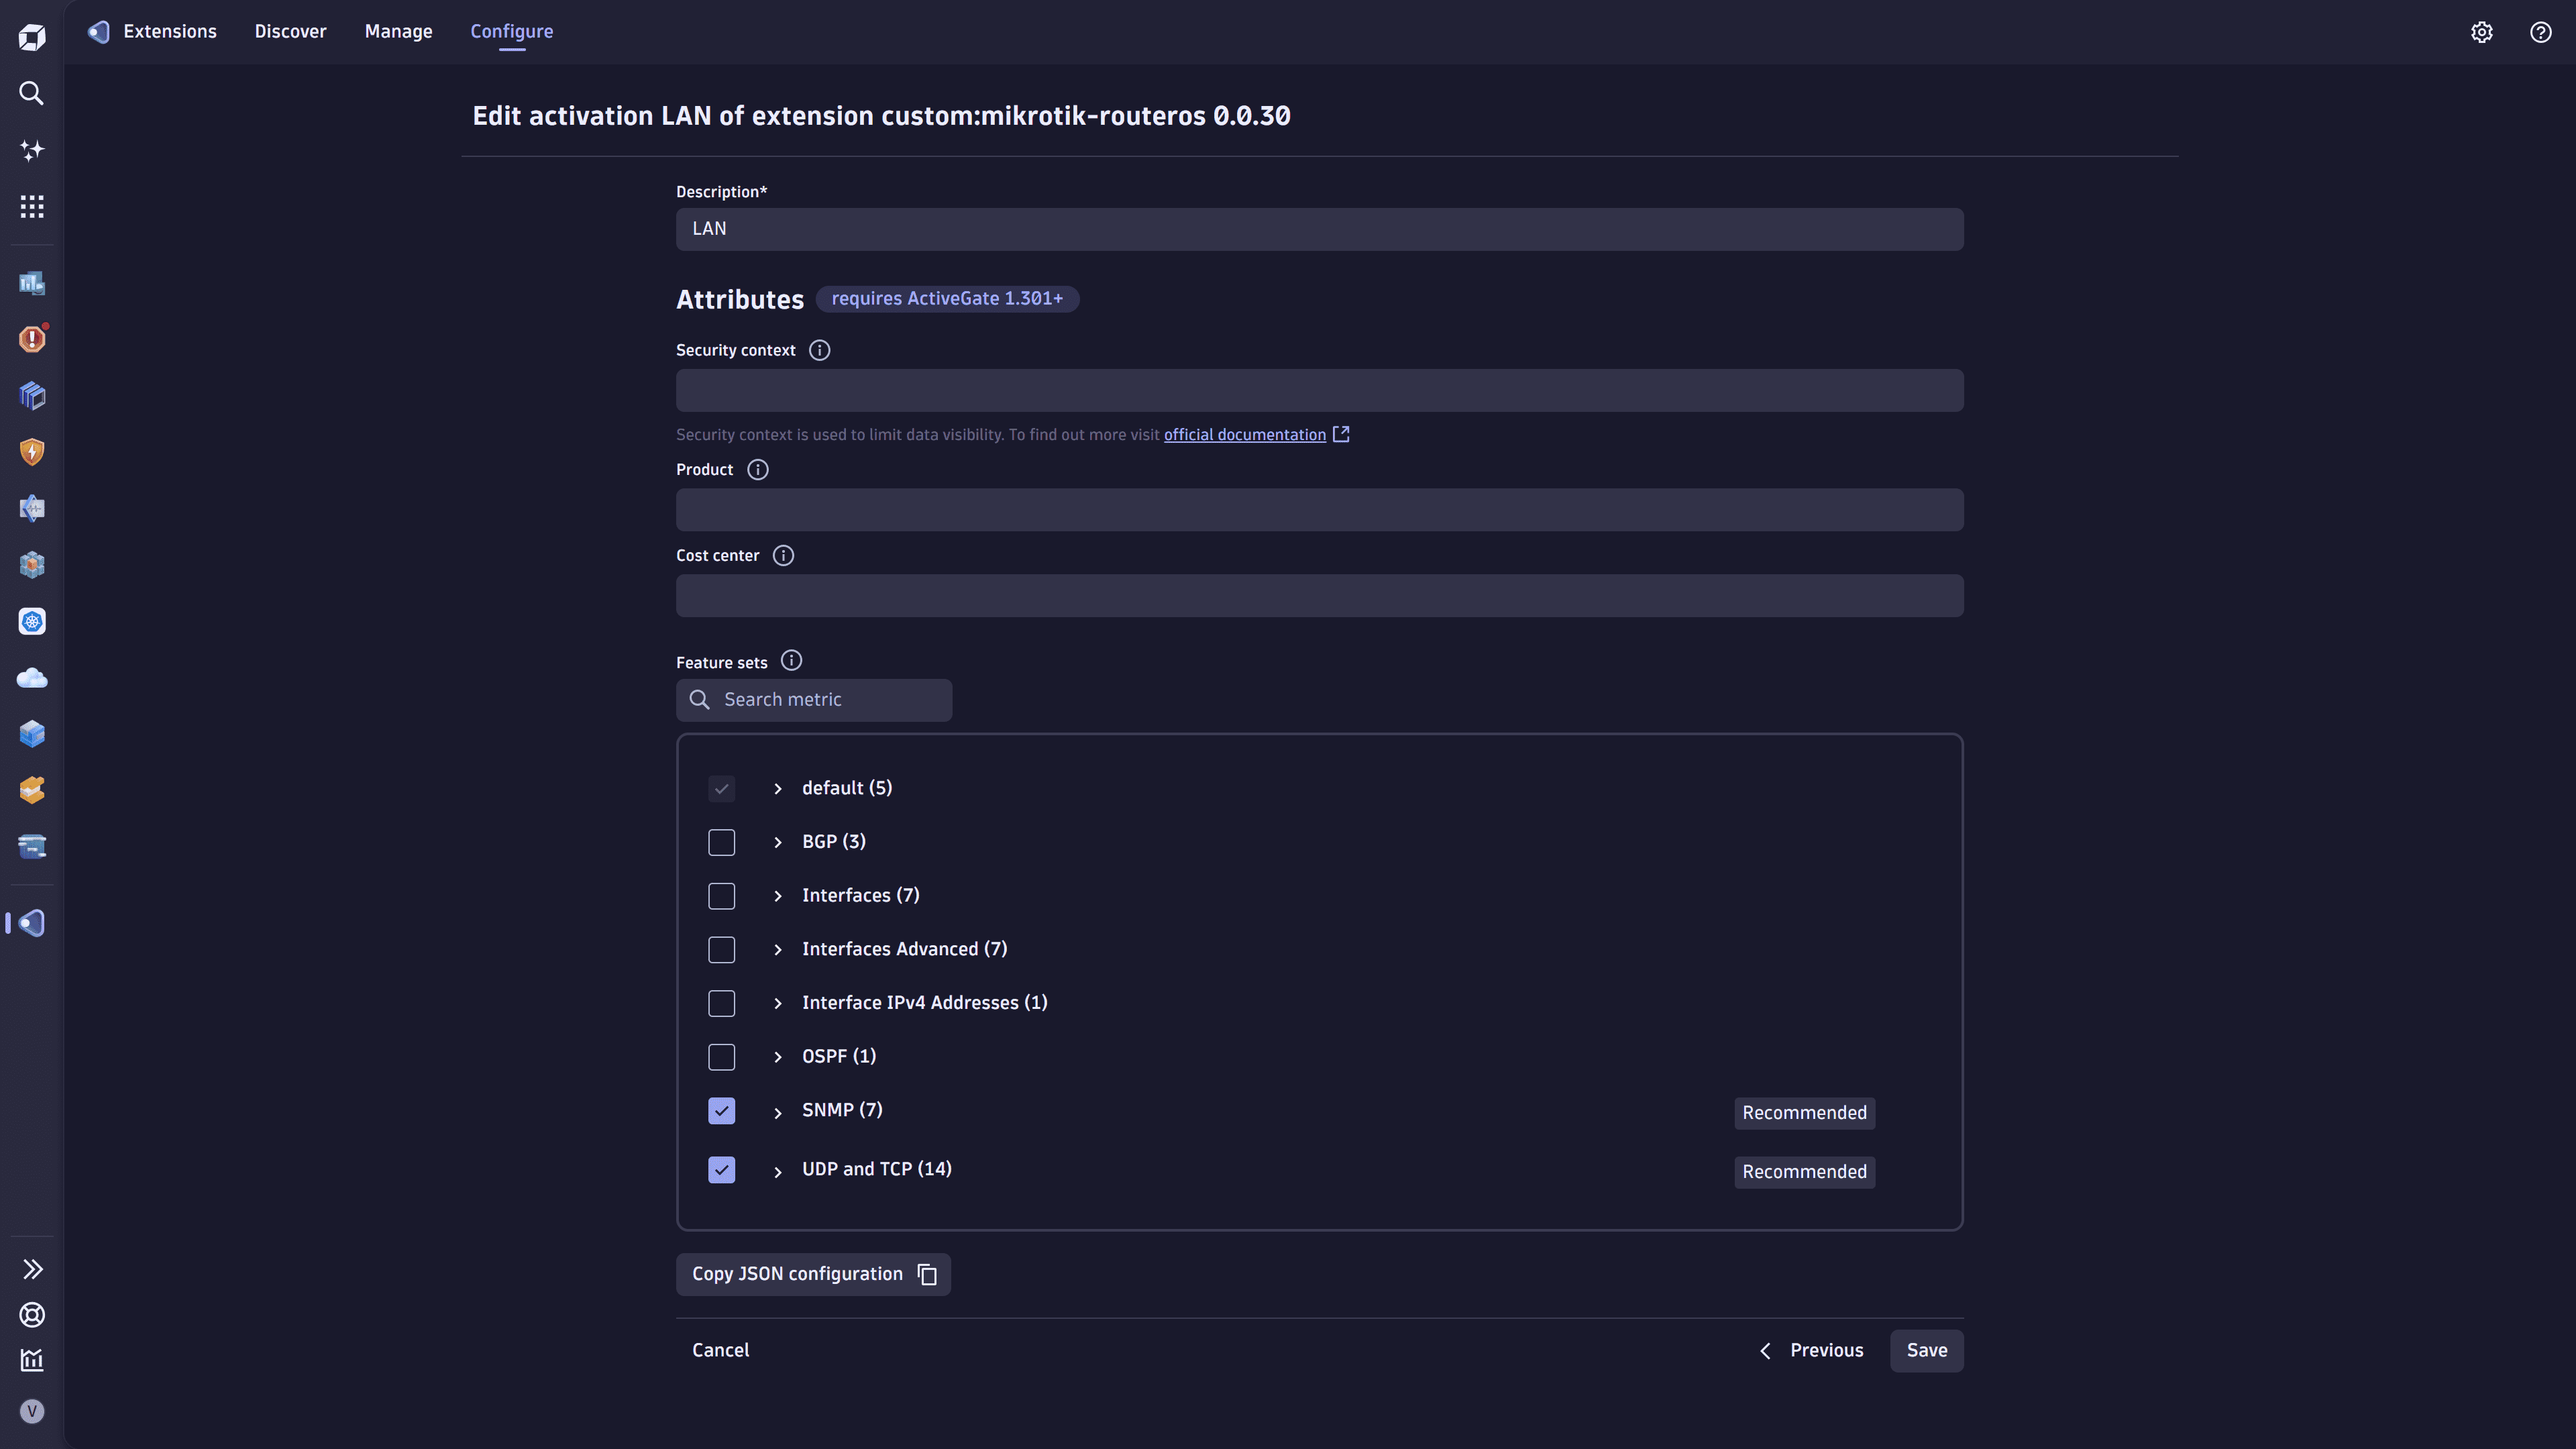
Network monitoring metrics are organized into feature sets that cover basic and advanced network observability needs. In addition to the always-on default feature set, select only the feature sets you currently need. This reduces initial cost and alerting noise.
Add feature sets only where they support specific use cases (alerts, troubleshooting data, dashboards).
To manage feature sets
- Go to
 Extensions.
 - Select the extension and go to Monitoring configurations.
- Choose a monitoring configuration and select > Edit.
- Select the feature sets you need.
- Select Save to save the configuration.
The sections below describe each feature set and help you select the appropriate ones based on your monitoring objectives.
Basic device and interface monitoring
Basic device and interface monitoring for all interfaces in the network.
The default feature set is always on and can't be deselected.
Metrics collected: 4 metrics per device + 2 metrics per collected interface.
Metrics description
| Metric | Description |
|---|---|
Sysuptime | Time in ticks since device startup (1/100 s) |
CPU usage | CPU (%) |
Memory used | Control plane memory used (KB) |
Memory free | Control plane memory free (KB) |
Memory total | Control plane memory total (KB) |
Interface administrative status | — |
Interface operational status | — |
If only control-plane data (CPU, memory) is needed, you can remove interface collection using a filter. See Drop metrics and reduce cardinality.
Calculation example
With only the default feature set selected, 4 metrics per device and 2 metrics per interface are collected for all interfaces that are administratively up (meaning the interface is enabled, as opposed to "administratively down" for disabled interfaces).
The example below uses a network of 10,000 devices:
- Floor switch: Connects employees' PCs; 2 uplinks and 48 downlink interfaces; 26 interfaces are administratively up.
- Aggregation switch: Aggregates traffic from multiple locations.
- Edge router: Connects a remote location to the internet; 2 uplinks (wired and 5G backup) and 2 downlink interfaces.
| Device type | Count | Collected interfaces per device |
|---|---|---|
Floor switch | 3,000 | 26 |
Aggregation switch | 1,000 | 30 |
Edge router | 6,000 | 4 |
Estimated consumption:
- Total timeseries: 304,000
- Floor switches: 168,000 = (3,000 × 4 metrics) + (3,000 × 26 interfaces × 2 metrics)
- Aggregation switches: 64,000 = (1,000 × 4 metrics) + (1,000 × 30 interfaces × 2 metrics)
- Edge routers: 72,000 = (6,000 × 4 metrics) + (6,000 × 4 interfaces × 2 metrics)
- Metrics ingestion volume per month: 304,000 × 60 min × 24 h × 30 days = 13.1 billion metric data points
Traffic volume and basic health
Per-interface traffic volume and well-known health indicators for the most important interfaces.
Select the Interfaces feature set. This feature set enriches the generic interface entities collected by the default feature set with new metrics; it doesn't create new entities.
Metrics collected: 7 metrics per collected interface.
Metrics description
| Metric key | Description |
|---|---|
Incoming traffic | Number of bytes entering the interface |
Outgoing traffic | Number of bytes leaving the interface |
Inbound errors | Number of inbound packets/transmission units with errors |
Outbound errors | Number of outbound packets/transmission units with errors |
Inbound discards | Number of inbound packets discarded |
Outbound discards | Number of outbound packets discarded |
Interface last change | Last timestamp (ticks) at which the interface operational status changed |
Calculation example
With the default and Interfaces feature sets selected, 4 metrics per device and 9 metrics per interface are collected for all interfaces that are administratively up. In this scenario, only the 5 most important interfaces per device are monitored by using the interface filtering mechanism available for all network extensions.
| Device type | Count | Collected interfaces per device |
|---|---|---|
Floor switch | 3,000 | 5 |
Aggregation switch | 1,000 | 5 |
Edge router | 6,000 | 5 |
Estimated consumption:
- Total timeseries: 490,000
- All device types: 490,000 = (10,000 × 4 metrics) + (10,000 × 5 interfaces × 9 metrics)
- Metrics ingestion volume per month: 490,000 × 60 min × 24 h × 30 days = 21.2 billion metric data points
Packet metrics
Packet metrics and per-packet error ratio calculation.
Select the Advanced Interfaces feature set. This feature set enriches the metrics collected by the default and Interfaces feature sets with new metrics; it doesn't create new entities.
The Advanced Interfaces feature set is designed to be used together with the Interfaces feature set. It can also be used in isolation if only packet counts are needed.
Metrics collected: 7 metrics per collected interface.
Metrics description
| Metric | Description |
|---|---|
Inbound Unicast | Number of inbound unicast packets |
Outbound Unicast | Number of outbound unicast packets |
Inbound Multicast | Number of inbound multicast packets |
Outbound Multicast | Number of outbound multicast packets |
Inbound Broadcast | Number of inbound broadcast packets |
Outbound Broadcast | Number of outbound broadcast packets |
CRC errors | Number of input packets with cyclic redundancy checksum errors |
Calculation example
With the default, Interfaces, and Advanced Interfaces feature sets selected, 4 metrics per device and 16 metrics per interface are collected. Only important interfaces that are administratively up are collected.
- Floor switch: 2 uplink interfaces
- Aggregation switch: all interfaces are collected, as each is critical to network health
- Edge router: 2 uplink interfaces (wired and 5G backup)
| Device type | Count | Collected interfaces per device |
|---|---|---|
Floor switch | 3,000 | 2 |
Aggregation switch | 1,000 | 30 |
Edge router | 6,000 | 2 |
Estimated consumption:
- Total timeseries: 808,000
- Floor switches: 108,000 = (3,000 × 4 metrics) + (3,000 × 2 interfaces × 16 metrics)
- Aggregation switches: 484,000 = (1,000 × 4 metrics) + (1,000 × 30 interfaces × 16 metrics)
- Edge routers: 216,000 = (6,000 × 4 metrics) + (6,000 × 2 interfaces × 16 metrics)
- Metrics ingestion volume per month: 808,000 × 60 min × 24 h × 30 days = 34.9 billion metric data points
Legacy or limited-resource devices
Supported only by the Generic Cisco and SNMP generic extensions.
Monitor old or limited-resource devices.
Select the Interfaces 32-bit feature set. For devices where 64-bit interface counters don't respond, this feature set provides equivalent metrics to the Interfaces feature set.
32-bit interface counters are rollover-prone and may produce incorrect metric values at regular intervals, depending on traffic volume.
Metrics collected: 2 metrics per collected interface.
Metrics description
| Metric | Description |
|---|---|
Octets received | Total number of octets received on the interface, including framing characters |
Octets transmitted | Total number of octets transmitted out of the interface, including framing characters |
Routing protocols: OSPF and EIGRP
Supported only by the Generic Cisco extension.
Route protocol visibility.
Select the OSPF and/or EIGRP feature sets, depending on your needs. Each feature set covers one routing protocol to offer granularity and account for device configurations. They use device-specific entities and create one entity per device.
Metrics collected: 1 metric per neighbor.
Metrics description
| Metric | Description |
|---|---|
OSPF neighbor state | State of the relationship with this neighbor |
EIGRP peer smooth round trip time | Computed smooth round trip time for packets to and from the peer (ms) |
BGP monitoring
Supported only by the Generic Cisco extension.
Two BGP feature sets are available:
Option 1: BGP (standard)
Select the BGP feature set for maximum compatibility.
Metrics collected: 3 metrics per BGP peer.
Metrics description
| Metric | Description |
|---|---|
BGP peer connection state | Peer connection state of the BGP feature set |
BGP peer admin status | Desired state of the BGP connection |
BGP peer established time | How long (in seconds) this peer has been in the established state, or how long since it was last established |
Option 2: Cisco BGP
Select the Cisco BGP feature set to cover Cisco devices that don't support generic BGP MIBs.
Metrics collected: 5 metrics per BGP peer.
Metrics description
| Metric | Description |
|---|---|
Cisco BGP peer established time | How long (in seconds) this peer has been in the established state, or how long since it was last established |
Cisco BGP updates received | Number of BGP UPDATE messages received from the peer |
Cisco BGP updates sent | Number of BGP UPDATE messages sent to the peer |
Cisco BGP peer state | BGP peer connection state |
Cisco BGP peer admin status | Desired state of the BGP connection |
Understand your network metrics ingest
Before optimizing metrics ingest, identify which network metrics are ingested and stored in Dynatrace and how they are distributed across your organization.
The DQL queries below can be run in Dynatrace using  Notebooks,
  Dashboards, or
  Workflows.
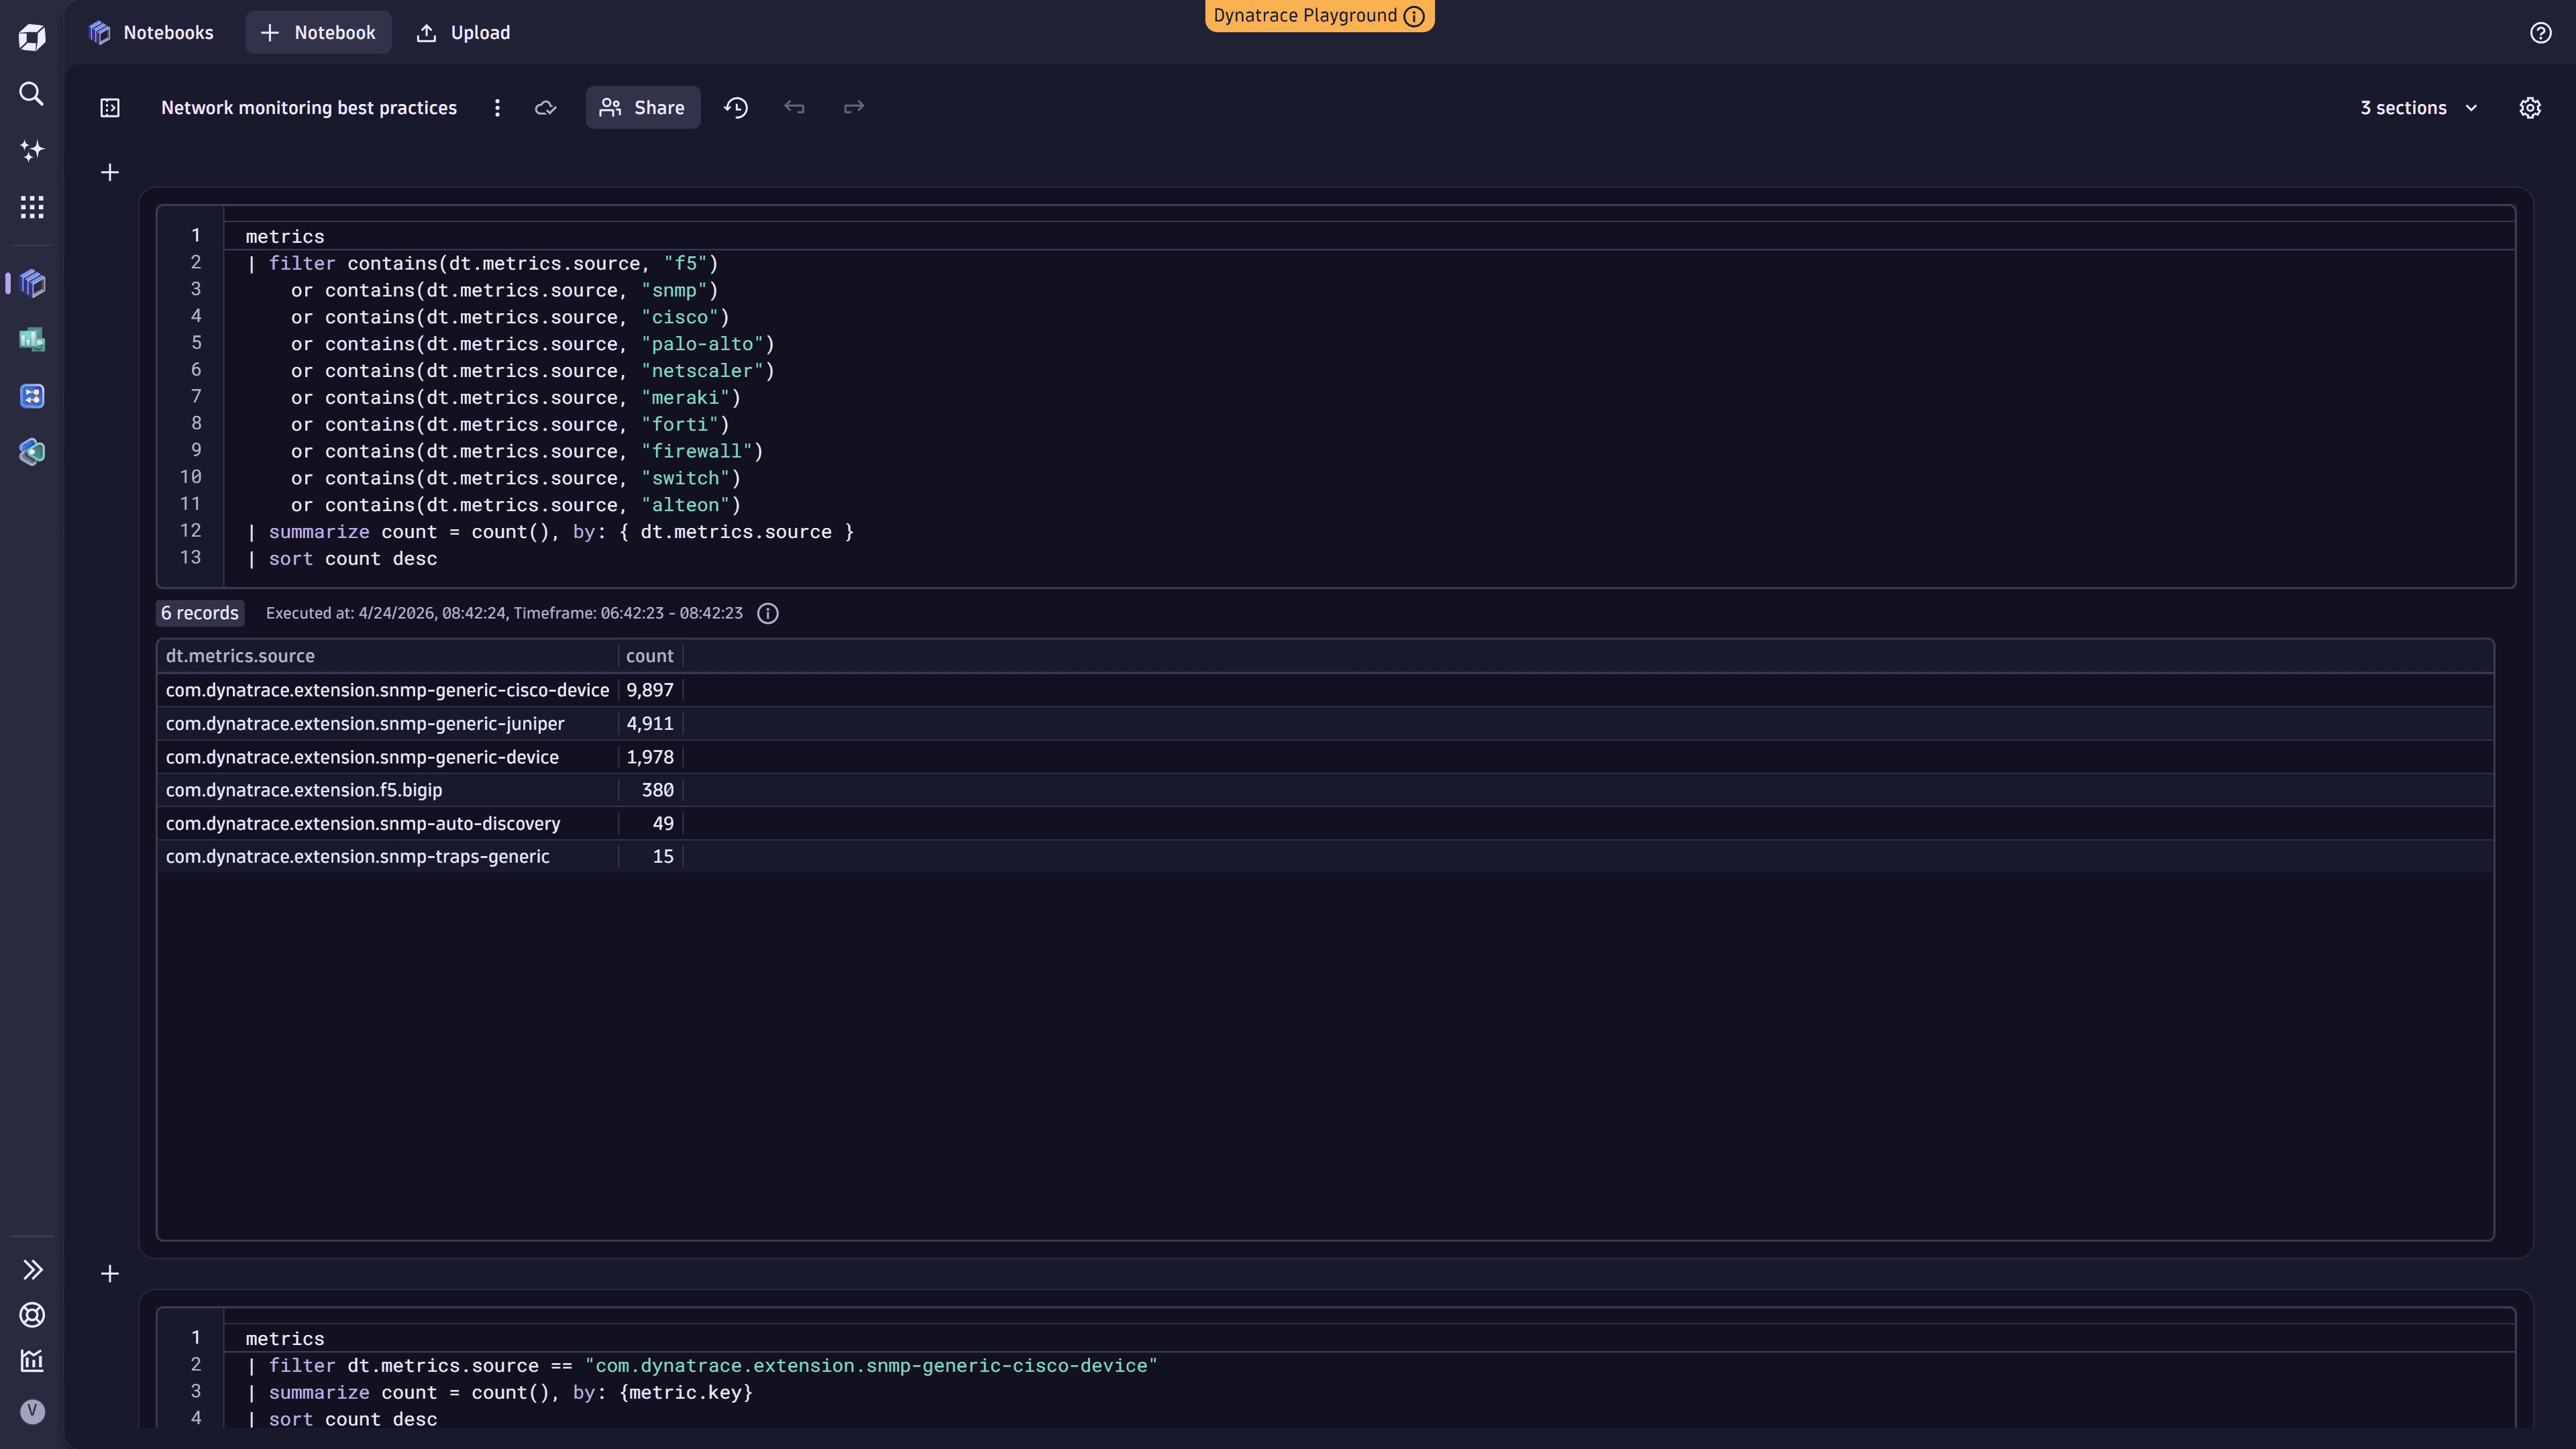
1. Find high-cardinality network metric sources
Identify which network metric sources contribute the most to your metric cardinality. This helps pinpoint which metric sources ingest the most metrics so you can target optimization efforts where they have the greatest impact.
The metrics command scans a maximum of 100,000 series. For large environments, results may be truncated. If you hit this limit, use the queries in the next step to narrow the query scope.
For details, see DQL metric commands.
metrics| filter contains(dt.metrics.source, "f5")or contains(dt.metrics.source, "snmp")or contains(dt.metrics.source, "cisco")or contains(dt.metrics.source, "palo-alto")or contains(dt.metrics.source, "netscaler")or contains(dt.metrics.source, "meraki")or contains(dt.metrics.source, "forti")or contains(dt.metrics.source, "firewall")or contains(dt.metrics.source, "switch")or contains(dt.metrics.source, "alteon")| summarize count = count(), by: { dt.metrics.source }| sort count desc
The following example shows the query executed in Notebooks:
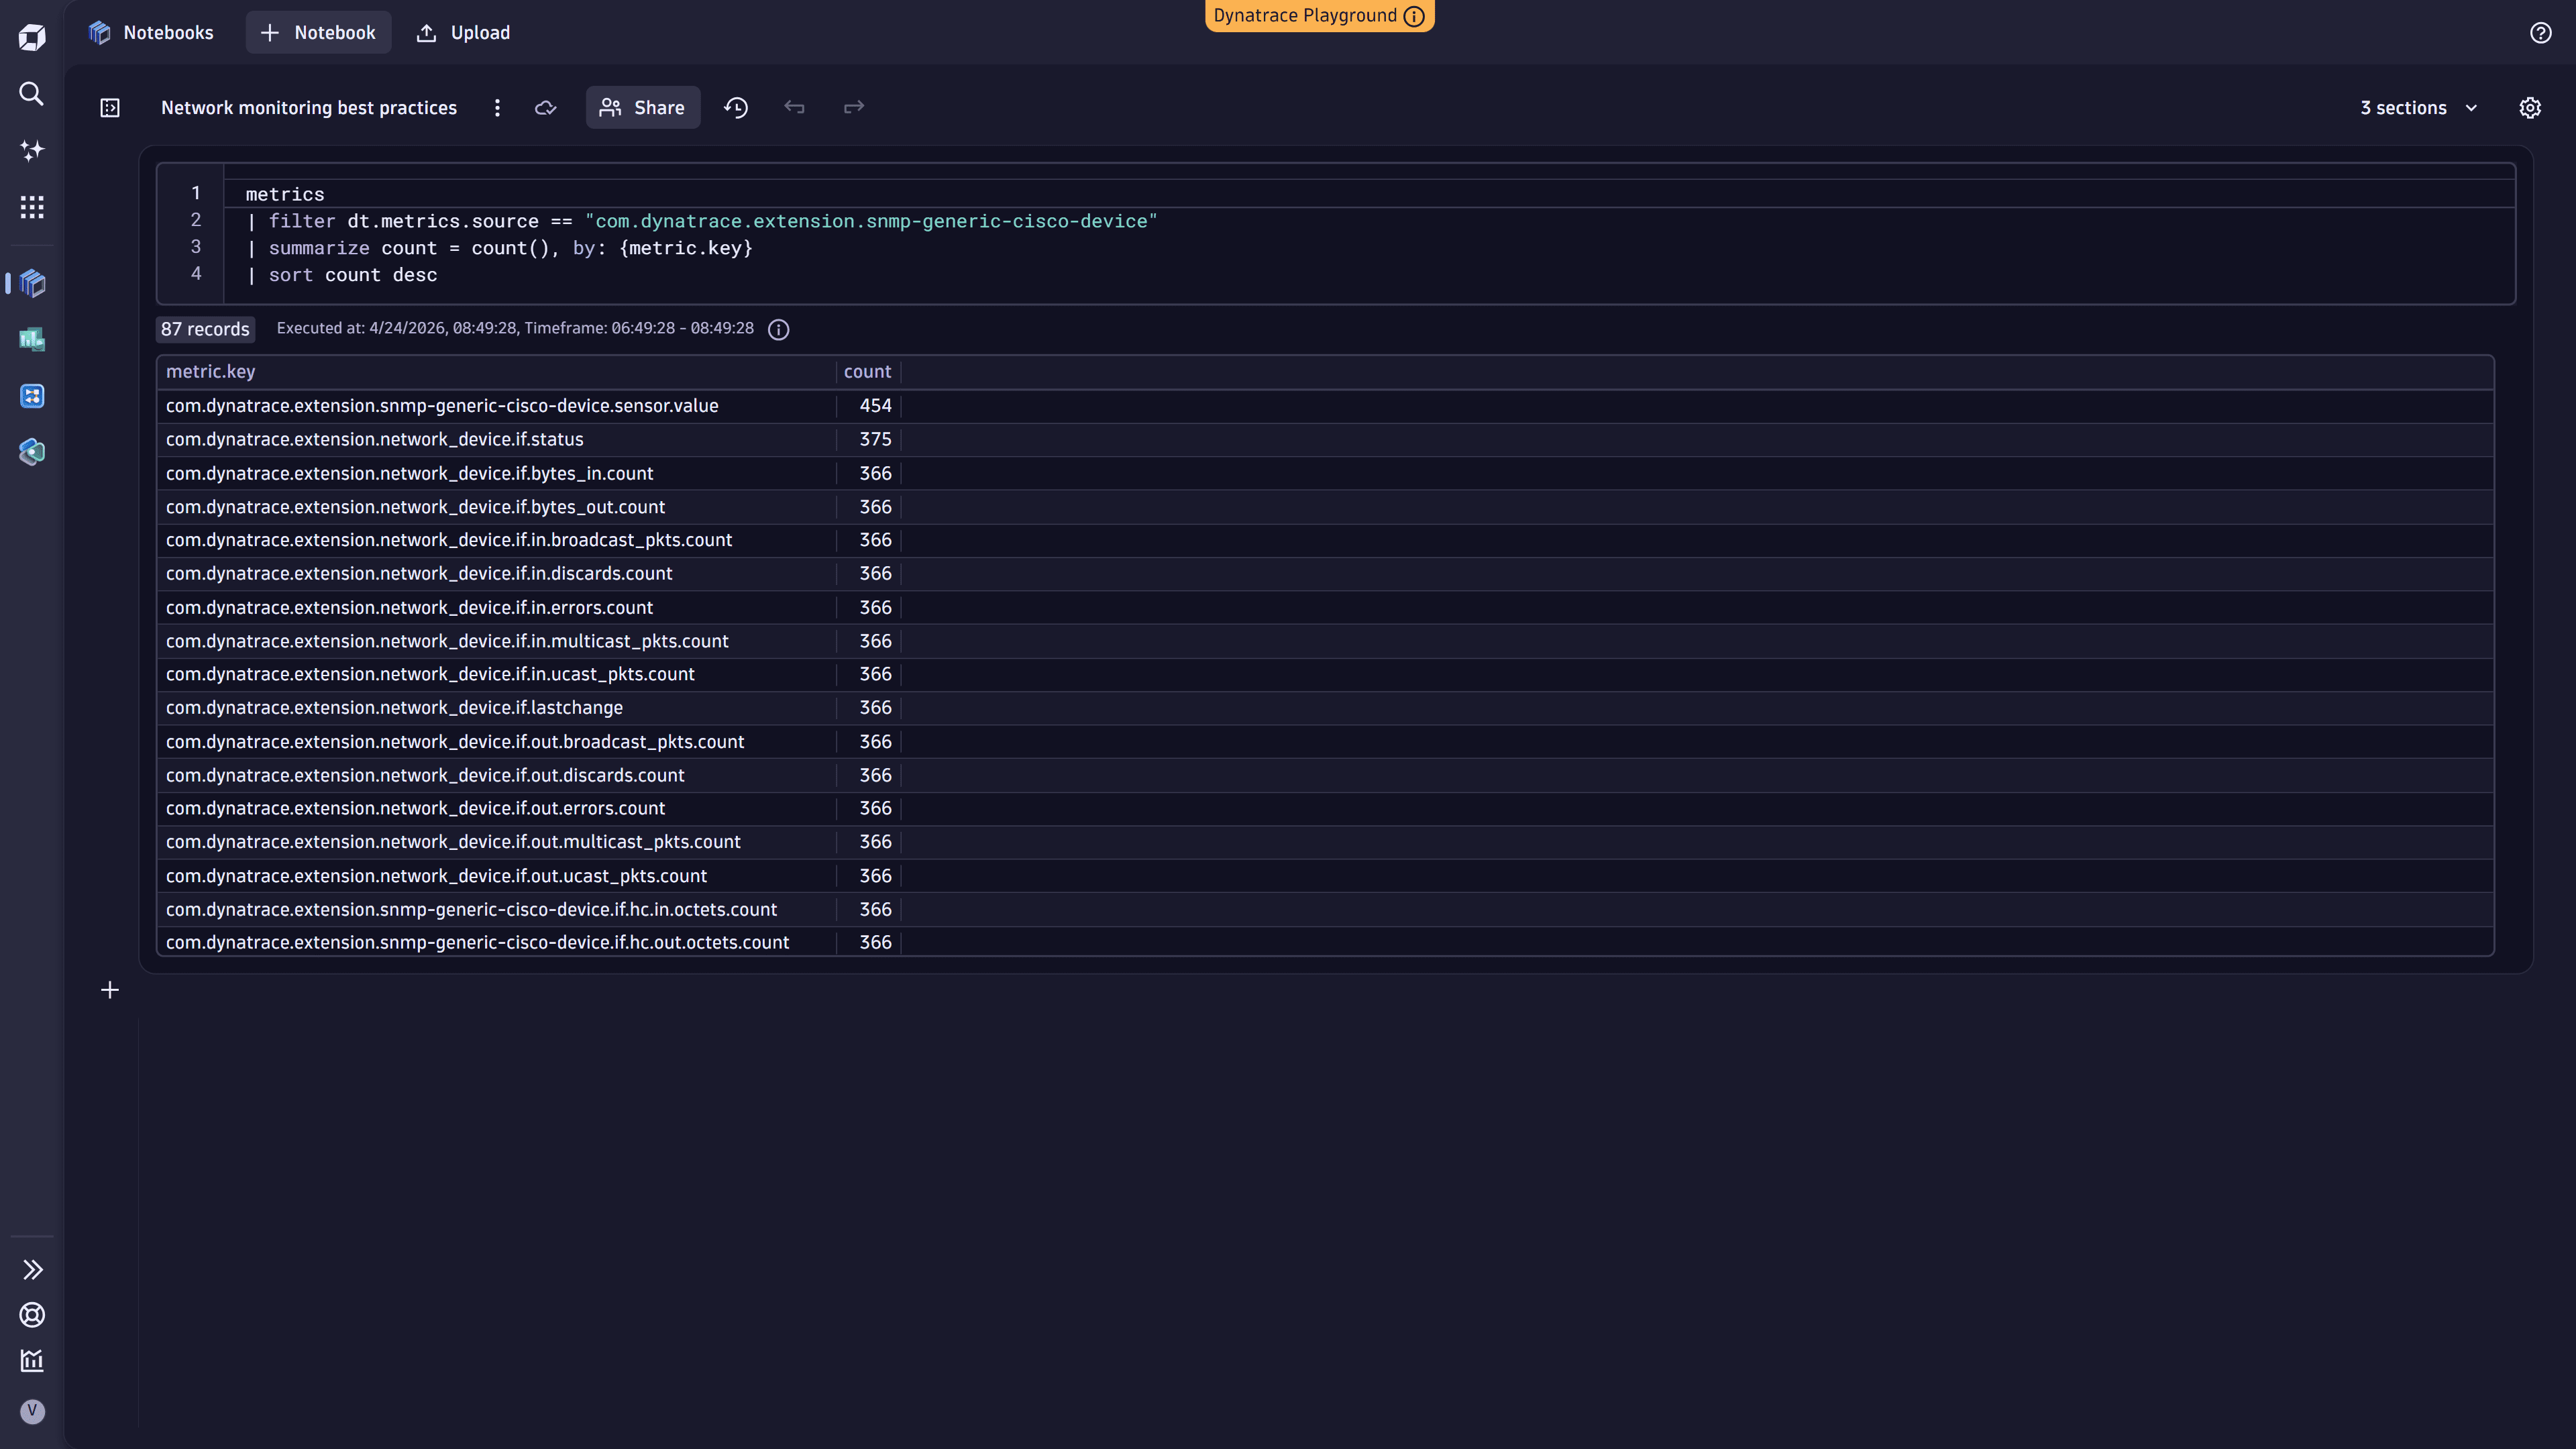
2. Drill down into metric keys
Once you identify high-cardinality sources, filter by those attributes and examine individual metric keys to see which specific metrics contribute the most to cardinality.
metrics| filter dt.metrics.source == "metric_source_name"| summarize count = count(), by: {metric.key}| sort count desc
The following example shows the query executed in Notebooks:
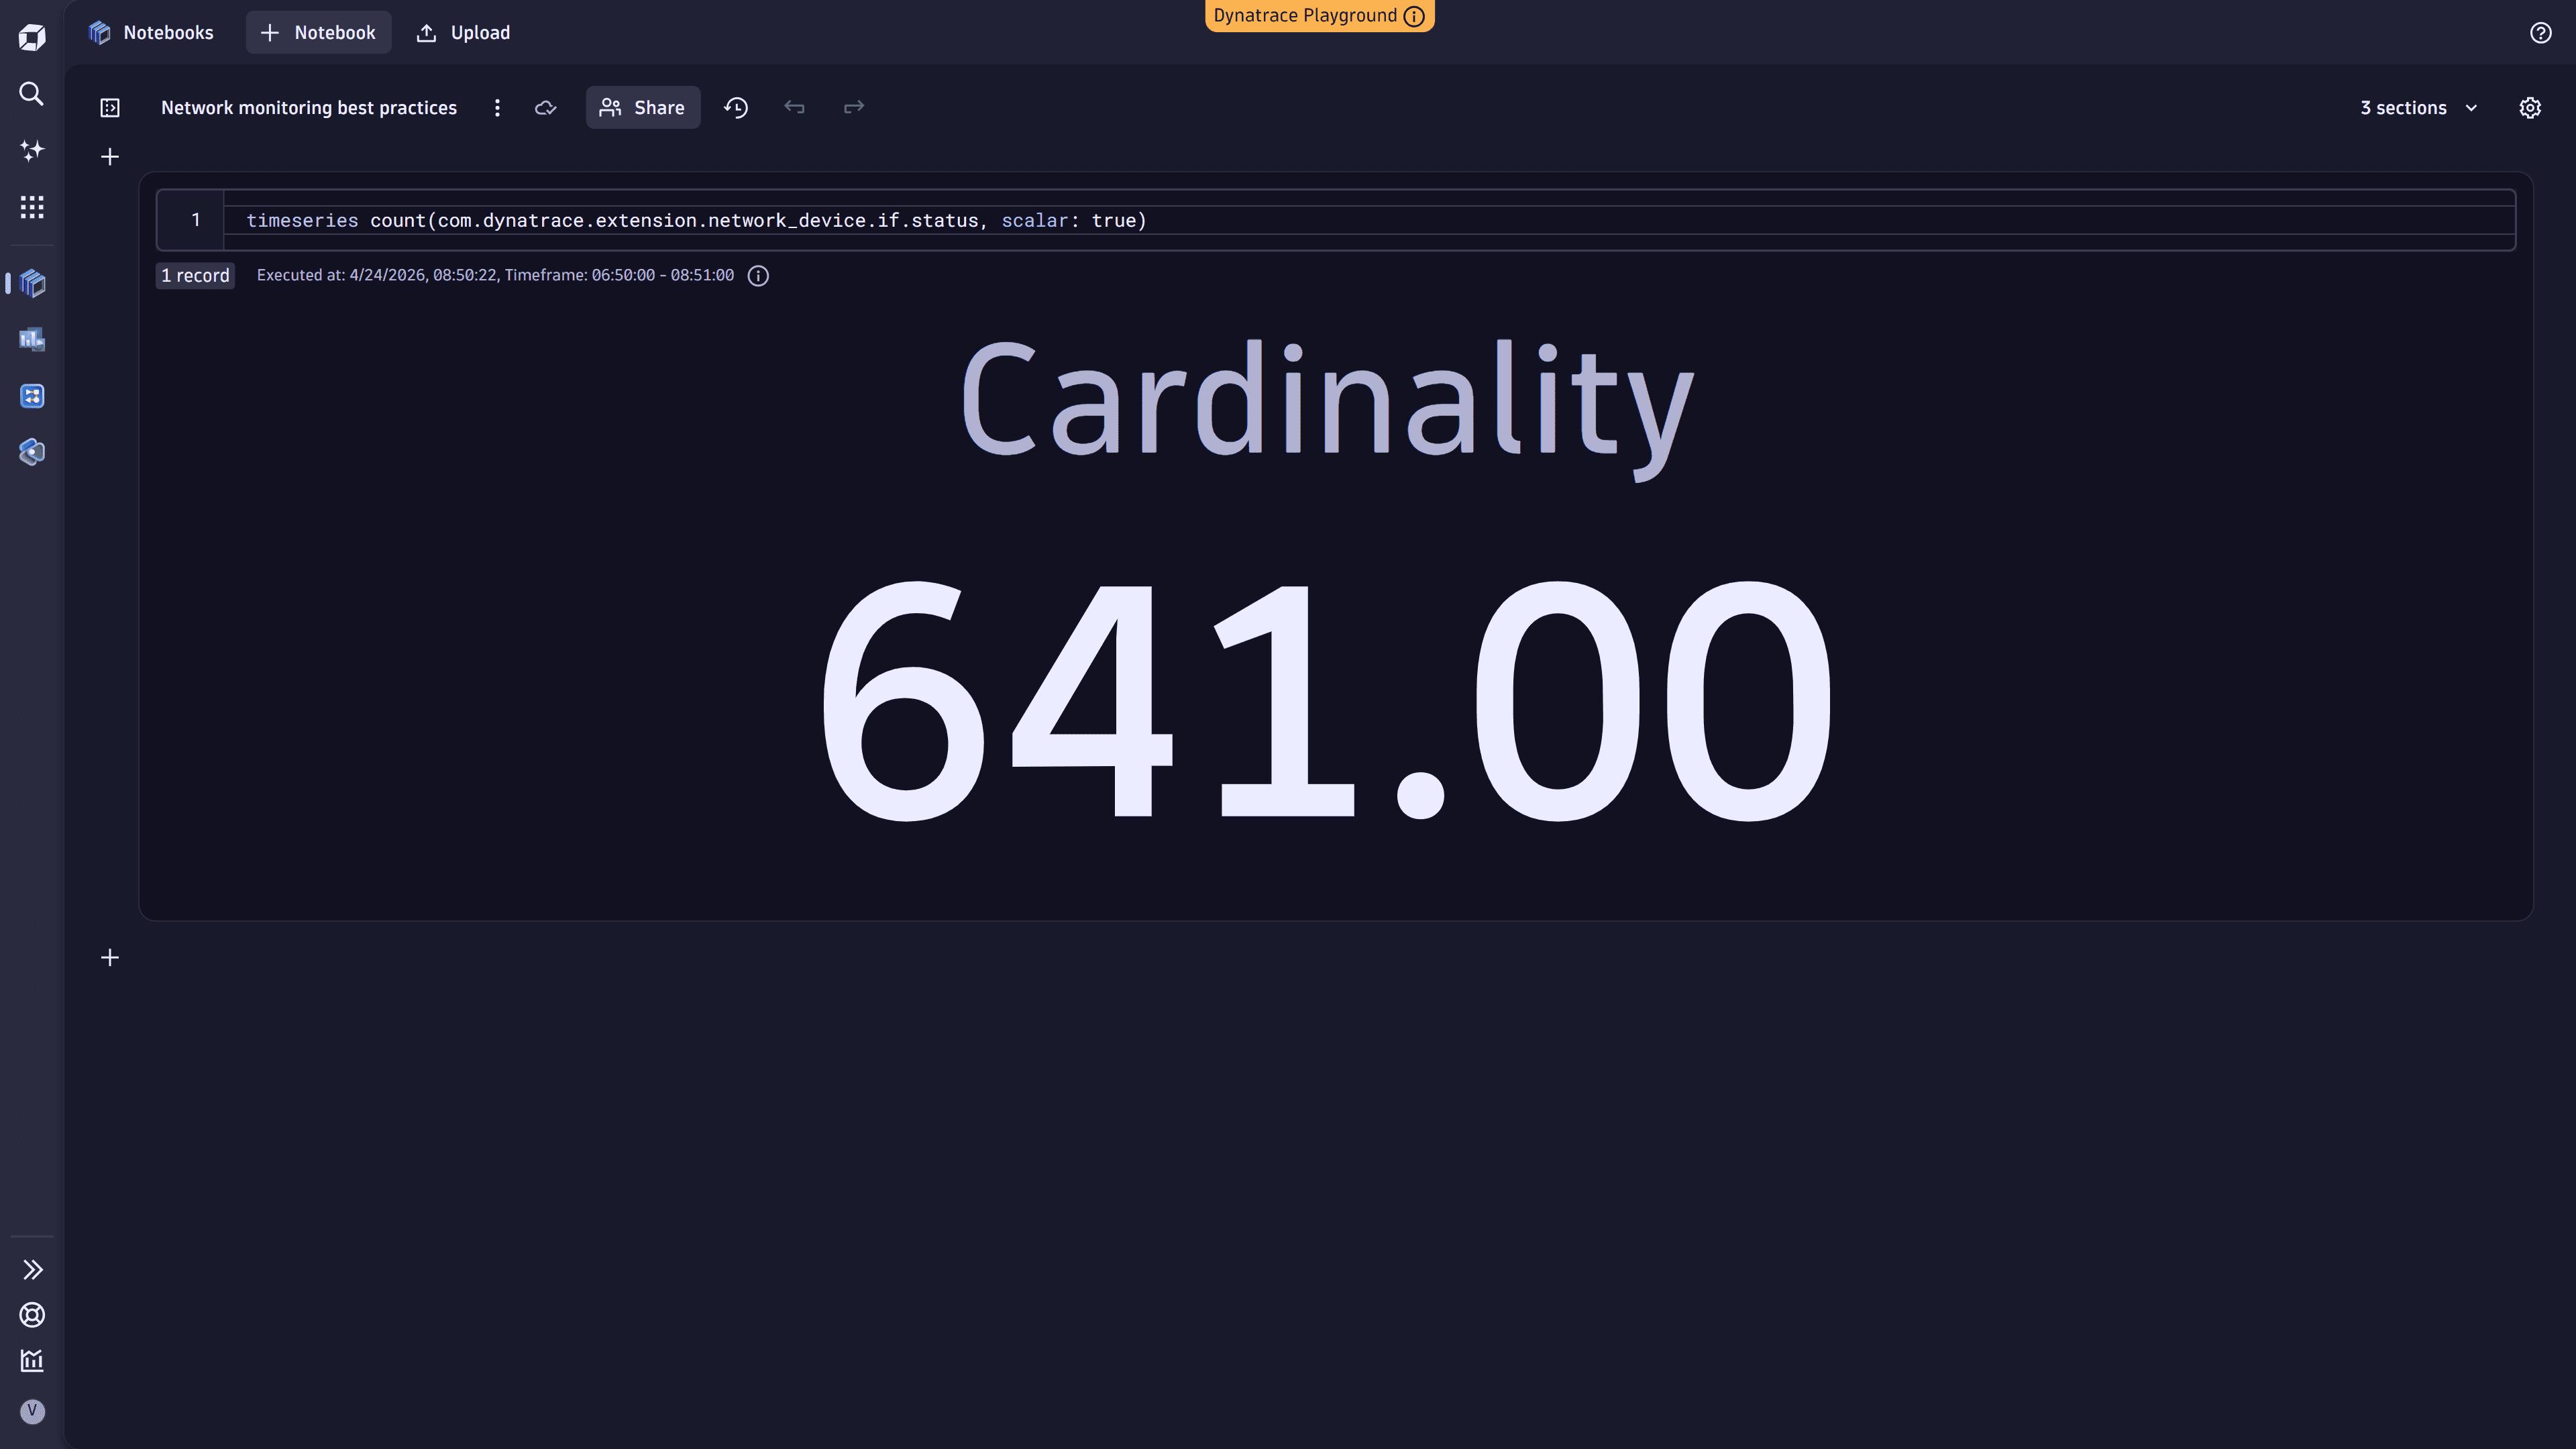
3. Analyze a specific metric key
Use the timeseries command to get the cardinality for a specific metric key.
timeseries count(metric.key, scalar: true)
For more details, see DQL timeseries examples.
The following example shows the query executed in Notebooks:
Optimize cost
Reduce your network monitoring cost by decreasing the number of ingested metric data points.
Optimization can be applied at two levels:
- At the source: in Extensions, adjust monitoring configurations to remove unnecessary feature sets or reduce monitored interfaces.
- In Dynatrace: using OpenPipeline, selectively drop metrics when feature set granularity is insufficient.
The following best practice explains how to optimize at the source.
For OpenPipeline optimization, see Best practices for optimizing metrics cost.
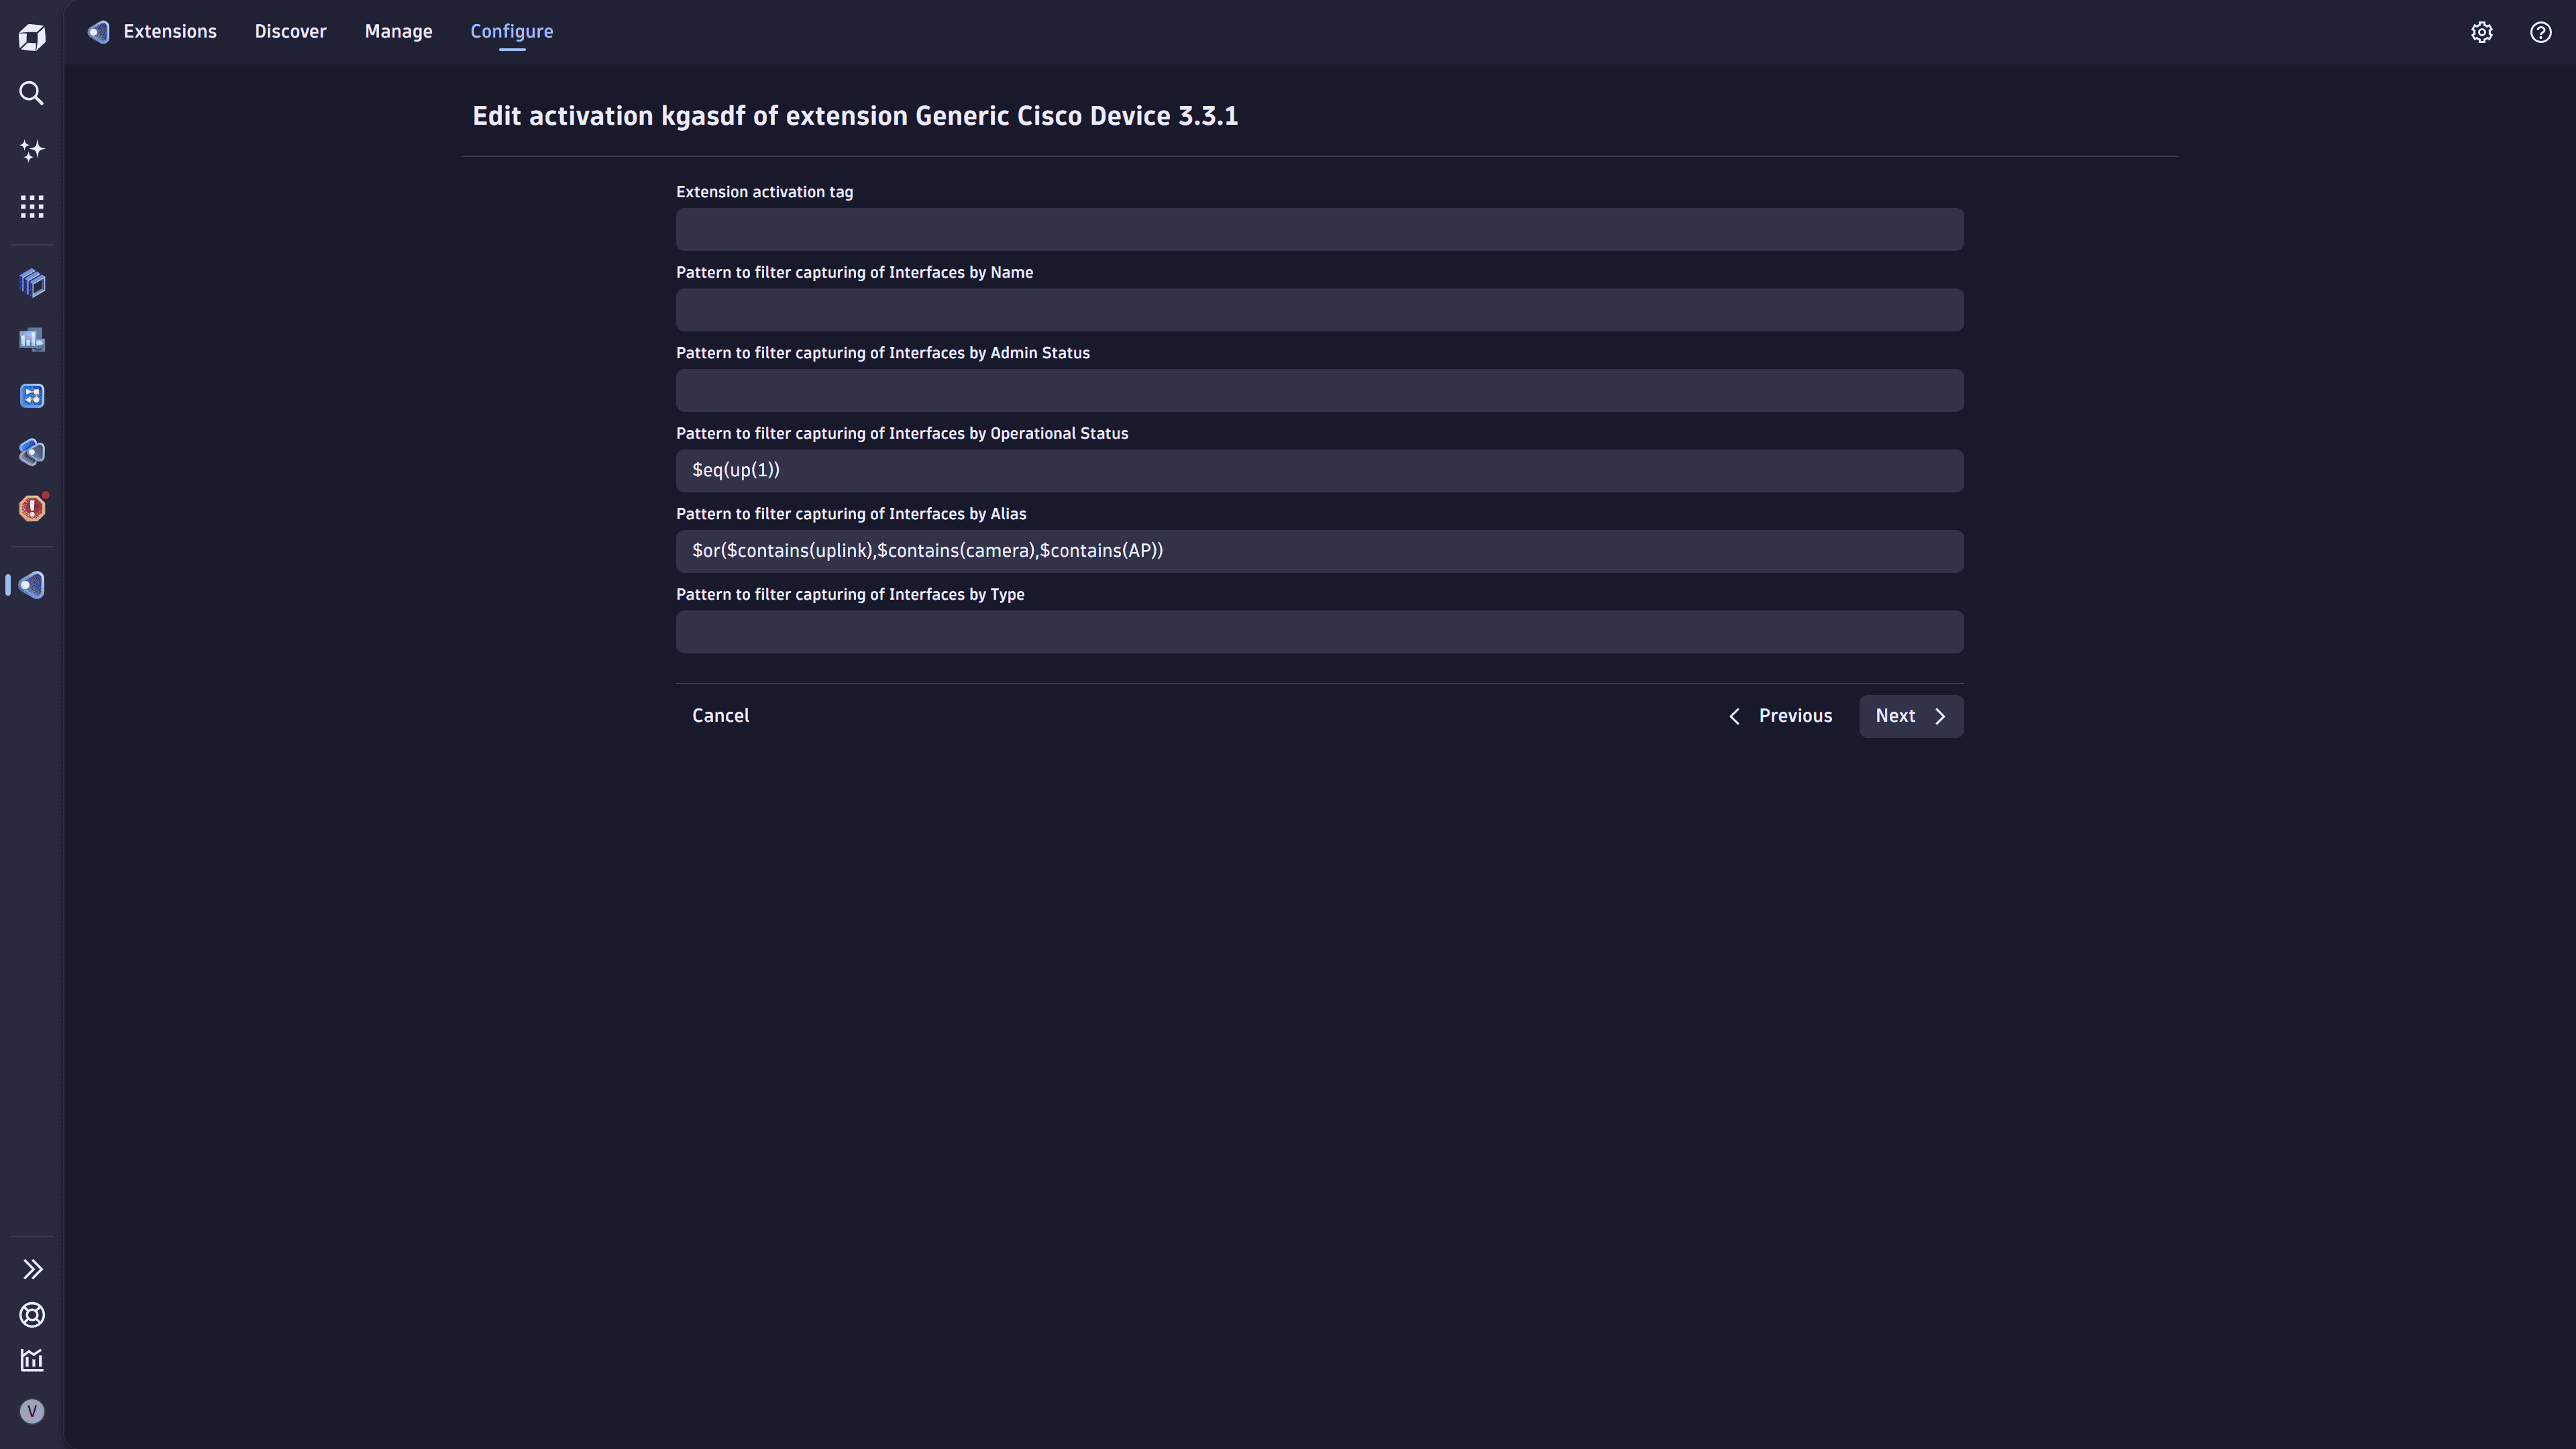
Drop metrics and reduce metric cardinality
Select interfaces based on your use cases. For most enterprise switches or remote office routers, this means uplink interfaces and, optionally, critical interfaces such as video conferencing or wireless access points. Less important interfaces can be monitored through Syslog for availability only.
- Go to Extensions.
- Select the extension and go to Monitoring configurations.
- Choose a monitoring configuration and select > Edit.
- Drop metrics: Disable feature sets you don't need.
- Reduce cardinality: Add an interface alias filter to collect a targeted set of interfaces (for example, uplinks and critical WAN links). By default, a removable filter collects interfaces only if they are administratively up.
- Select Save to save the configuration.
Manage cost
Continuously validate network metrics
Continuously validate cardinality and ingest intervals as part of your CI/CD processes. Changes in instrumentation or configuration can unintentionally introduce excessive cardinality, overly frequent metric collection, or shifts in data behavior, all of which increase ingestion costs.
Use Dynatrace to automate these checks. Validate DQL queries through a Site Reliability Guardian (SRG) integrated into configuration workflows to detect data anomalies early. SRG evaluations can alert you when new code or configuration changes modify cardinality, scraping intervals, or other telemetry profile aspects.
Continuous validation lets teams correct instrumentation or adjust their network monitoring configuration before changes reach production.
Ensure costs are allocated
Allocate network monitoring costs to specific cost centers or products. Go to monitoring configurations and add cost allocation attributes (dt.cost.costcenter or dt.cost.product) as metadata.
For details, see Set up Cost Allocation.
Validate the business value of feature sets
To minimize data point volume and reduce cost, keep only feature sets that support defined use cases.