Optimize workload resource usage with Kubernetes app and Notebooks
- Latest Dynatrace
- Tutorial
- 7-min read
Maximize your cluster resources and reduce costs by identifying and optimizing underutilized workloads. Leverage ") Kubernetes alongside advanced queries in
Kubernetes alongside advanced queries in  Notebooks, powered by data from Grail, for precise resource allocation suggestions.
This guide is tailored for Ops, DevOps, and DevSecOps professionals managing Kubernetes clusters. A basic understanding of Kubernetes concepts such as resource requests/limits, pods, and nodes is assumed, though expertise in Dynatrace or cluster management is not required.
Scenario
- Difficulty in scheduling workloads due to resource availability errors.
- Reports indicate high resource usage based on requests, yet actual node usage for CPU and memory remains low.
Prerequisites
- Access to a Kubernetes cluster.
- New Kubernetes experience configured.
Identify and optimize resources
Strategies applicable for optimizing a specific resource type, such as CPU, can similarly be adapted for others, like memory.
1. Identify clusters for optimization
Select one or more clusters for detailed analysis, focusing on those with the highest levels of unused CPU resources. This can be accomplished by organizing clusters based on their CPU slack.
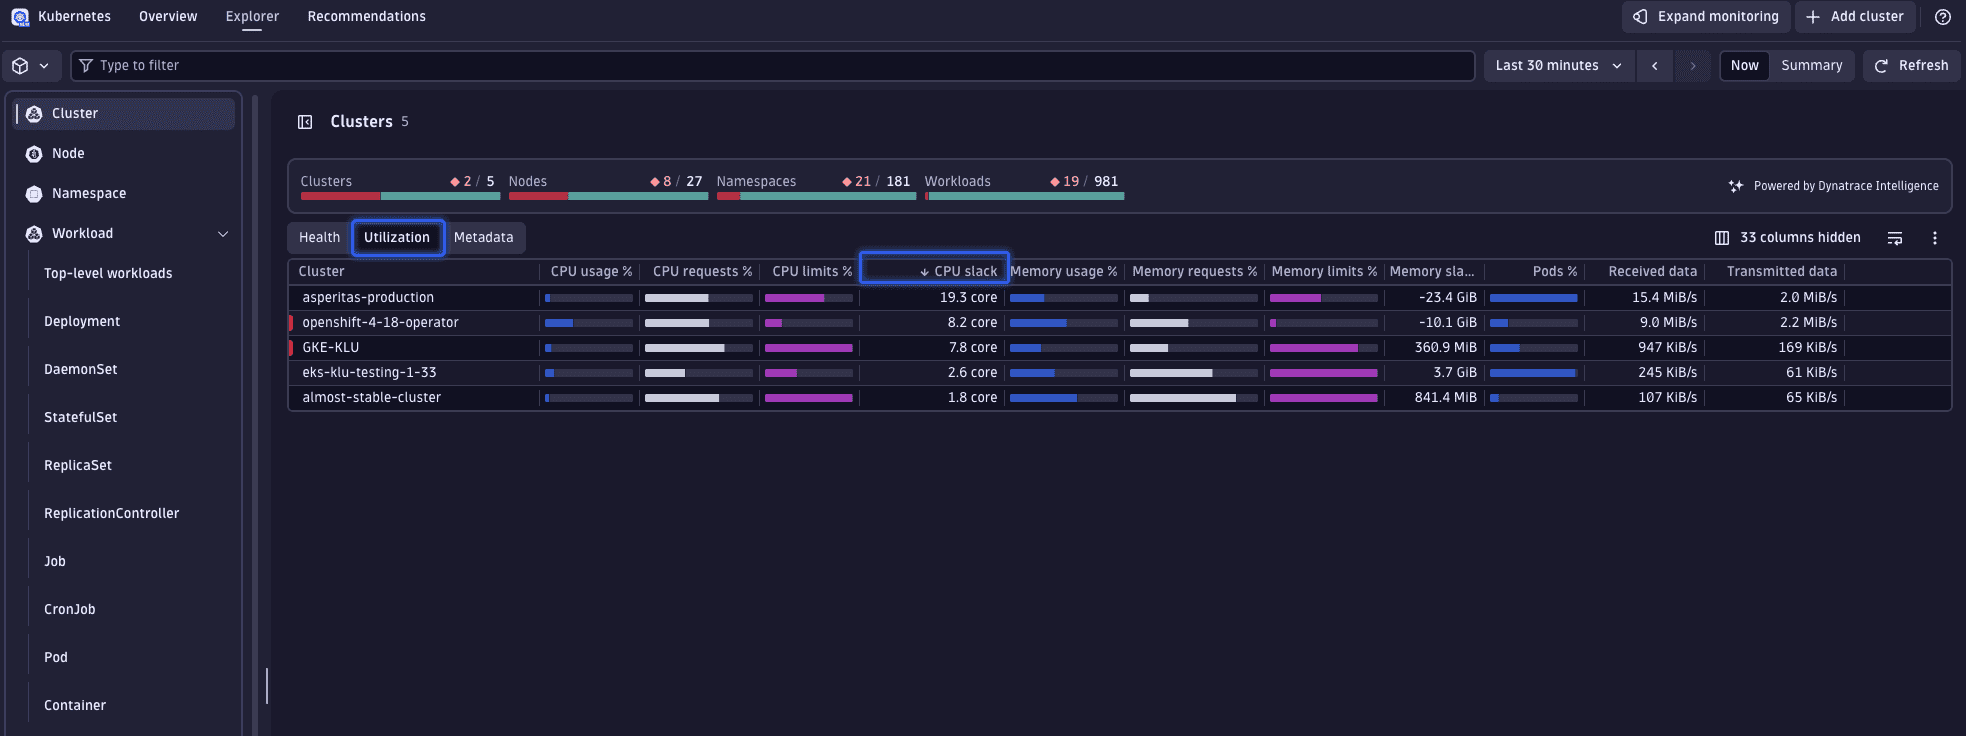
Slack refers to the difference between the resources requested (CPU or memory) and those actually utilized:
- Positive slack indicates underutilization, where less is used than requested.
- Negative slack suggests overutilization, where usage exceeds requests.
Ideally, slack should be minimized while maintaining a buffer for fluctuations. Such approaches are discussed in step 3.
2. Analyze cluster workloads
Examine the specific workloads within the chosen cluster. Navigate to the workload overview via the cluster's page to observe the CPU slack visually.
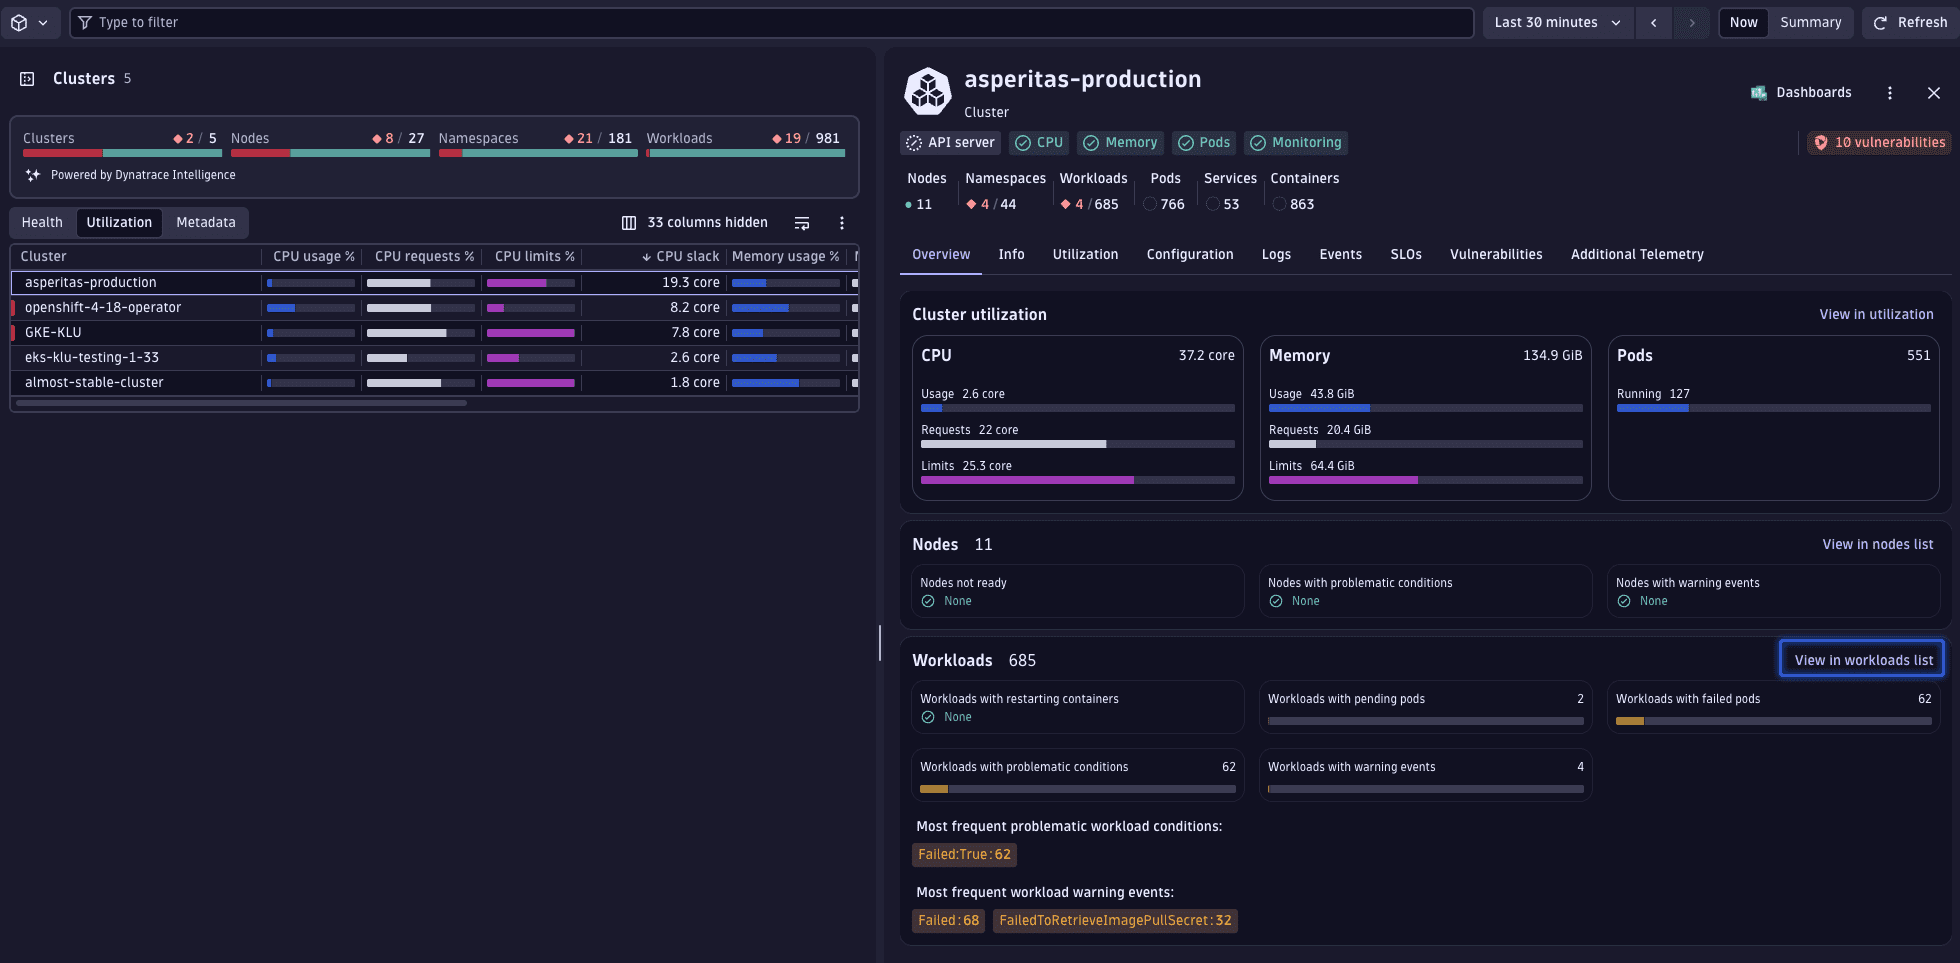
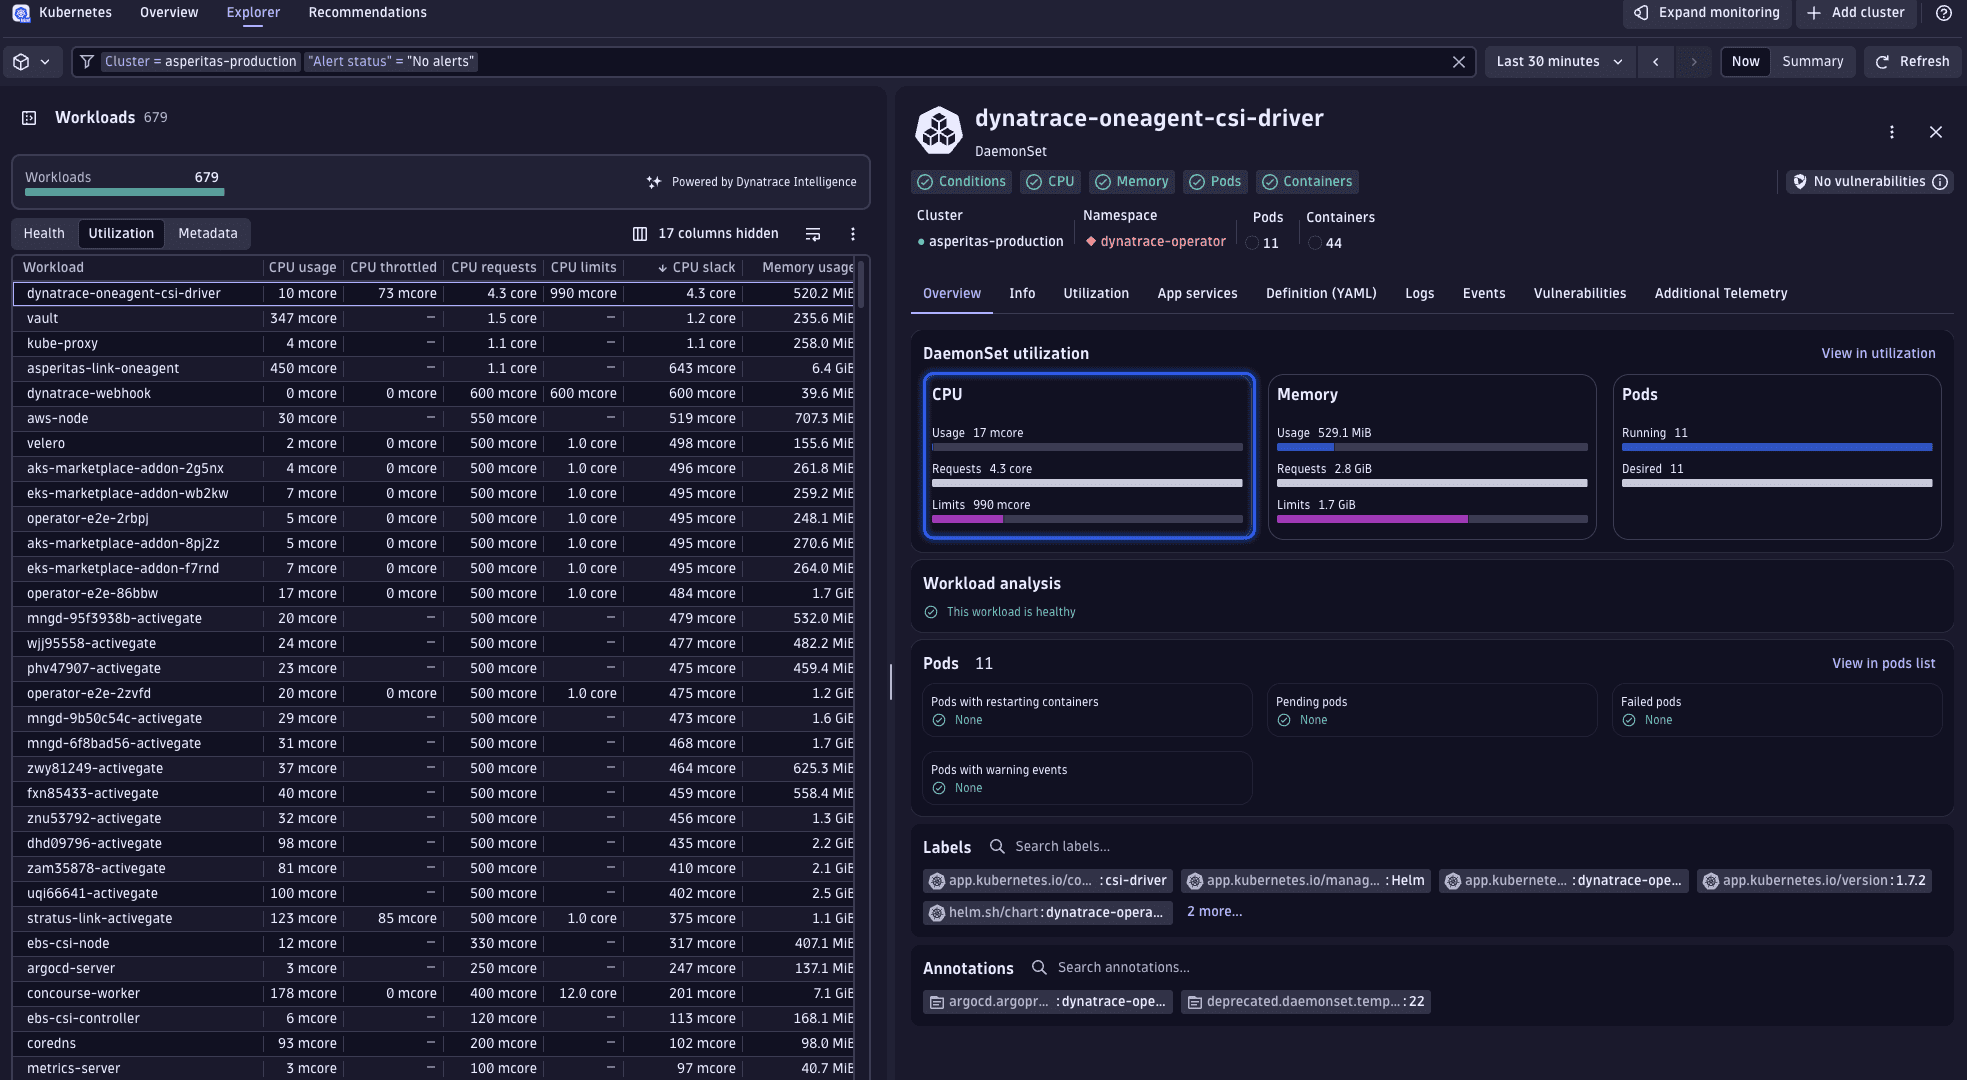
Selecting View in workloads list applies a filter for the selected cluster, transitioning the display to an aggregated view of all workloads.
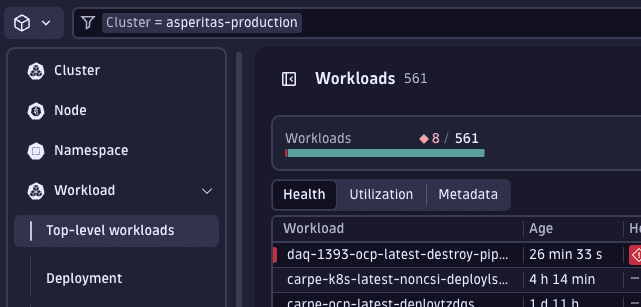
Prior to diving into our workload analysis, it's beneficial to apply another filter to ensure we're only examining healthy workloads. Given that slack is determined by current resource usage, metrics from workloads that are restarting or in an unhealthy or pending state may not accurately reflect typical usage patterns. To focus our analysis on reliable data, we'll add a filter to display only healthy workloads.
Add filter and set Alert status to No alerts.
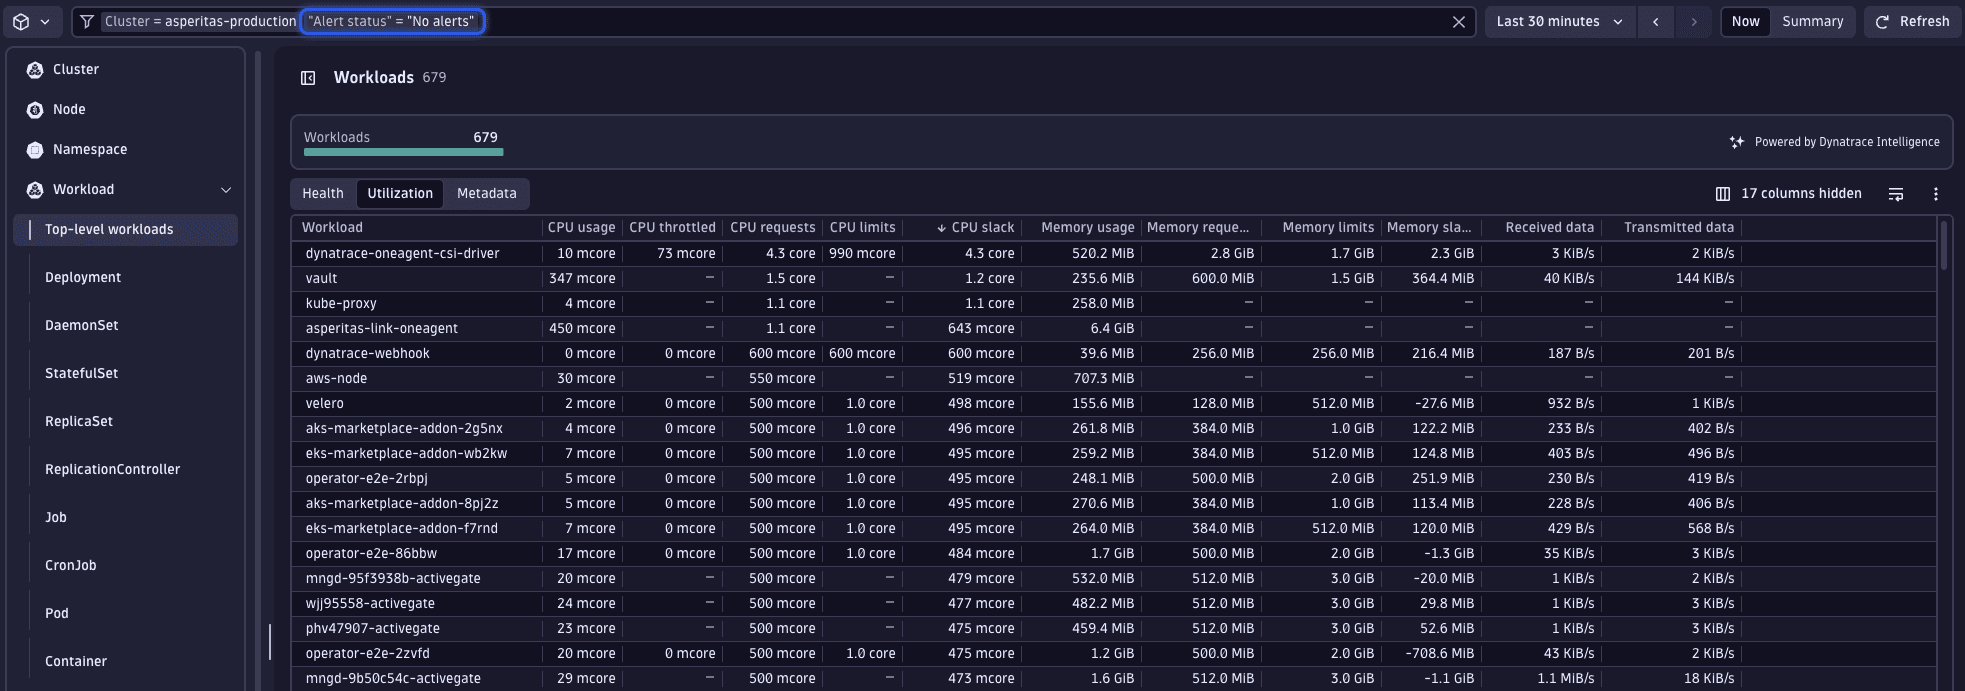
The perspective and sorting preferences established at the cluster level persist, allowing you to quickly identify the workload exhibiting the greatest CPU slack—namely, the dynatrace-oneagent-csi-driver workload.
Upon selecting this workload, it becomes apparent that there's a significant gap between the actual usage and the requested resources. Given that Kubernetes presents only the most recent data, we must verify these usage figures to ensure they accurately represent typical behavior, rather than being anomalies.
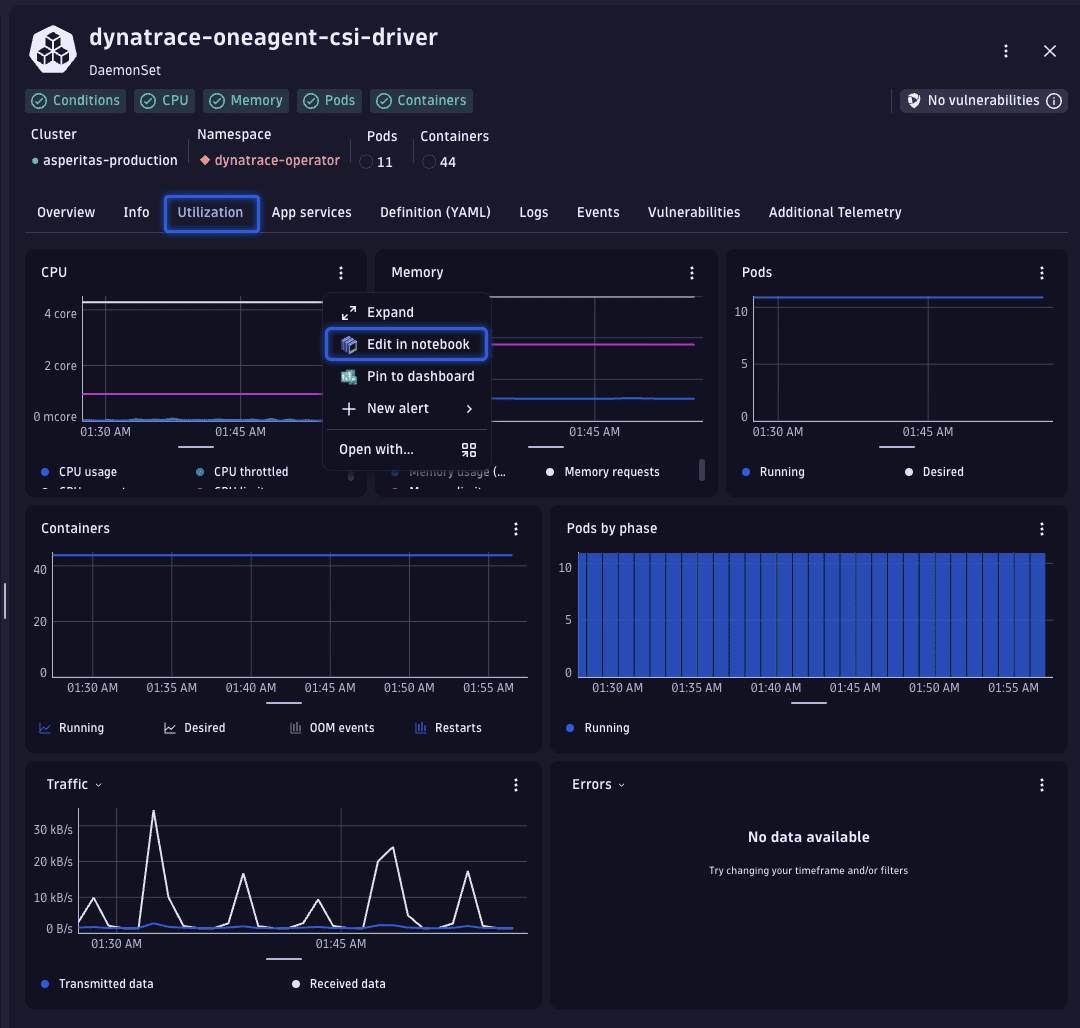
To verify the consistency of these usage patterns, let's examine the historical CPU usage data. This is easily accomplished by transitioning from the Overview tab to the Utilization tab.
From there, we access the detailed data by selecting > Edit in Notebook, which opens the corresponding DQL query in Notebooks.
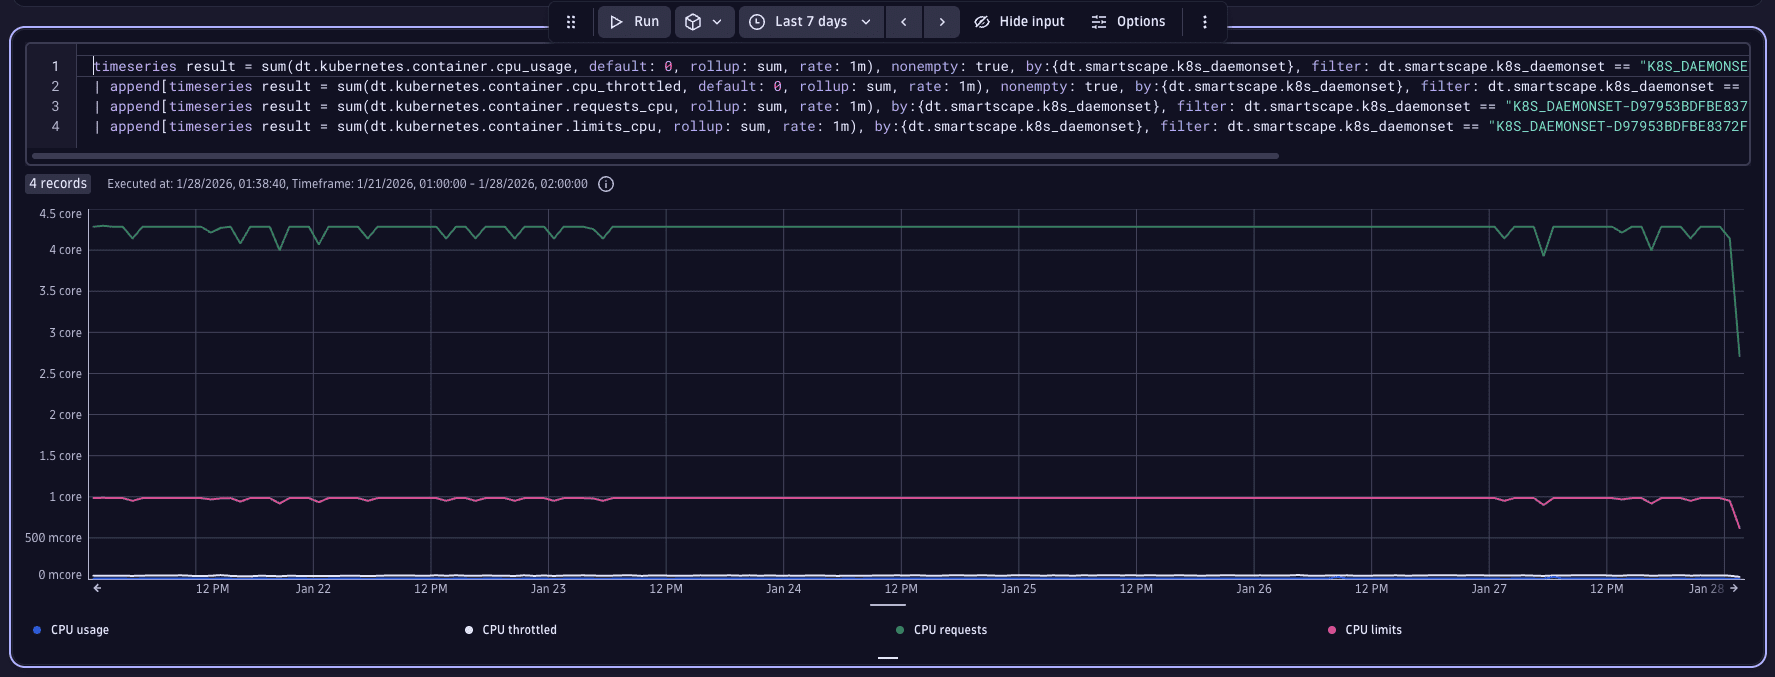
Now, we'll broaden our analysis window to encompass a larger timeframe, while leaving the provided DQL unchanged, to examine the workload's historical data. For this scenario, a seven-day period is selected, given the service's resemblance to a webshop, where usage patterns may vary significantly across the week.
Upon review, we can see that our service's CPU usage is less than 0.5 CPUs (illustrated by the blue line at the bottom of the chart), which is substantially below the 4 CPUs requested (represented by the green line at the top of the chart).
3. Optimize workload resources
You can now fine-tune the workload's resource requests and limits effectively. However, there are critical considerations in this process that might not be immediately apparent:
- Workloads exceeding their resource requests are more prone to eviction under resource contention scenarios.
- Surpassing the CPU limit results in workload throttling, while exceeding the memory limit can cause the workload to be terminated due to out-of-memory (OOM) conditions.
- The requested resources will be reserved on the node. Even if they are not used, they are still not available. This means you can saturate a node quickly without actually consuming much of its resources, preventing the scheduling of further workloads on that node.
A workload might consist of multiple pods which in turn might consist of multiple containers. In this example the workload consists only of a single pod with a single container, so the workload resources are the same as the resources of that container. If there are multiple pods and/or containers you have to calculate how to adjust the respective requests or limits on the container level accordingly.
You can use Dynatrace to drill down to the pod/container level by navigating from the overview page of the workload and clicking on View in pods list under the pods section. On the overview page of a pod there is the respective View in containers list link.
With these factors in mind, it's evident that our current request and limit settings are likely excessive. Observing minor usage spikes, we opt to reduce the CPU request to 100m, a conservative figure that still ensures stable performance during sudden increases in demand.
For limits, we choose 200m, a threshold unlikely to be breached under normal conditions. While it's possible to set even lower limits, given the minimal risk of service interruption with CPU constraints (unlike with memory), we prioritize a cautious approach, allowing for future adjustments based on ongoing performance monitoring.
Excessively stringent limits may cause CPU throttling, even without surpassing the set thresholds. This is due to the Completely Fair Scheduler (CFS) mechanism used for enforcing limits in Kubernetes, which allocates CPU time in quantums of 100 milliseconds. For instance, a limit of 0.4 (or 400m) implies the process has 40 milliseconds of every 100 milliseconds period to execute, leading to potential wait times if not completed within that window.
Through this optimization, we've reclaimed more than half a CPU core by adjusting a single workload's resources.
4. Address workloads lacking request or limits
Workloads without set resource requests pose a significant challenge in Kubernetes clusters. The allocation of resources through requests is important, as it plays a key role in the scheduling decisions within Kubernetes. When workloads lack specified requests, they can be placed on any node, irrespective of the node's available resources which can strain nodes with limited resources, potentially leading to workload evictions and disruptions.
In reality, however, not all workloads may have these resource requests configured. The good news is that identifying such workloads is straightforward with the use of DQL.
We are using the following query that is based on the table we see in Kubernetes.
// Get all Kubernetes workload typessmartscapeNodes { K8S_DEPLOYMENT, K8S_DEPLOYMENTCONFIG, K8S_DAEMONSET, K8S_STATEFULSET, K8S_REPLICASET, K8S_REPLICATIONCONTROLLER, K8S_JOB, K8S_CRONJOB }// extract and rename workload metadata for clarity| fields id, workload.name = name, k8s.workload.kind, k8s.cluster.name, k8s.namespace.name// filter to specific cluster| filter k8s.cluster.name == "cluster-keaton"// exclude system namespaces| filterOut k8s.namespace.name == "kube-system"// lookup CPU request for the last few minutes| lookup [// sum CPU requests across containers, and group them by workload nametimeseries requests_CPU = sum(dt.kubernetes.container.requests_cpu, scalar:true, rate:1m, rollup:sum),by:{dt.smartscape.k8s_deployment, dt.smartscape.k8s_deploymentconfig, dt.smartscape.k8s_daemonset, dt.smartscape.k8s_statefulset, dt.smartscape.k8s_replicaset, dt.smartscape.k8s_replicationcontroller, dt.smartscape.k8s_job, dt.smartscape.k8s_cronjob},// do NOT use data newer than 2 minutes to ensure stable and complete datatimeframe: timeframe(from: -10m, to: -2m)// use coalesce to find first non-null top-level workload id| fieldsAdd id = coalesce(dt.smartscape.k8s_deployment, dt.smartscape.k8s_deploymentconfig, dt.smartscape.k8s_daemonset, dt.smartscape.k8s_statefulset, dt.smartscape.k8s_replicaset, dt.smartscape.k8s_replicationcontroller, dt.smartscape.k8s_job, dt.smartscape.k8s_cronjob)], sourceField:id, lookupField:id, fields:{requests_CPU}, executionOrder:leftFirst// same logic for memory requests| lookup [timeseries requests_memory = sum(dt.kubernetes.container.requests_memory, scalar:true, rate:1m, rollup:sum),by:{dt.smartscape.k8s_deployment, dt.smartscape.k8s_deploymentconfig, dt.smartscape.k8s_daemonset, dt.smartscape.k8s_statefulset, dt.smartscape.k8s_replicaset, dt.smartscape.k8s_replicationcontroller, dt.smartscape.k8s_job, dt.smartscape.k8s_cronjob},timeframe: timeframe(from: -10m, to: -2m)| fieldsAdd id = coalesce(dt.smartscape.k8s_deployment, dt.smartscape.k8s_deploymentconfig, dt.smartscape.k8s_daemonset, dt.smartscape.k8s_statefulset, dt.smartscape.k8s_replicaset, dt.smartscape.k8s_replicationcontroller, dt.smartscape.k8s_job, dt.smartscape.k8s_cronjob)], sourceField:id, lookupField:id, fields:{requests_memory}, executionOrder:leftFirst// find workloads missing CPU or memory requests.| filter isNull(requests_CPU) or isNull(requests_memory)
This query generates a list of all workloads lacking either CPU or memory requests. It specifically targets our cluster and excludes any entities from the kube-system namespace, acknowledging that certain workloads must be scheduled regardless of a node's resource availability.
Related topics
Kubernetes