Manage on-premises network infrastructure
- Latest Dynatrace
- Tutorial
- 7-min read
- Published Dec 09, 2024
On-premises networks consist of many components, including physical devices in the path of the application traffic. Network devices provide connectivity and often interact up to the application layer. We take the on-premises network layer for granted until reality reminds us of its existence. For example:
-
An application breaks because a router runs out of memory, drops packets, and causes application services to lose connections.
-
A high-speed telecommunication link is a victim of gray failure along its path.
In such cases, understanding what's going on in network devices and the links between them becomes crucial to conducting default analysis at various layers of the OSI stack.
Adopting these best practices can streamline device and link monitoring, significantly increasing on-premises network availability and Mean Time To Repair (MTTR). This tutorial is simple yet impactful in consolidating all infrastructure observability data into one platform and gaining operational benefits.
Who this is for
This tutorial is designed for NetOps professionals who oversee on-premises network infrastructure and manage its associated availability. It is intended to provide valuable insights and actionable strategies for efficient resource management.
What you will learn
In this tutorial, you'll learn how to:
- Set up physical network device monitoring based on data ingested through the remote Extension Framework for Cisco devices.
- Use the power of Dynatrace Query Language to combine networking data in a way that provides answers to everyday network operations situations.
- Build a sample devices list with health indicators reflecting traffic and control plane. Based on specific needs, you can modify or easily replace the selected indicators.
Target audience
Following this tutorial requires:
- A fundamental understanding of physical network device concepts and familiarity with router troubleshooting.
- Basic experience with the Dynatrace Extension Framework for network devices.
Before you begin
You need to set up a Generic Cisco Device remote extension. Select the following feature sets:
- Default
- Interface 64-bit
- Interfaces
Steps
1. List device problems and investigate a “low memory” condition
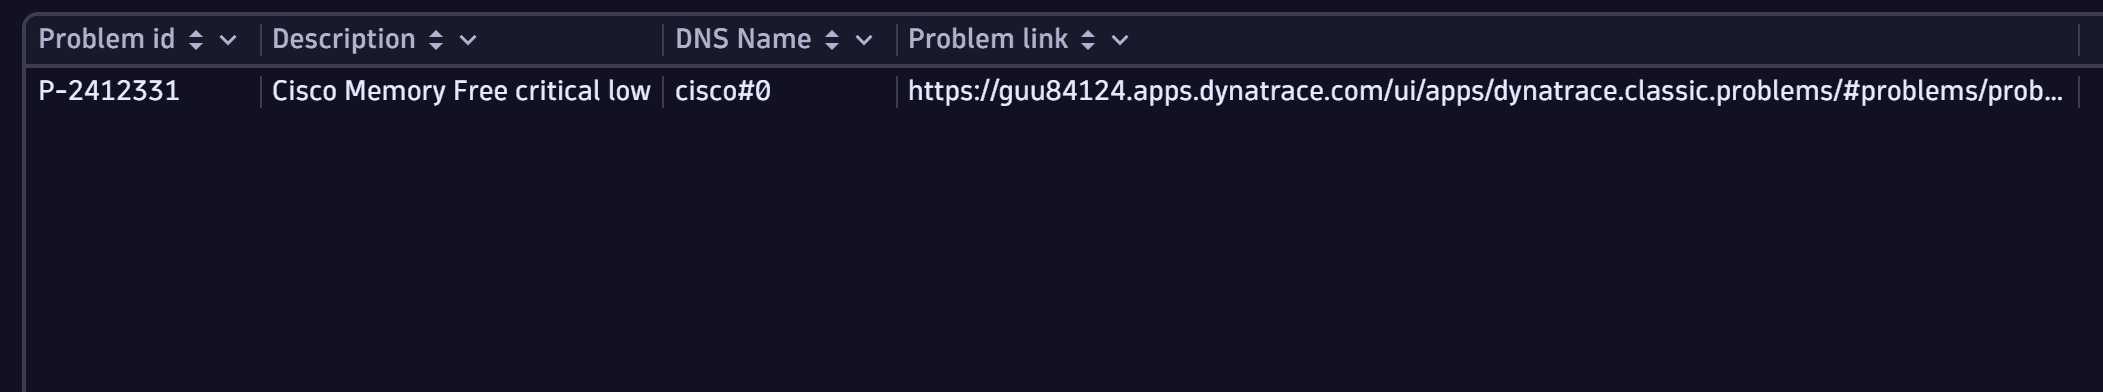
Start by looking at the problems that may presently affect the Cisco devices and report:
- Device DNS name
- Problem id
- Problem description
- Link to the Dynatrace full problem details
fetch `dt.entity.snmp:com_dynatrace_extension_snmp_generic_cisco_device`| lookup sourceField: id, lookupField:affected_entity_id, fields: {affected_entity_id, display_id, status,event_name, event_id},[fetch events| filter event.kind == "DAVIS_PROBLEM"| sort timestamp desc| fieldsAdd affected_entity_id = affected_entity_ids[0], status,event.id, display_id, event.name| summarize {status = takeFirst(event.status), id = takeFirst(display_id),event_name = takeFirst(event.name), event_id = takeFirst(event.id), duplicate = takeFirst(dt.davis.is_duplicate)},by:{affected_entity_id,display_id}| filter duplicate == false and status == "ACTIVE"]| filter isnotNull(status)|fields `Problem id` = display_id, Description=event_name, `DNS Name`= system_name,`Problem link` = concat("https://wkf10640.apps.dynatrace.com/ui/apps/dynatrace.classic.problems/#problems/problemdetails;gtf=-2h;gf=all;pid=", event_id)
Sample query result:
2. Investigate memory consumption over time
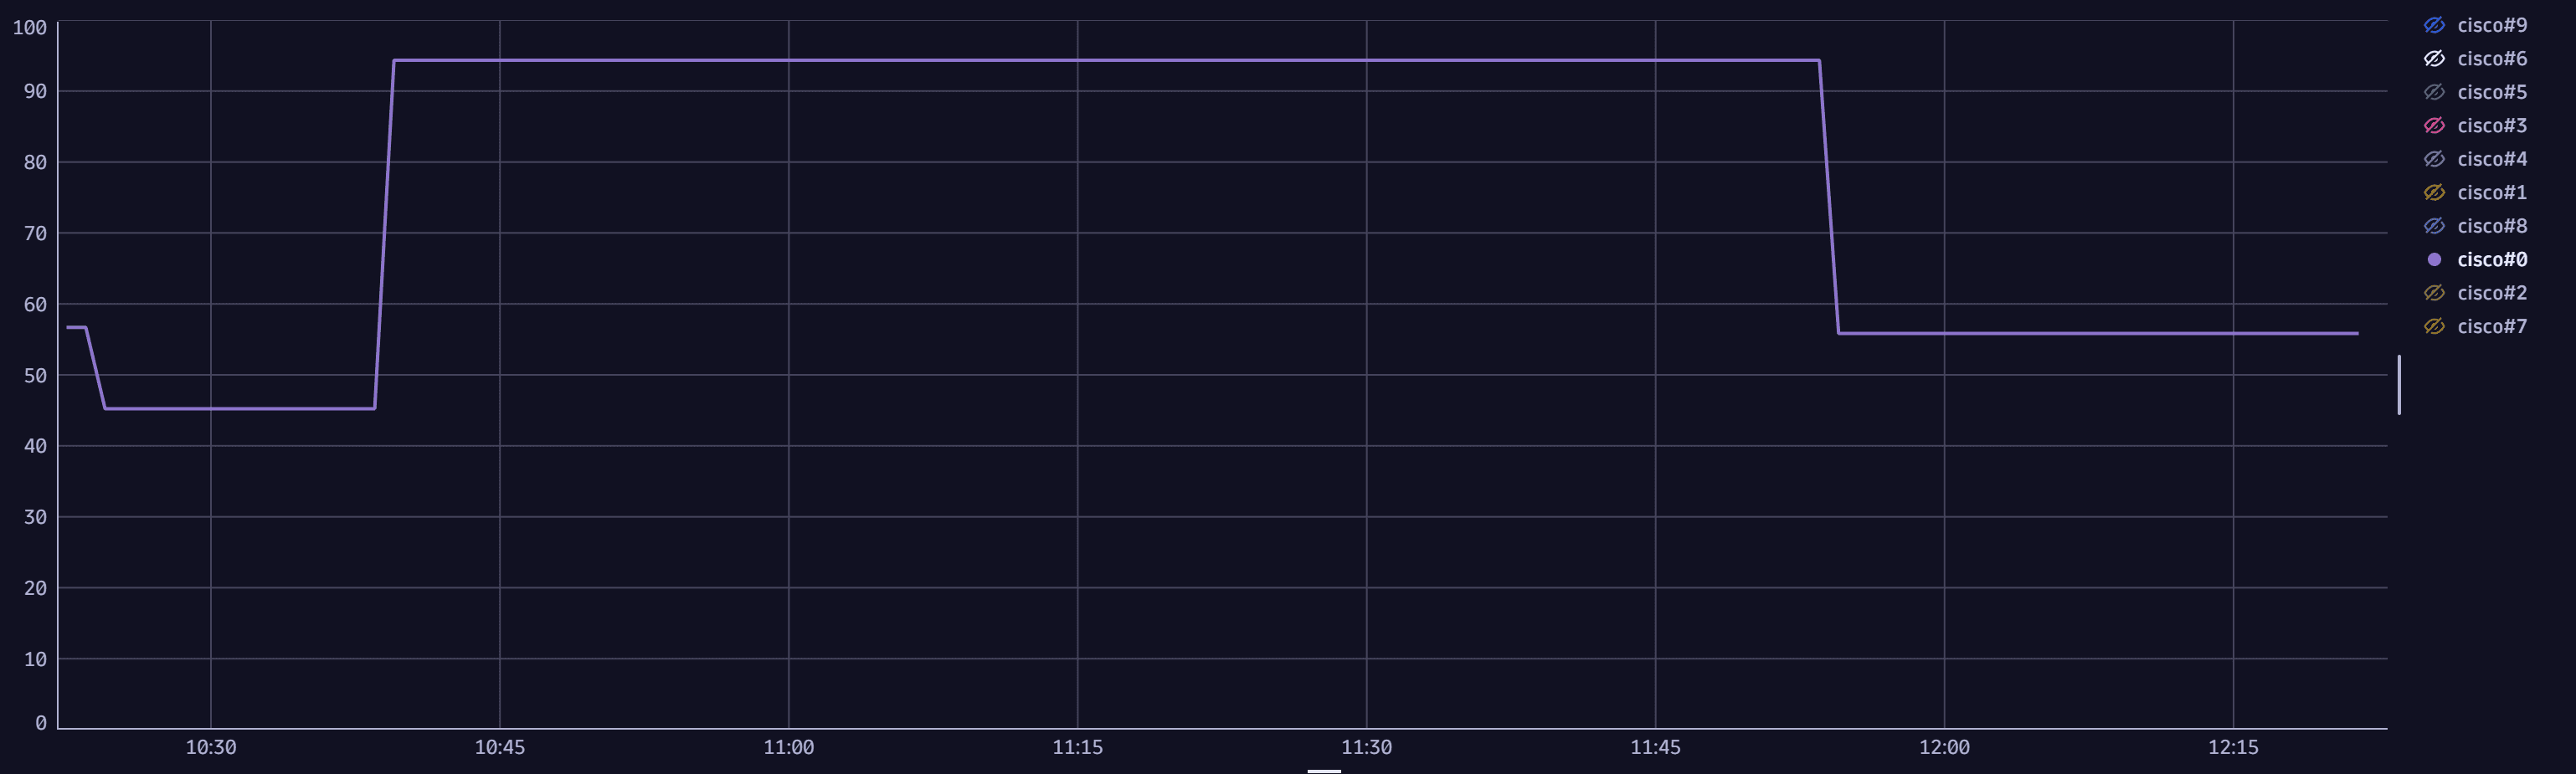
The currently open Dynatrace problem suggests that a Cisco device's free memory is critically low. As each metric has historical data, you can extract a timeseries and graph the average memory usage over time. To detect high-frequency events, you can choose a one-minute interval over the last hours. The user interface can single out the device with problematic memory usage.
timeseries {t_free=avg(`com.dynatrace.extension.snmp-generic-cisco-device.cpm.cpu.memory.hc.free`),t_used=avg(`com.dynatrace.extension.snmp-generic-cisco-device.cpm.cpu.memory.hc.used`)},by: {`dt.entity.snmp:com_dynatrace_extension_snmp_generic_cisco_device`}, interval:1m // Interval set to 1 minute to match the metric collection interval| lookup [fetch `dt.entity.snmp:com_dynatrace_extension_snmp_generic_cisco_device` | fields id, system_name ],sourceField:`dt.entity.snmp:com_dynatrace_extension_snmp_generic_cisco_device`,lookupField:id,fields:{system_name} // getting the device name| fieldsAdd `Used Memory` = 100*(t_used[]/(t_free[]+ t_used[])) // calculating the memory usage rate| fieldsRemove `dt.entity.snmp:com_dynatrace_extension_snmp_generic_cisco_device`,t_free, t_used| fieldsRename `DNS name`=system_name
Sample query result:
3. Investigate CPU consumption over time
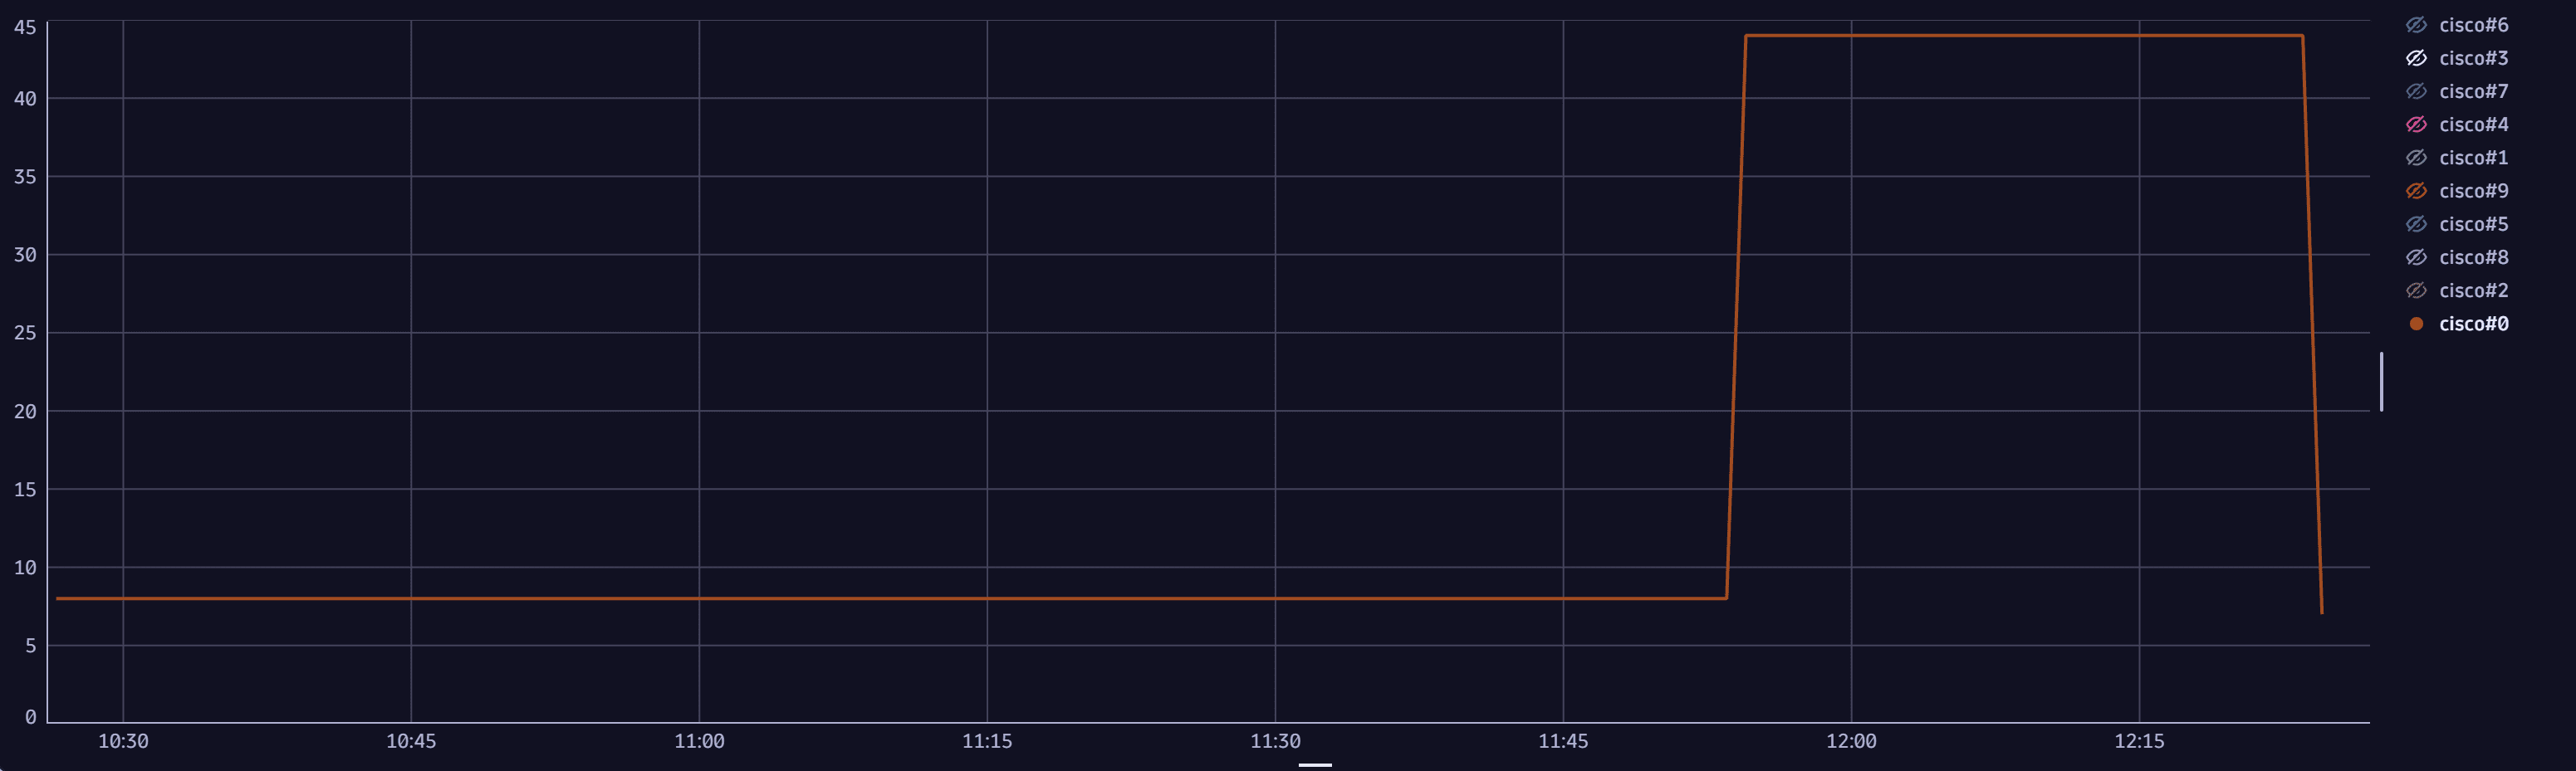
Memory consumption and CPU consumption may be correlated or independent, leading to conducting investigations using different resolution paths. You can extract a timeseries and graph the average CPU consumption over time.
timeseries t_cpu=avg(`com.dynatrace.extension.snmp-generic-cisco-device.cpm.cpu.loadavg.5min`),by: {`dt.entity.snmp:com_dynatrace_extension_snmp_generic_cisco_device`}, interval:5m // Interval set to 5 minutes to match the metric collection interval| lookup [fetch `dt.entity.snmp:com_dynatrace_extension_snmp_generic_cisco_device` | fields id, system_name ],sourceField:`dt.entity.snmp:com_dynatrace_extension_snmp_generic_cisco_device`,lookupField:id,fields:{system_name} // getting the device name| fieldsRemove `dt.entity.snmp:com_dynatrace_extension_snmp_generic_cisco_device`| fieldsRename `DNS name`=system_name, `CPU utilization` = t_cpu| sort arrayLast(`CPU utilization`) desc // sort by the most recent CPU usage
Sample query result:
4. Investigate total traffic volume over time
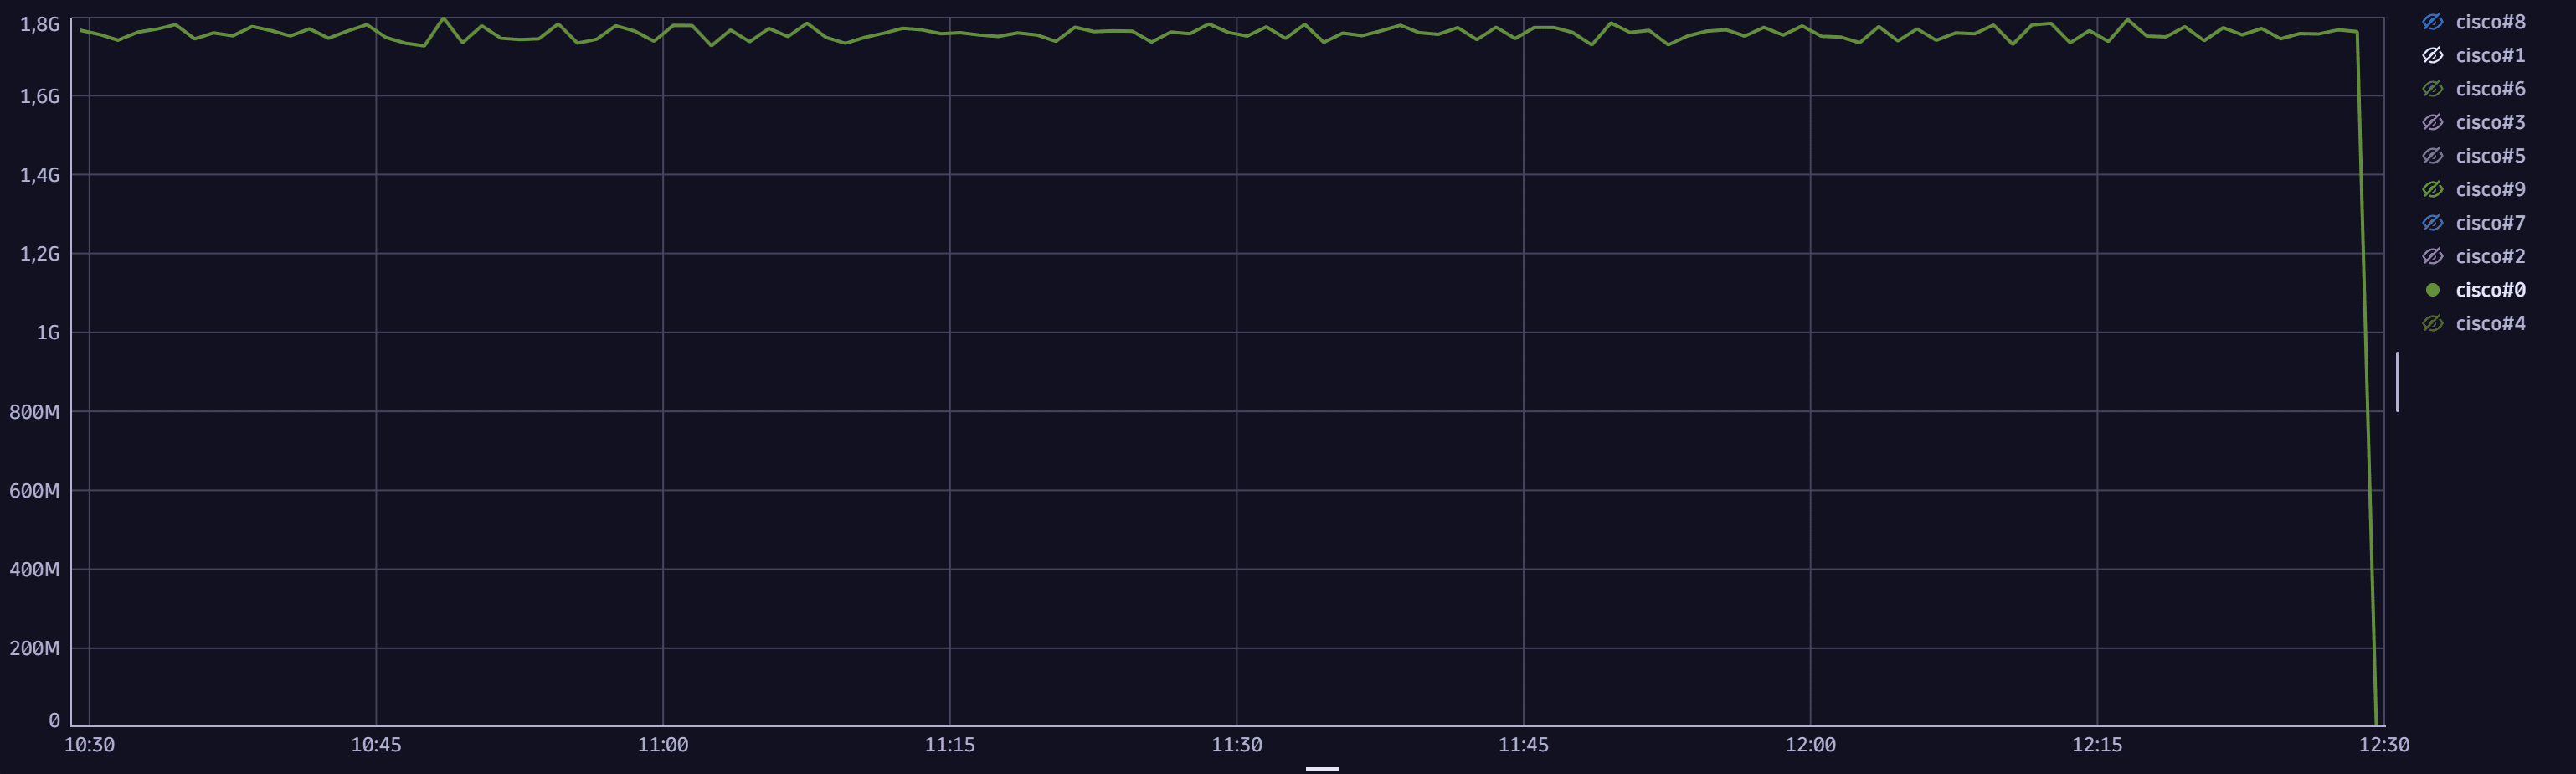
In modern devices and well-engineered router or switch software configurations, most traffic doesn't hit the control plane and is processed in hardware. When this happens for various reasons, such as control plane attacks, you can observe a correlation between traffic volume and CPU and memory utilization, and you can extract a timeseries and graph the sum of incoming and outgoing traffic over time.
timeseries {t_in=avg(`com.dynatrace.extension.snmp-generic-cisco-device.if.hc.in.octets.count`, rate:1s),t_out=avg(`com.dynatrace.extension.snmp-generic-cisco-device.if.hc.out.octets.count`, rate:1s)},by:{ `dt.entity.snmp:com_dynatrace_extension_snmp_generic_cisco_device`,`dt.entity.snmp:com_dynatrace_extension_snmp_generic_cisco_network_interface`}, interval:1m| summarize SumTraffic = sum(t_in[]+t_out[]), by:{`dt.entity.snmp:com_dynatrace_extension_snmp_generic_cisco_device`, timeframe, interval}| lookup [fetch `dt.entity.snmp:com_dynatrace_extension_snmp_generic_cisco_device`| fields id, system_name ],sourceField:`dt.entity.snmp:com_dynatrace_extension_snmp_generic_cisco_device`,lookupField:id,fields:{system_name }| fieldsRemove `dt.entity.snmp:com_dynatrace_extension_snmp_generic_cisco_device`| fieldsRename Name=system_name| sort arrayAvg(SumTraffic) desc // sort by average traffic volume| limit 10
Sample query result:
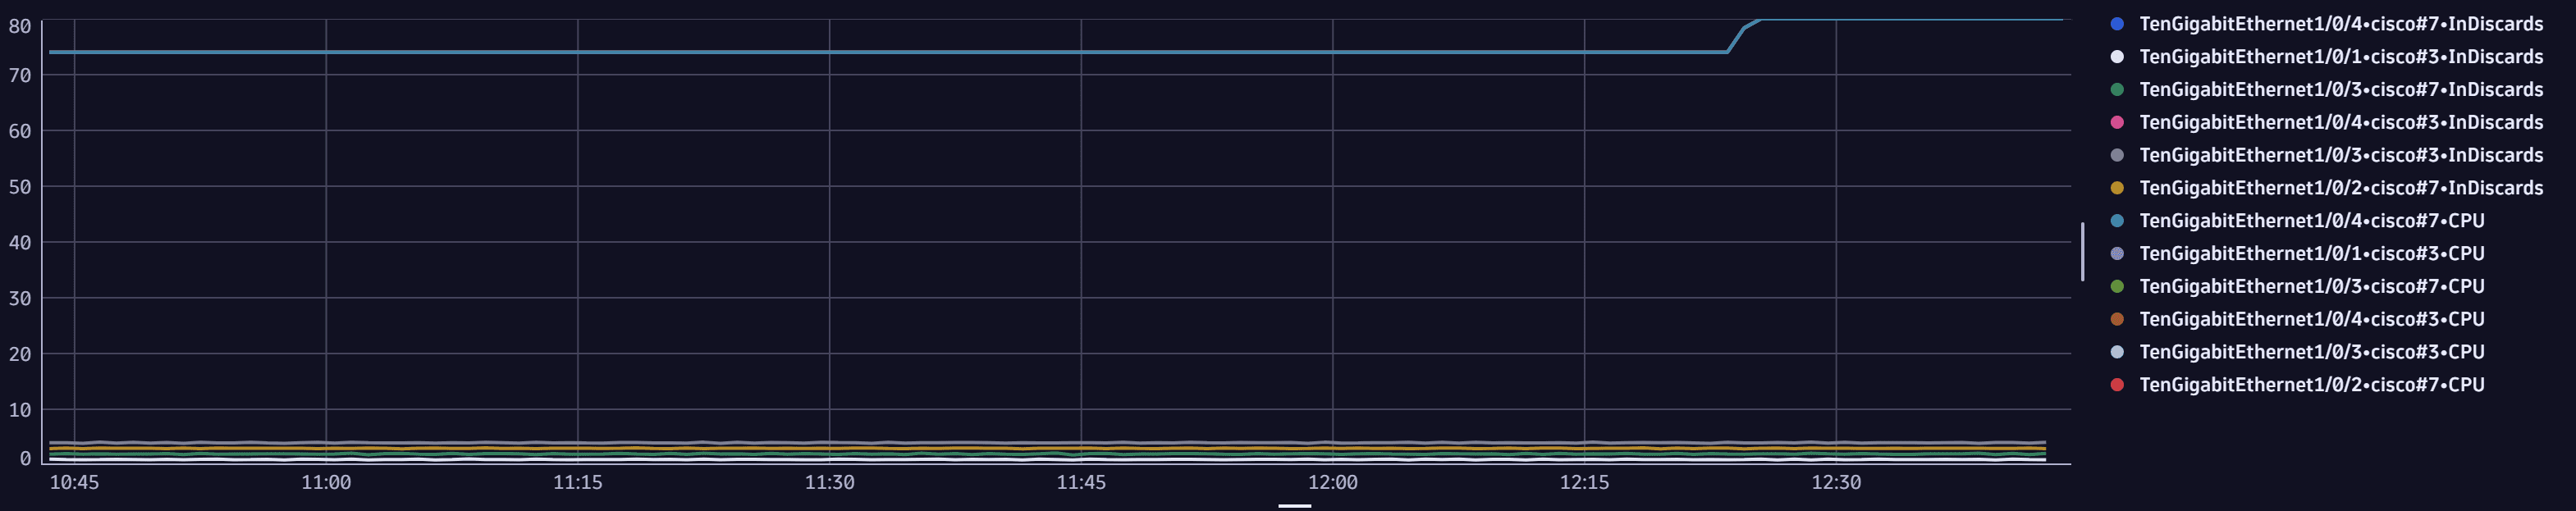
5. Investigate incoming discard packet rate over time
Limited resources, like CPU or memory, can be exhausted, causing incoming packet drops. Other causes of incoming discard packets, like routing issues or policing, might be the culprits. The rate at which incoming packets are discarded may indicate their root cause. To help in this assessment, you can extract a time series and graph the incoming discard packet rate over time.
timeseries t_indiscards=avg(`com.dynatrace.extension.snmp-generic-cisco-device.if.in.discards.count`,rate:1s),by: {`dt.entity.snmp:com_dynatrace_extension_snmp_generic_cisco_network_interface`,`dt.entity.snmp:com_dynatrace_extension_snmp_generic_cisco_device`}, interval:1m // a "per second" rate is created for incoming discards packet| lookup [fetch`dt.entity.snmp:com_dynatrace_extension_snmp_generic_cisco_network_interface`| fields id, description , child_of[`dt.entity.snmp:com_dynatrace_extension_snmp_generic_cisco_device`]],sourceField: `dt.entity.snmp:com_dynatrace_extension_snmp_generic_cisco_network_interface`,lookupField:id,fields:{description, `child_of[\`dt.entity.snmp:com_dynatrace_extension_snmp_generic_cisco_device\`]` }// get interface description| lookup [timeseries t_cpu=avg(`com.dynatrace.extension.snmp-generic-cisco-device.cpm.cpu.loadavg.5min`),by:{ `dt.entity.snmp:com_dynatrace_extension_snmp_generic_cisco_device`,`dt.entity.snmp:com_dynatrace_extension_snmp_generic_cisco_network_interface`}, interval:1m],sourceField:`dt.entity.snmp:com_dynatrace_extension_snmp_generic_cisco_device`,lookupField:`dt.entity.snmp:com_dynatrace_extension_snmp_generic_cisco_device`,fields:{ t_cpu}| lookup [fetch `dt.entity.snmp:com_dynatrace_extension_snmp_generic_cisco_device` | fields system_name,id],sourceField: `dt.entity.snmp:com_dynatrace_extension_snmp_generic_cisco_device`,lookupField: id,fields:{system_name}// get system name| fieldsRemove `dt.entity.snmp:com_dynatrace_extension_snmp_generic_cisco_network_interface`,`child_of[\`dt.entity.snmp:com_dynatrace_extension_snmp_generic_cisco_device\`]`,`dt.entity.snmp:com_dynatrace_extension_snmp_generic_cisco_device`| fieldsRename InDiscards = t_indiscards, CPU = t_cpu| filter arrayMax(CPU) > 60| sort arrayAvg(CPU) desc // sort by average CPU utilization| limit 6
Sample query result:
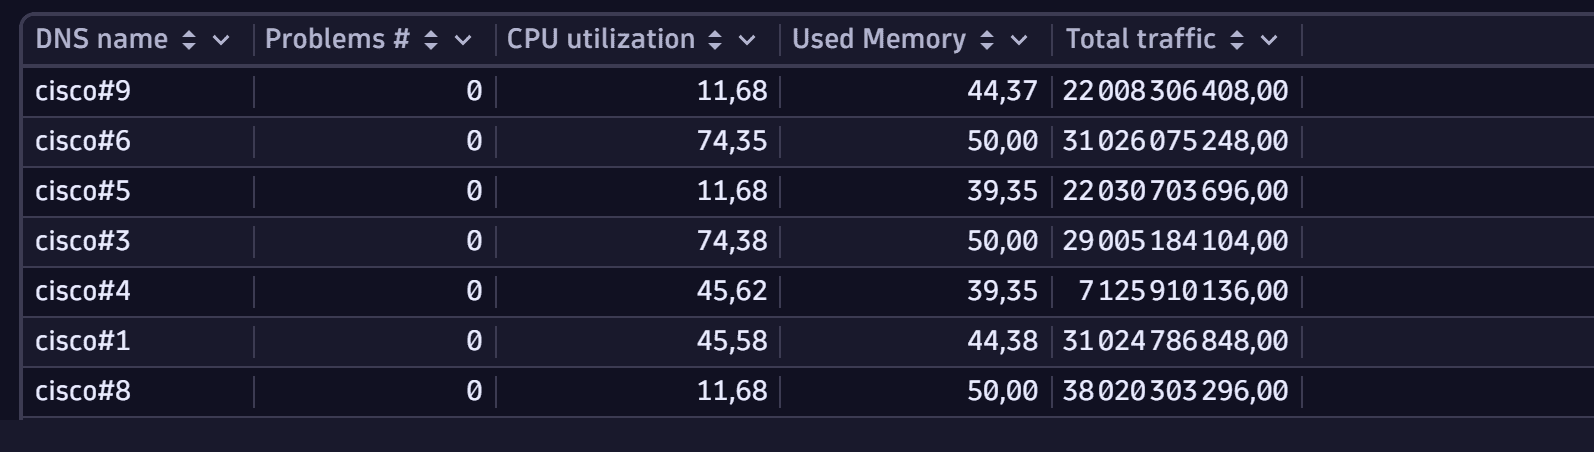
6. Gather all data in a list of devices
After gathering all the elements you explored, you can combine them in a synthetic table, which offers a per-device table.
timeseries {t_cpu=avg(`com.dynatrace.extension.snmp-generic-cisco-device.cpm.cpu.loadavg.5min`),t_free=avg(`com.dynatrace.extension.snmp-generic-cisco-device.cpm.cpu.memory.hc.free`),t_used=avg(`com.dynatrace.extension.snmp-generic-cisco-device.cpm.cpu.memory.hc.used`)},by: {`dt.entity.snmp:com_dynatrace_extension_snmp_generic_cisco_device`},interval:1m| lookup [fetch `dt.entity.snmp:com_dynatrace_extension_snmp_generic_cisco_device` | fields id, system_name],sourceField:`dt.entity.snmp:com_dynatrace_extension_snmp_generic_cisco_device`,lookupField:id,fields:{system_name} // get device name| fieldsAdd avg_cpu=arrayAvg(`t_cpu`), avg_mem_free=arrayAvg(`t_free`), avg_mem_used=arrayAvg(`t_used`) // average CPU and Memory usage over the interval| fieldsadd `Used Memory` = 100*(avg_mem_used/(avg_mem_free + avg_mem_used)) // calculating the memory usage rate| lookup [ timeseries {t_in=avg(`com.dynatrace.extension.snmp-generic-cisco-device.if.hc.in.octets.count`, rate:1s),t_out=avg(`com.dynatrace.extension.snmp-generic-cisco-device.if.hc.out.octets.count`, rate:1s)},by:{ `dt.entity.snmp:com_dynatrace_extension_snmp_generic_cisco_device`,`dt.entity.snmp:com_dynatrace_extension_snmp_generic_cisco_network_interface`}, interval:1m // a "per second" rate averaged over one minute is created for 64-bit interface traffic counters| summarize `Total traffic`= sum(8*toLong(arrayAvg(t_in)))+sum(8*toLong(arrayAvg(t_out))),by:{`dt.entity.snmp:com_dynatrace_extension_snmp_generic_cisco_device`}], // sum in and out interface traffic by devicesourceField:`dt.entity.snmp:com_dynatrace_extension_snmp_generic_cisco_device`,lookupField:`dt.entity.snmp:com_dynatrace_extension_snmp_generic_cisco_device`,fields:{`Total traffic`}| lookup sourceField:`dt.entity.snmp:com_dynatrace_extension_snmp_generic_cisco_device`, lookupField: affected_id, fields: {problems},[fetch events| filter event.kind == "DAVIS_PROBLEM" | fieldsAdd affected_entity_id = affected_entity_ids[0] | summarize collectDistinct(event.status),by:{display_id, affected_entity_id}, alias:problem_status | filter NOT in(problem_status, "CLOSED")| summarize problems = count(), by: {affected_id = affected_entity_id}]| fields `dt.entity.snmp:com_dynatrace_extension_snmp_generic_cisco_device`, problem_count = if(isNull(problems), 0, else: problems),`Total traffic`, system_name, `Used Memory`,avg_cpu| fields `DNS name` = system_name, `Problems #` = problem_count, `CPU utilization` = avg_cpu, `Used Memory`, `Total traffic`| filter isNotNull(`Total traffic`) // filter devices not reporting traffic| sort `Problems #` desc
Sample query result:
Conclusion
By implementing the steps outlined in this guide, you've taken a methodical approach to network device troubleshooting with Dynatrace.
- This practice equips NetOps professionals with the tools to monitor and optimize on-premises networks from a device level to individual metrics.
- The result is an on-premises network devices infrastructure swiftly brought back to the nominal state to constantly support the applications running on top of it.
We encourage you to explore additional resources by installing more network device extensions from the Dynatrace Hub and using the Infrastructure & Operations to monitor and troubleshoot the network devices.