Check your application health
- Dynatrace Classic
- How-to guide
- 4-min read
Dynatrace offers a dedicated page where you can check the health of your web application.
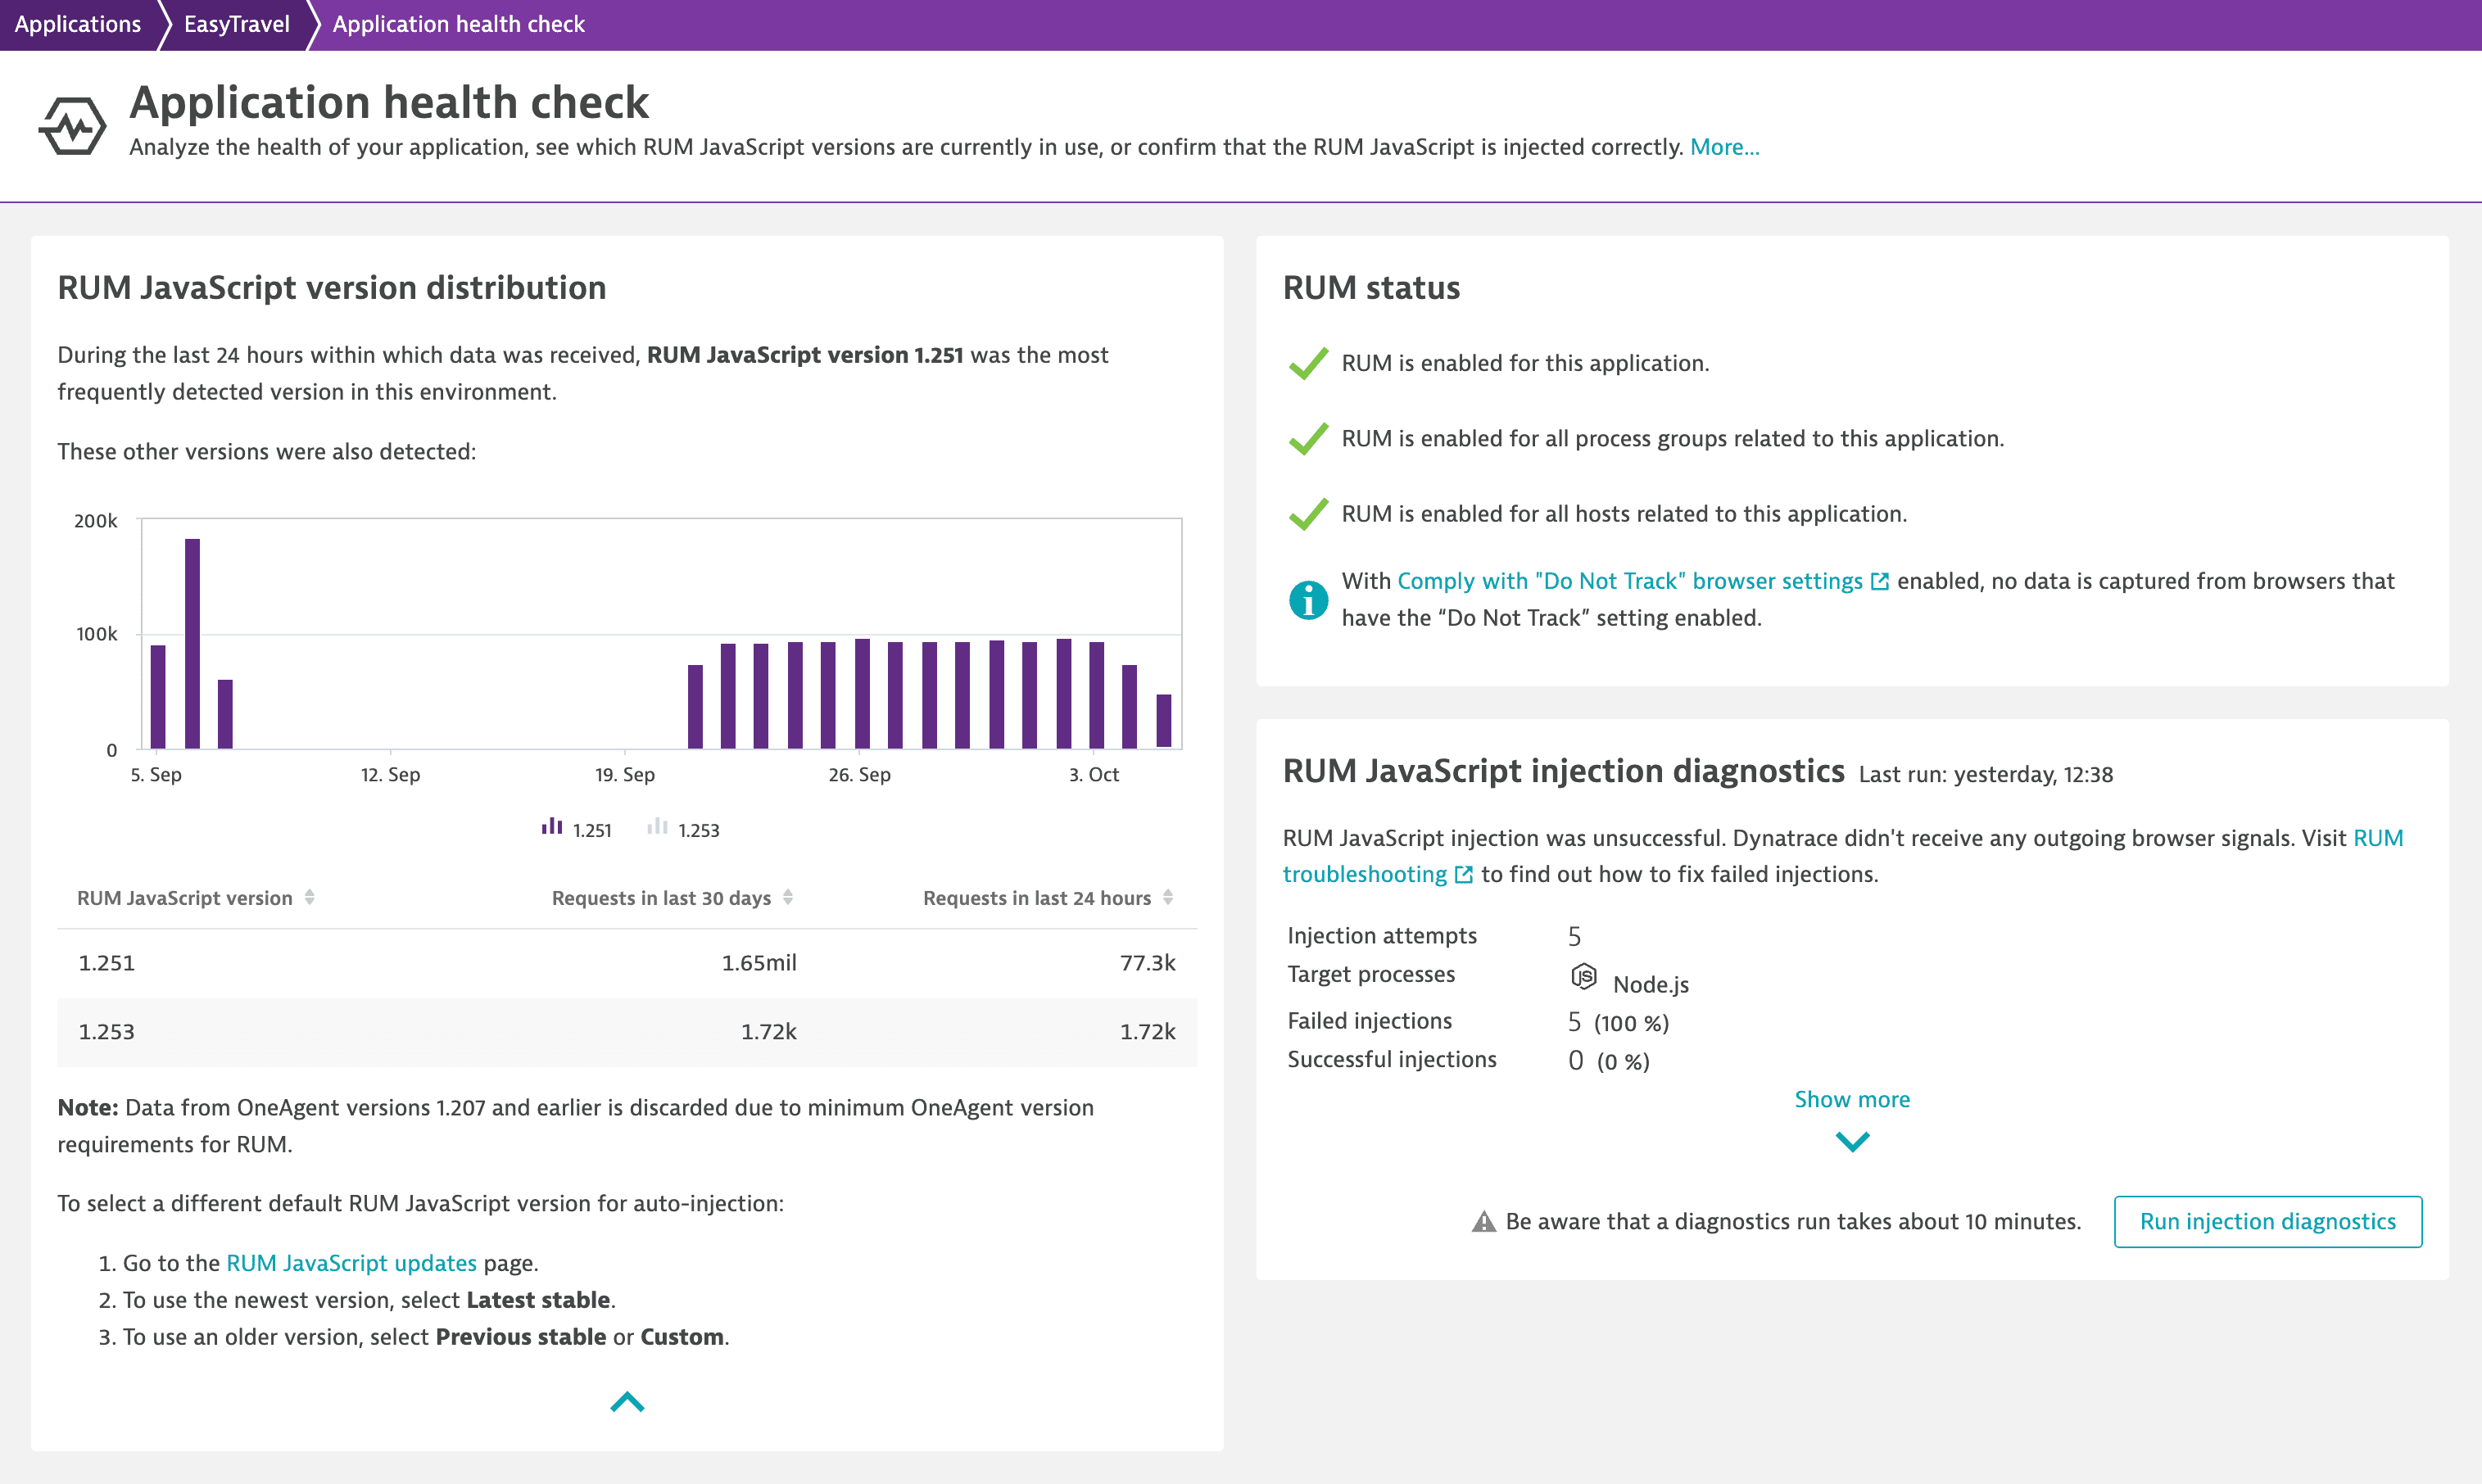
The Application health check page provides information on the most common issues that might affect your web application. On this page, you can check the health of your application, see which RUM JavaScript versions are currently in use, or confirm that the RUM JavaScript is injected correctly. Examining this page should be the first step in troubleshooting any RUM issues when the data is partially or completely missing.
To access the Application health check page
- Go to Web.
- Select the application whose health you want to check.
- In the upper-right corner of the application overview page, select More (…) > Health check.
The following sections are available on the Application health check page:

RUM JavaScript version distribution
In this section, you can learn which RUM JavaScript version is the most frequently used in your application and check the RUM JavaScript version distribution.
Select Show more to view a table showing the number of requests—in the last 30 days and 24 hours—for each detected RUM JavaScript version.
This section also shows for which RUM JavaScript versions the RUM data is discarded. To receive RUM data, update the RUM JavaScript to a later version than indicated in this section.
RUM status
In the RUM status section, you can see if RUM is activated for your application, related process groups, and hosts. Moreover, this section explains why Dynatrace doesn't capture RUM data for certain user sessions.
The following configuration-related RUM issues and warnings might be shown in this section:
| Issue or warning | Explanation |
|---|---|
| If RUM is disabled for your application, follow the provided link to enable RUM. |
| If RUM is disabled for process groups related to your application, follow the provided links to configure these process groups. |
| If RUM is disabled for hosts related to your application, follow the provided links to configure these hosts. |
| If you've run out of DEM units, RUM is disabled and Dynatrace receives no data from your application. Increase the DEM unit quota or enable DEM overages. |
| When Data-collection and opt-in mode is enabled, Dynatrace doesn't capture any data until a special API method is called for specific user sessions. If you want Dynatrace to capture data for all user sessions, disable this mode. |
| When the Comply with "Do Not Track" browser settings mode is enabled with the Turn Real User Monitoring off for "Do Not Track"-enabled browsers option, Dynatrace doesn't capture any data when a user has the "Do Not Track" setting turned on in their browser. If you want to ignore the "Do Not Track" browser setting and capture RUM data from all browsers, disable the Do Not Track mode. Alternatively, you can select the Capture anonymous user sessions for "Do Not Track"-enabled browsers option to send anonymized data from such browsers. |
RUM JavaScript injection diagnostics
Examine this section to get information on the RUM JavaScript injection status. You can check the number of injection attempts, learn the ratio of failed to successful injections, and view the injection failure reasons.
Select Run injection diagnostics to check the RUM JavaScript injection status.
When a diagnostics run is finished, the following information is available:
- Number of injection attempts
- List of target processes
- Number and percentage of failed injections
- Number and percentage of successful injections
Select Show more to view the injection failure reasons and the top five URLs for each issue.
You won't see the RUM JavaScript injection diagnostics section if your application is not an automatically injected application—specifically, if you manually inserted the RUM JavaScript into your application's pages.
