Extract a metric from user events
- Latest Dynatrace
- Tutorial
- Published Dec 19, 2025
OpenPipeline makes it straightforward to turn user events into custom metrics, giving you the power to analyze patterns that impact your goals in  Notebooks and
  Dashboards while ensuring your data remains useful for long-term analysis. Its ability to parse data from standard user event attributes into dedicated fields facilitates metric extraction.
To illustrate the process, this guide uses a travel booking site as an example—the number of views per journey is extracted into a custom metric to help identify trends.
Example scenario
In this tutorial, we’ll use the Dynatrace demo application easyTravel as an example. easyTravel lists available journeys, and when a user selects a journey, its details are displayed.
The application is instrumented with the RUM JavaScript, and the captured data is mapped to a frontend named easytravel. Each time a user navigates from one page to another—for example, from the home page to a specific journey—a navigation event is captured.
Navigation events provide the information needed to analyze the number of views per journey. Each journey has a unique ID. When a soft navigation to a specific journey occurs, the URL path updates to include that journey ID—for example, /easytravel/journeys/24859438. This value is captured in the view.url.path field of the navigation event.
Therefore, you can analyze the number of views per journey by running the following DQL query:
fetch user.events| filter matchesPhrase(frontend.name, "easytravel") ANDcharacteristics.has_navigation == true ANDmatchesPhrase(view.url.path, "/easytravel/journeys/*") ANDnot matchesPhrase(view.url.path, "*book")| parse view.url.path, "'/'LD'/'LD'/'LD:journey_id"| summarize by: {journey_id}, count()| sort `count()` desc
While this query works well for short-term analysis, it’s not ideal for monitoring long-term trends. For that purpose, creating a custom metric derived from the query using OpenPipeline is a more suitable approach.
Before you begin
Prior knowledge
Prerequisites
Ensure you have the permissions described in New RUM Experience permissions.
How-to
1. Create a pipeline for parsing and metric extraction
-
Go to
 Settings > Process and contextualize > OpenPipeline > User events > Pipelines.
 -
To create a new pipeline, select
 Pipeline and enter a name (for example,
 easyTravel). -
To configure the parsing of the journey ID into a separate field, go to Processing >
Processor > DQL and define the processor by entering:-
A descriptive name (for example,
Add journey_id). -
A matching condition. In our example, the matching condition is:
characteristics.has_navigation == true ANDmatchesPhrase(view.url.path, "/easytravel/journeys/*") ANDnot matchesPhrase(view.url.path, "*book") -
A processor definition. In our example, the processor definition is:
parse view.url.path, "'/'LD'/'LD'/'LD:journey_id"| fieldsAdd journey_id
-
-
To configure metric extraction, go to Metric extraction >
Processor > Counter metric and define the processor by entering:- A descriptive Name (for example,
Viewed journeys). - A Matching condition (
isNotNull(journey_id)). - A Metric key (
easytravel.journey_view_count). - A metric dimension. Under Dimensions
- Select Custom.
- Enter a Field name on record (
journey_id). - Enter a Dimension name (
journey_id).
- A descriptive Name (for example,
-
Select Add dimension.
-
Select Save.
2. Route data to the pipeline
-
Go to
Settings > Process and contextualize > OpenPipeline > User events > Dynamic routing. -
To create a new route, select
Dynamic route and specify:-
A descriptive Name (for example,
easyTravel route). -
A Matching condition. In our example, the matching condition is:
matchesValue(frontend.name, "easytravel") -
The Pipeline containing the processing instructions (
easyTravel).
-
-
Select Save.
Conclusion
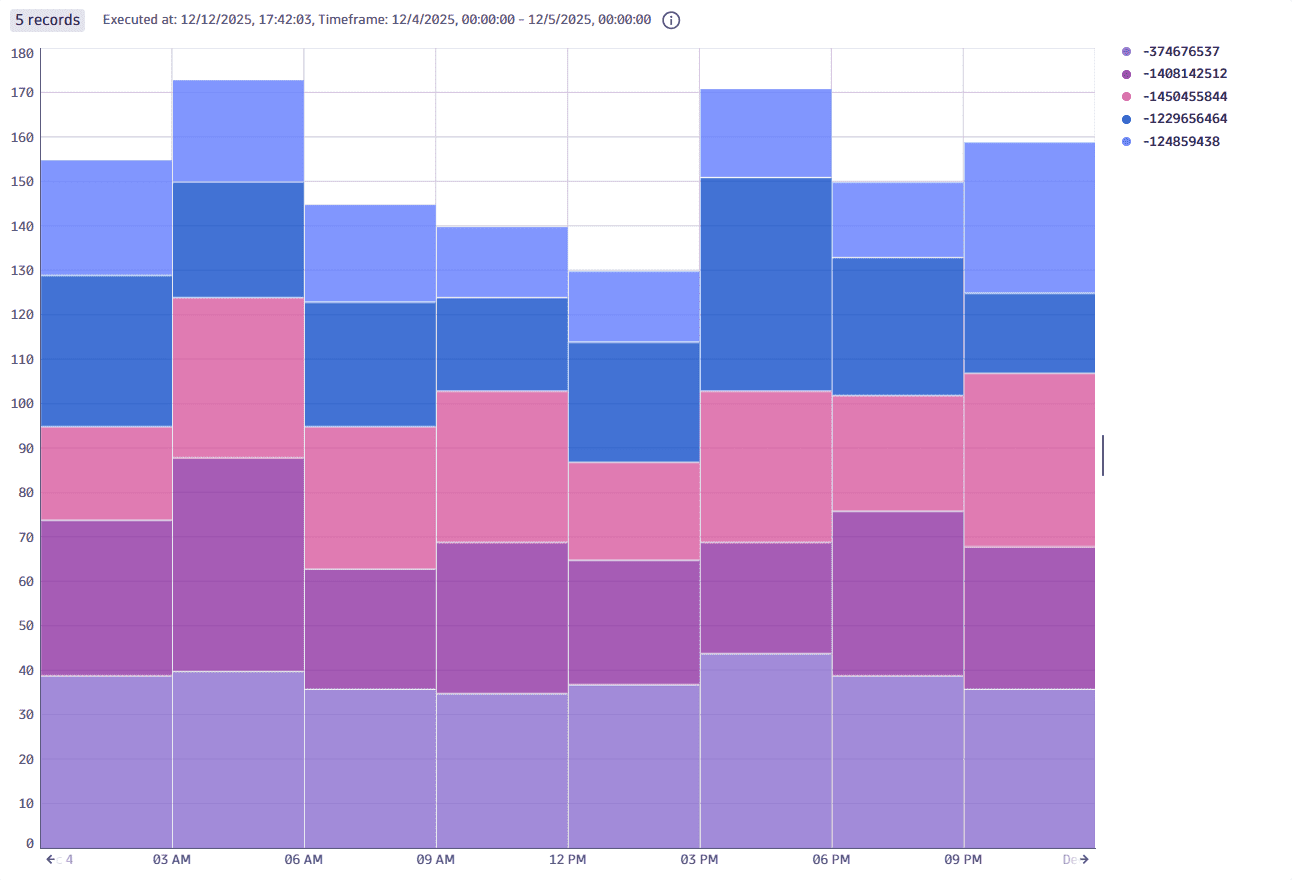
You have successfully created a pipeline to parse user events and extract a metric. You can now go to Notebooks and view it, for example using the following query:
timeseries count = sum(easytravel.journey_view_count), by: {journey_id}, interval: 3h| sort arraysum(count) desc| limit 5
Related topics
 OpenPipeline