Effective customer support with session segmentation
- Tutorial
- 8-min read
- Published Oct 03, 2023
Your customer support department probably receives thousands of support tickets every year, maybe every month. Some of these tickets require detailed insights into the customer's workflow to determine where the problem occurred and solve the case. Drilling into customer issues—such as slowly loading webpages, unresponsive UI, or various request and JavaScript errors—is cumbersome and takes a long time to resolve, especially when the information is missing.
Thanks to session segmentation, however, getting your customers out of trouble is easier and quicker.
With session segmentation—also known as user session analysis—you get full visibility into how your users experience every digital transaction across web, mobile, and custom applications. You can categorize your application's user sessions into meaningful groups based on shared characteristics, such as an operating system, browser type, or location.You can also find specific users and sessions via advanced filtering attributes, which is very beneficial for resolving customer support requests.
Session segmentation enables your customer support to:
- Reduce the resolution time of customer support tickets.
- Save your time and your customers' time.
- Experience an easier troubleshooting process.
- Prevent customer frustration and improve your customer satisfaction rating.
Scenario
Let's see how your customer support experts can leverage session segmentation when working on support tickets and resolving customer complaints.
For this use case, imagine that your customer, Daniel Adams, creates a support ticket stating that your website is very slow and that there was some kind of an error. He has neither mentioned the exact page nor provided details on the error.
The sections below explain how to find a specific customer's session, study its details, and get even more insights via waterfall analysis and distributed traces.

Find the problematic session
After receiving customer feedback, the first important step is to check the problematic user session to understand what went wrong. If you've leveraged user tagging, it's very easy to find the session of the person who submitted a support ticket. With user tags, which are comprised of a username, nickname, or email, you can analyze a specific user's behavior and experience via user session analysis.
To view problematic user sessions of a particular user
-
In Dynatrace, go to
 Session Segmentation.
 -
Use the timeframe selector in the upper-right corner of the page to set the analysis timeframe to the date and time when the issue occurred.
-
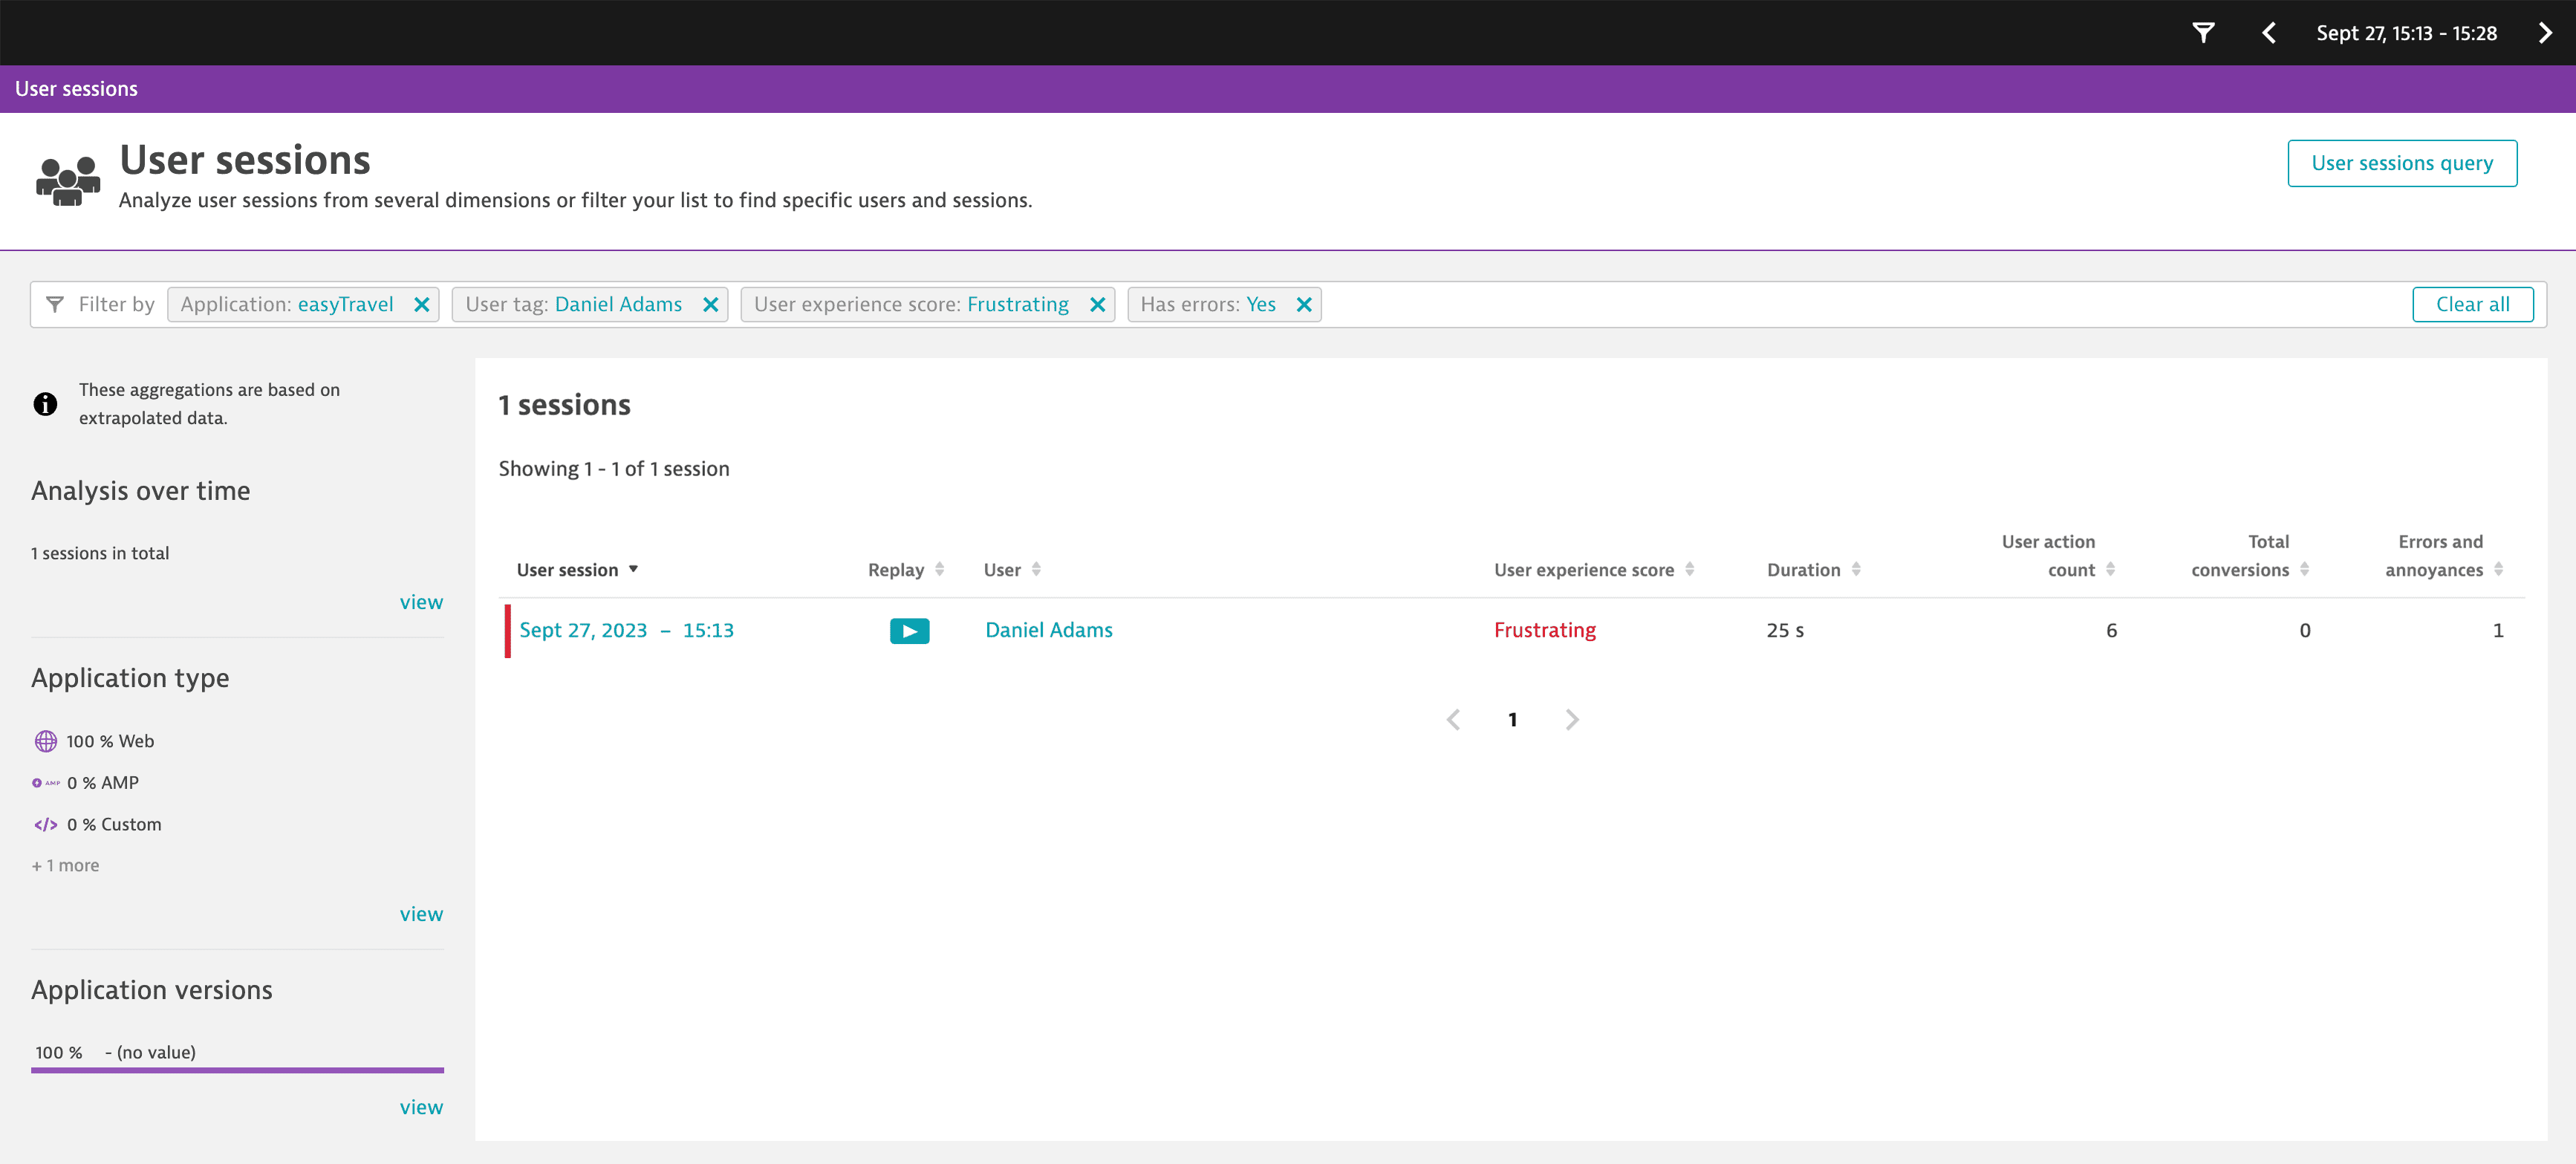
Select the Filter by box at the top of the page, and set the following filtering attributes. Once you select an attribute, the possible values for that attribute are displayed.
- Application: <your application name>
- User tag: <tag of the user who reported the issue>
- User experience score: Frustrating if the user complained of a slow UI
- Has errors: Yes if the user reported an error
The list of user sessions updates to show the sessions that match the filtering attributes that you've set.
-
Select a timestamp of the required user session to navigate to the session details page.
In the example below, you can see a session entry for Daniel Adams. The session started at 15:13 on September 27, 2023, lasted for 25 seconds, and contained one error.
Explore the session details
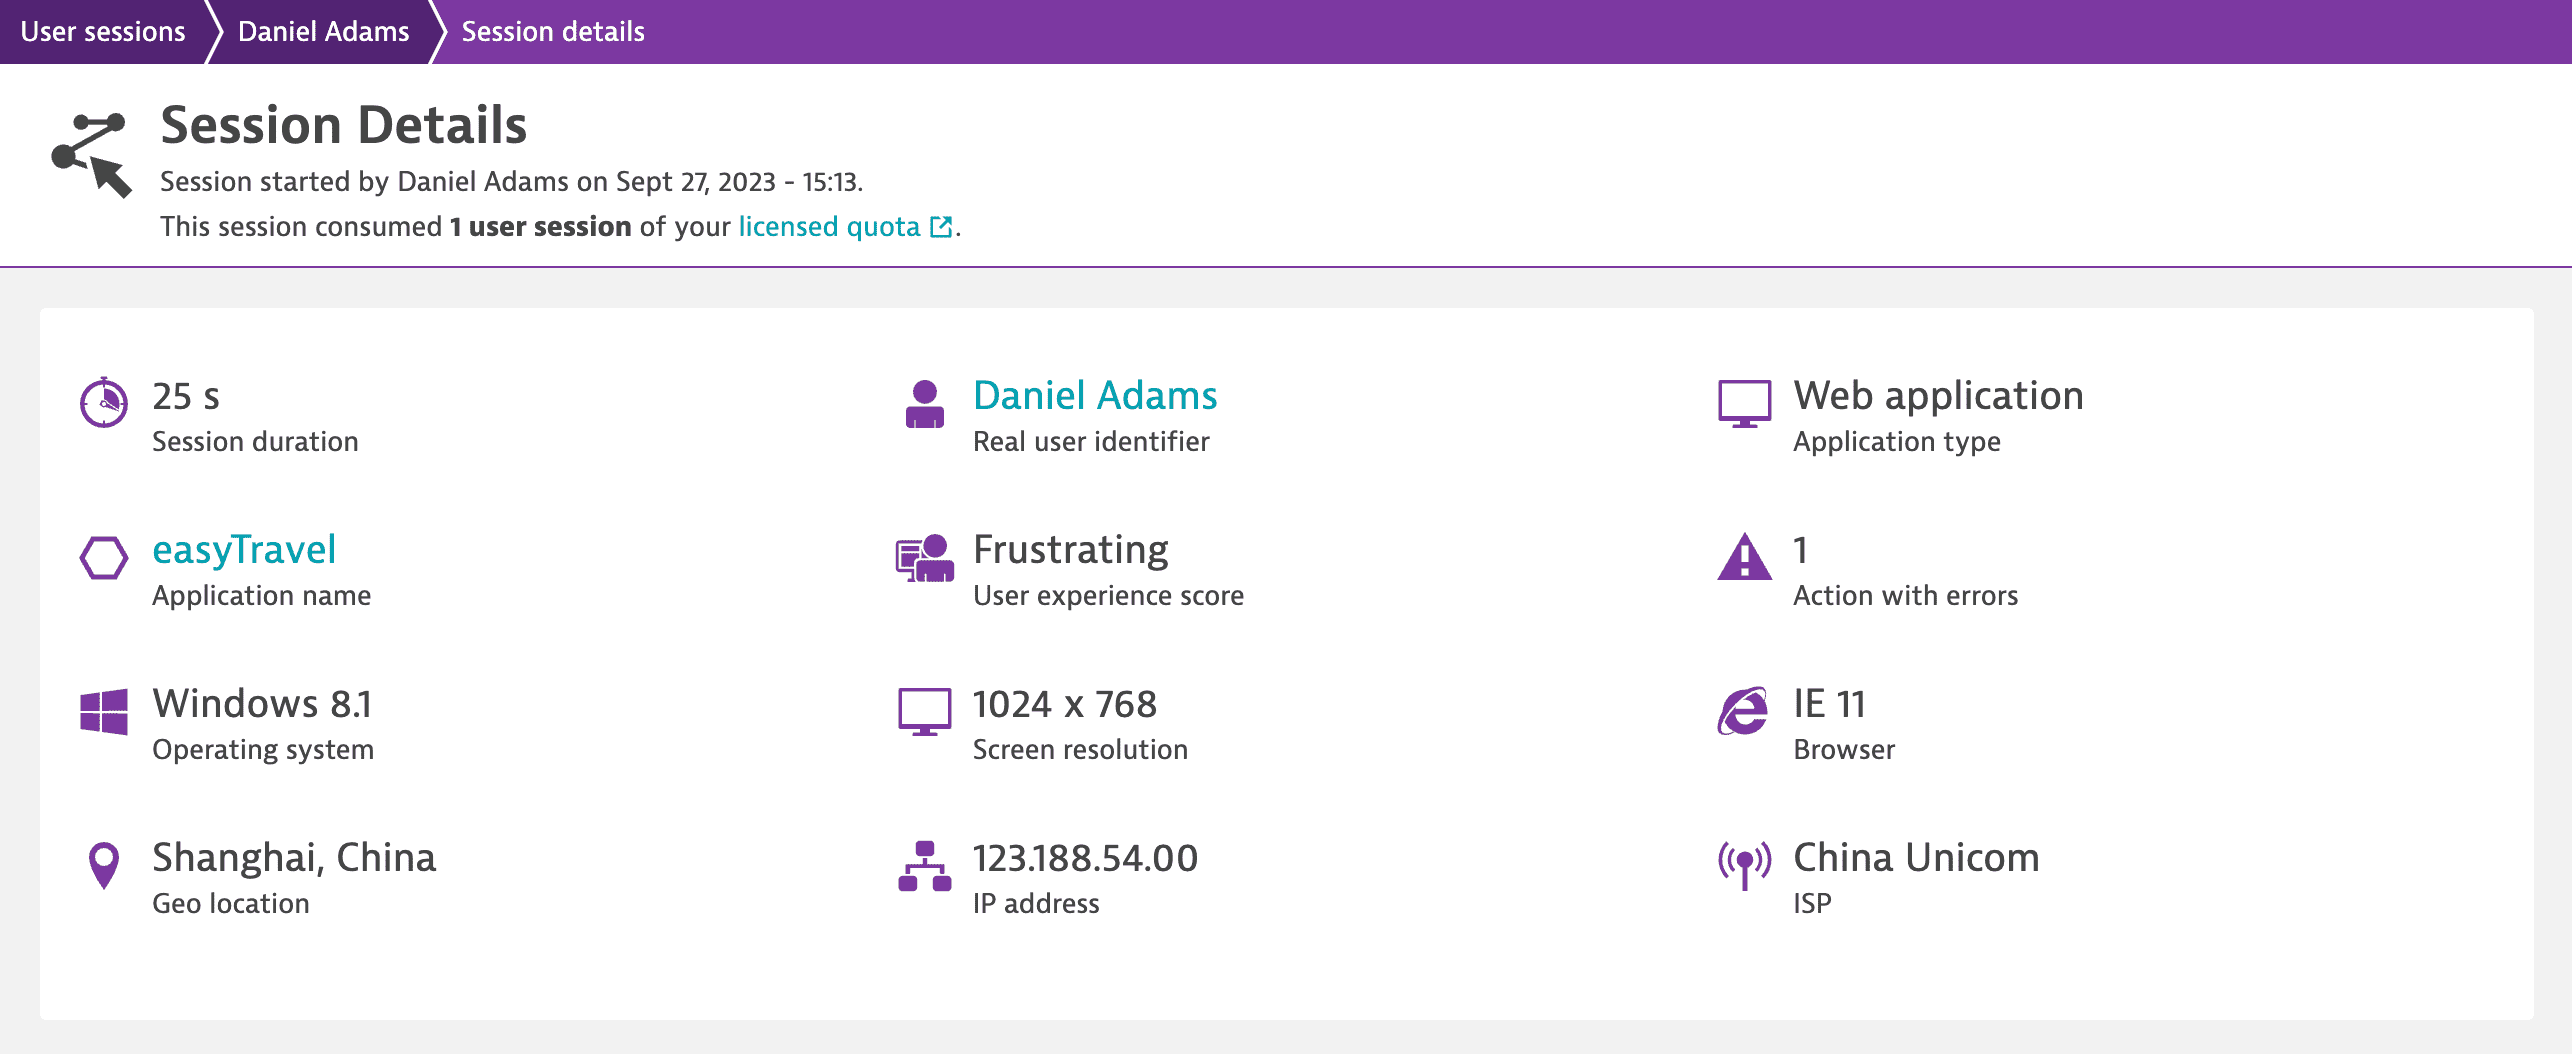
The session details page provides valuable information on the user session, for example, the session start time, duration, and user experience score. On this page, you can also find important device-related information such as the screen resolution, browser, operating system, IP address, and more.
-
Under Analysis, check the user session timeline. Errors and annoyances are marked with red color.

-
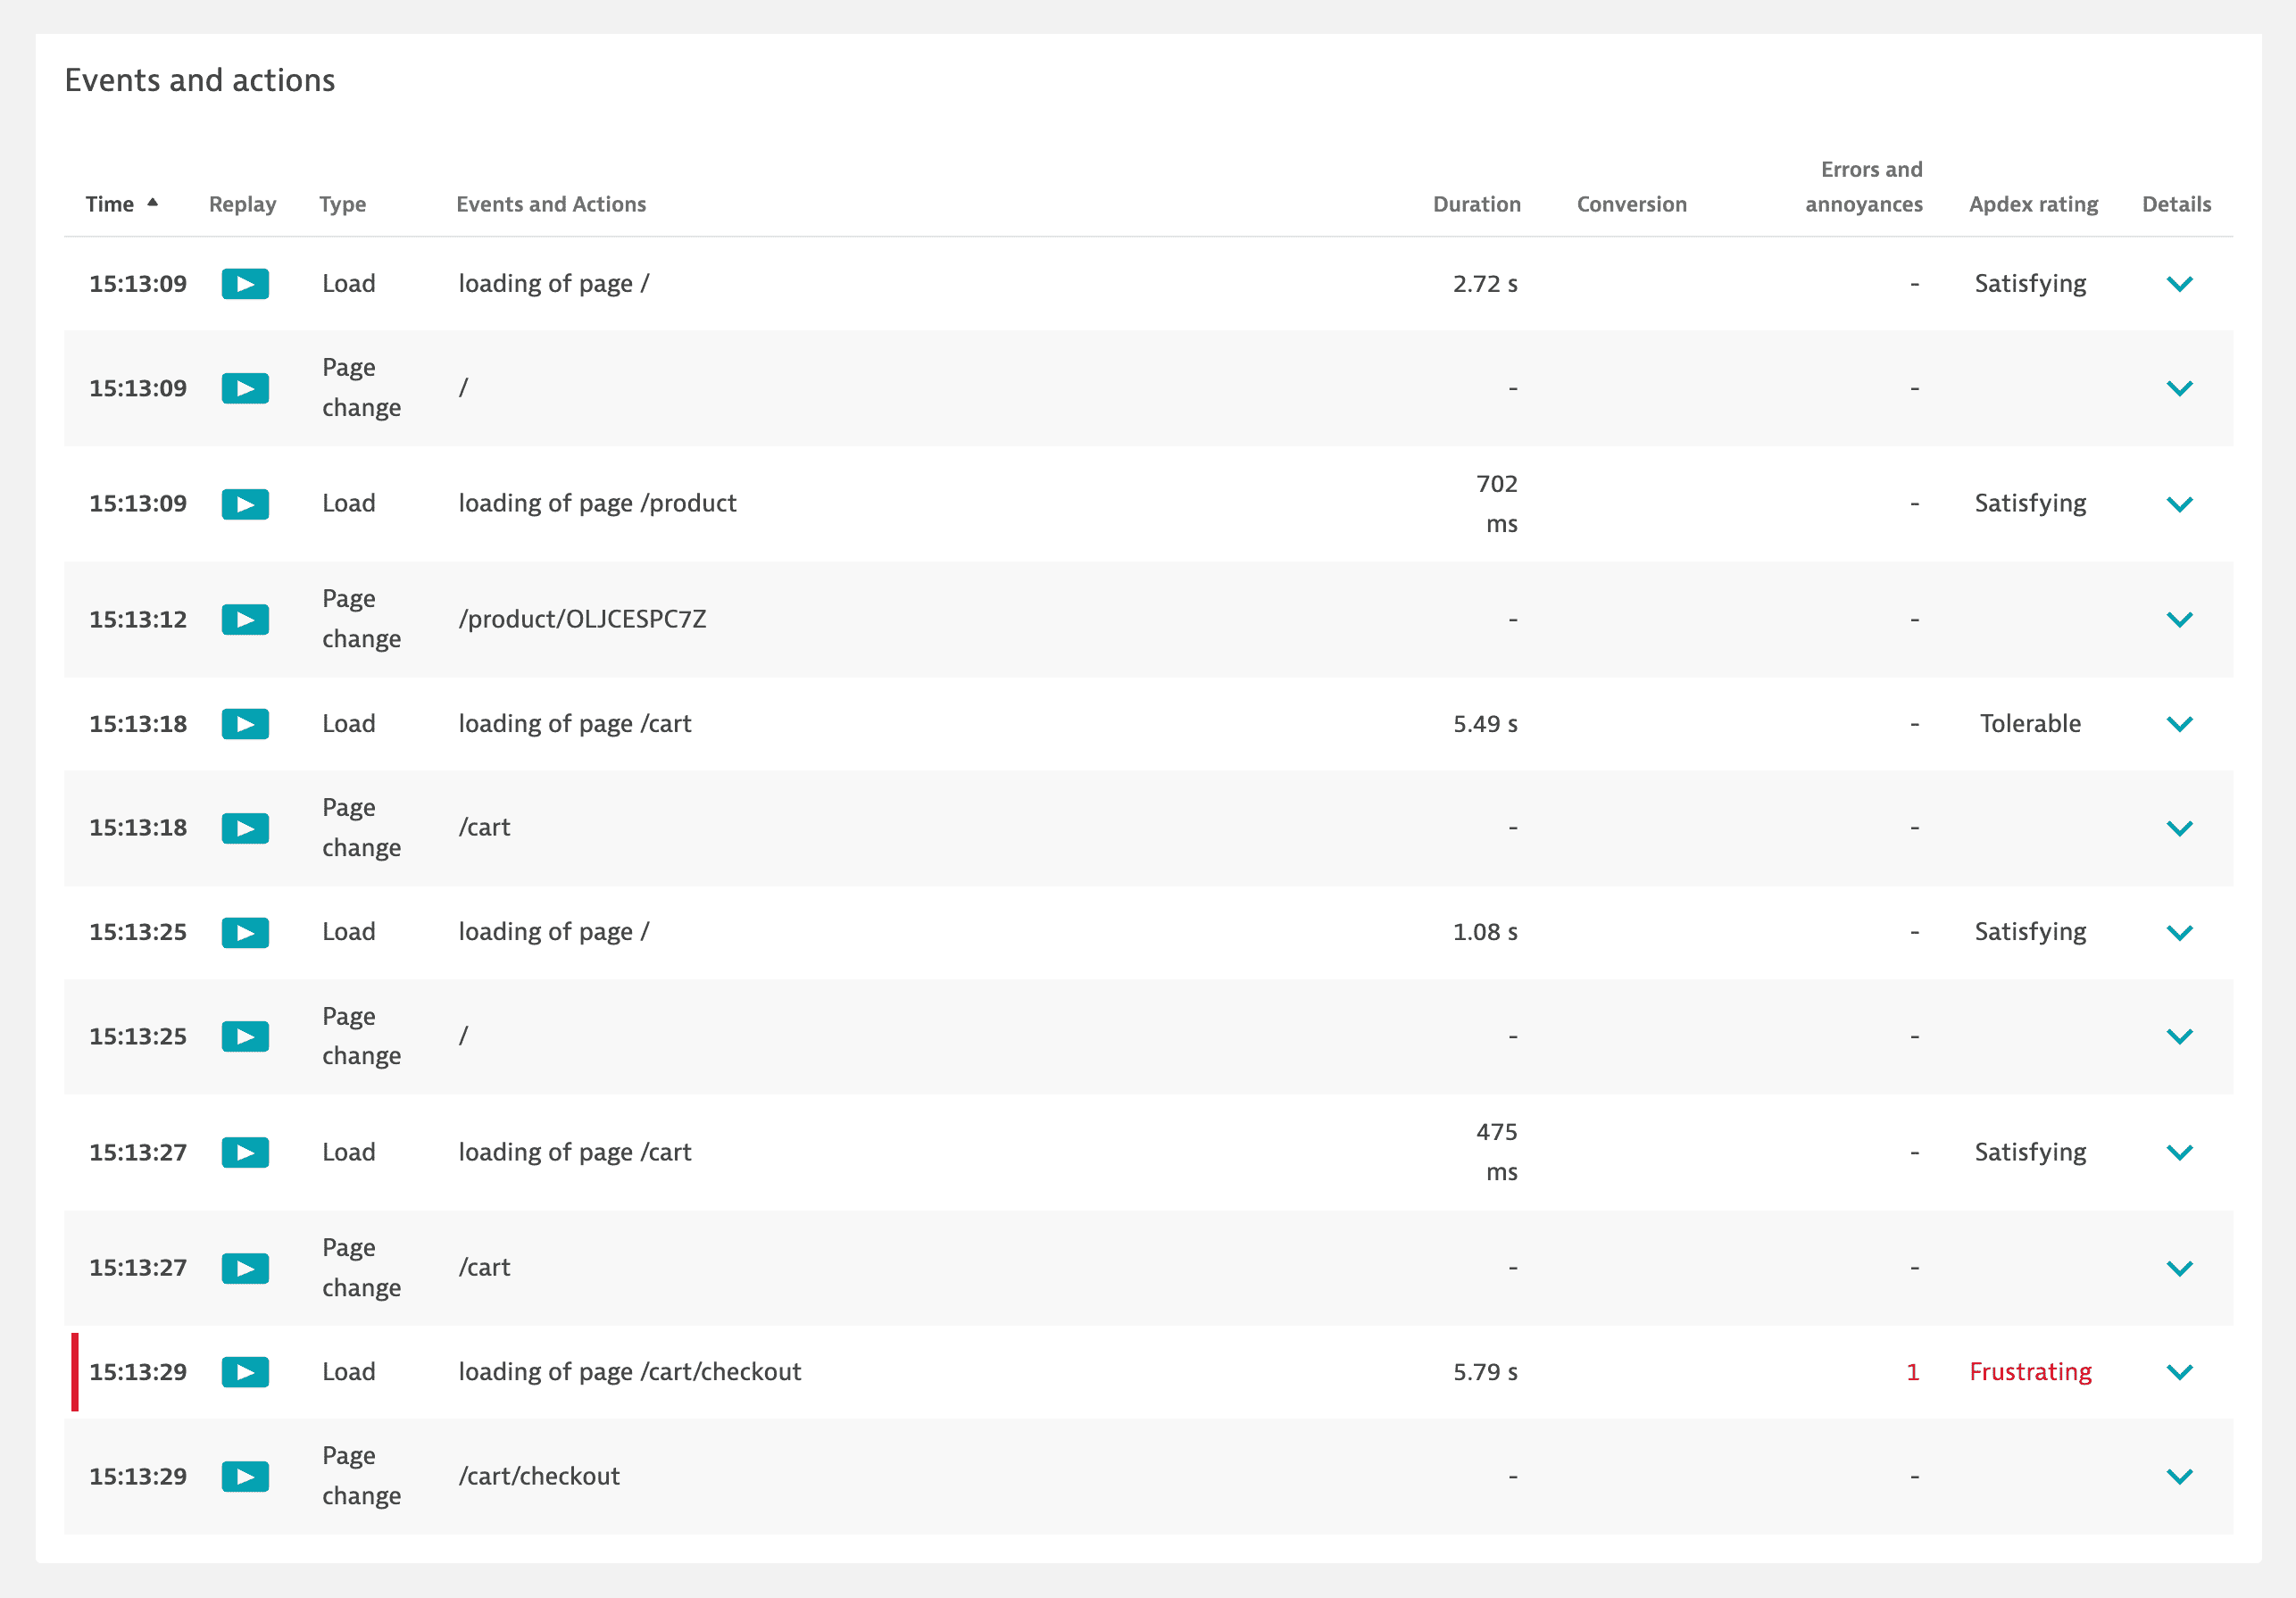
Scroll down to the Events and actions section to see what actions the user performed and what user and error events happened during the session.
-
Filter actions and events by action type, Apdex rating, error type, or even conversion goal.

-
Expand
the required action or event to view more details.
In our example, you can see that a request error happened during the
loading of page /cart/checkoutload action, and the Apdex rating for this action is Frustrating.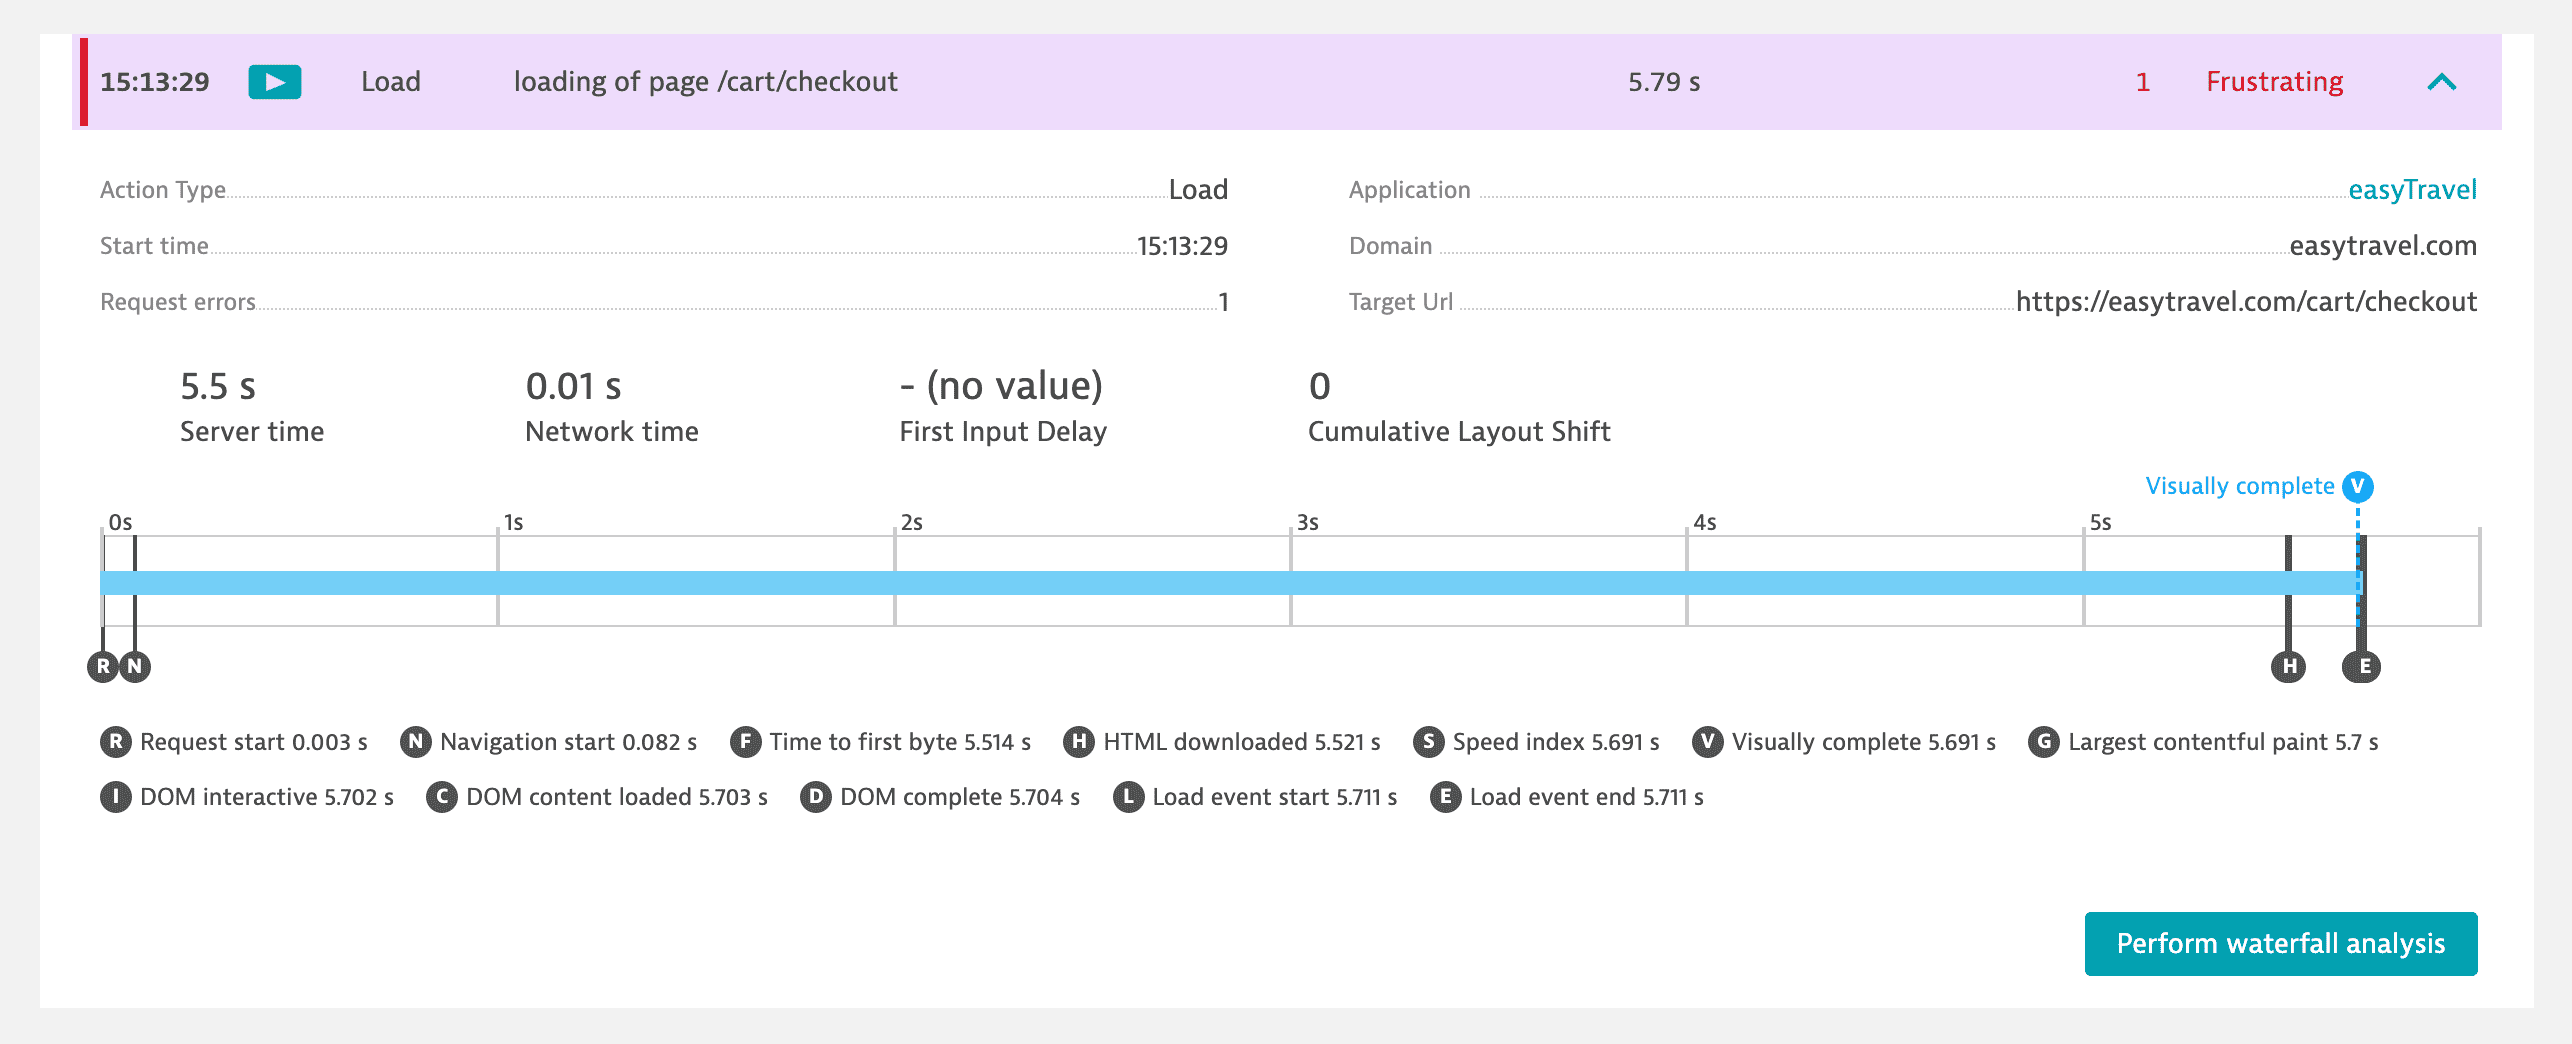
Watch the session recording
A Session Replay recording, if available for a user session, offers an enhanced level of insight into your user's journey. Session Replay can capture and visually replay each click or tap made within your application, creating an immersive movie-like experience. This feature helps to resolve customer complaints, reproduce production issues, improve overall usability, or fix application bugs.
To watch a session recording
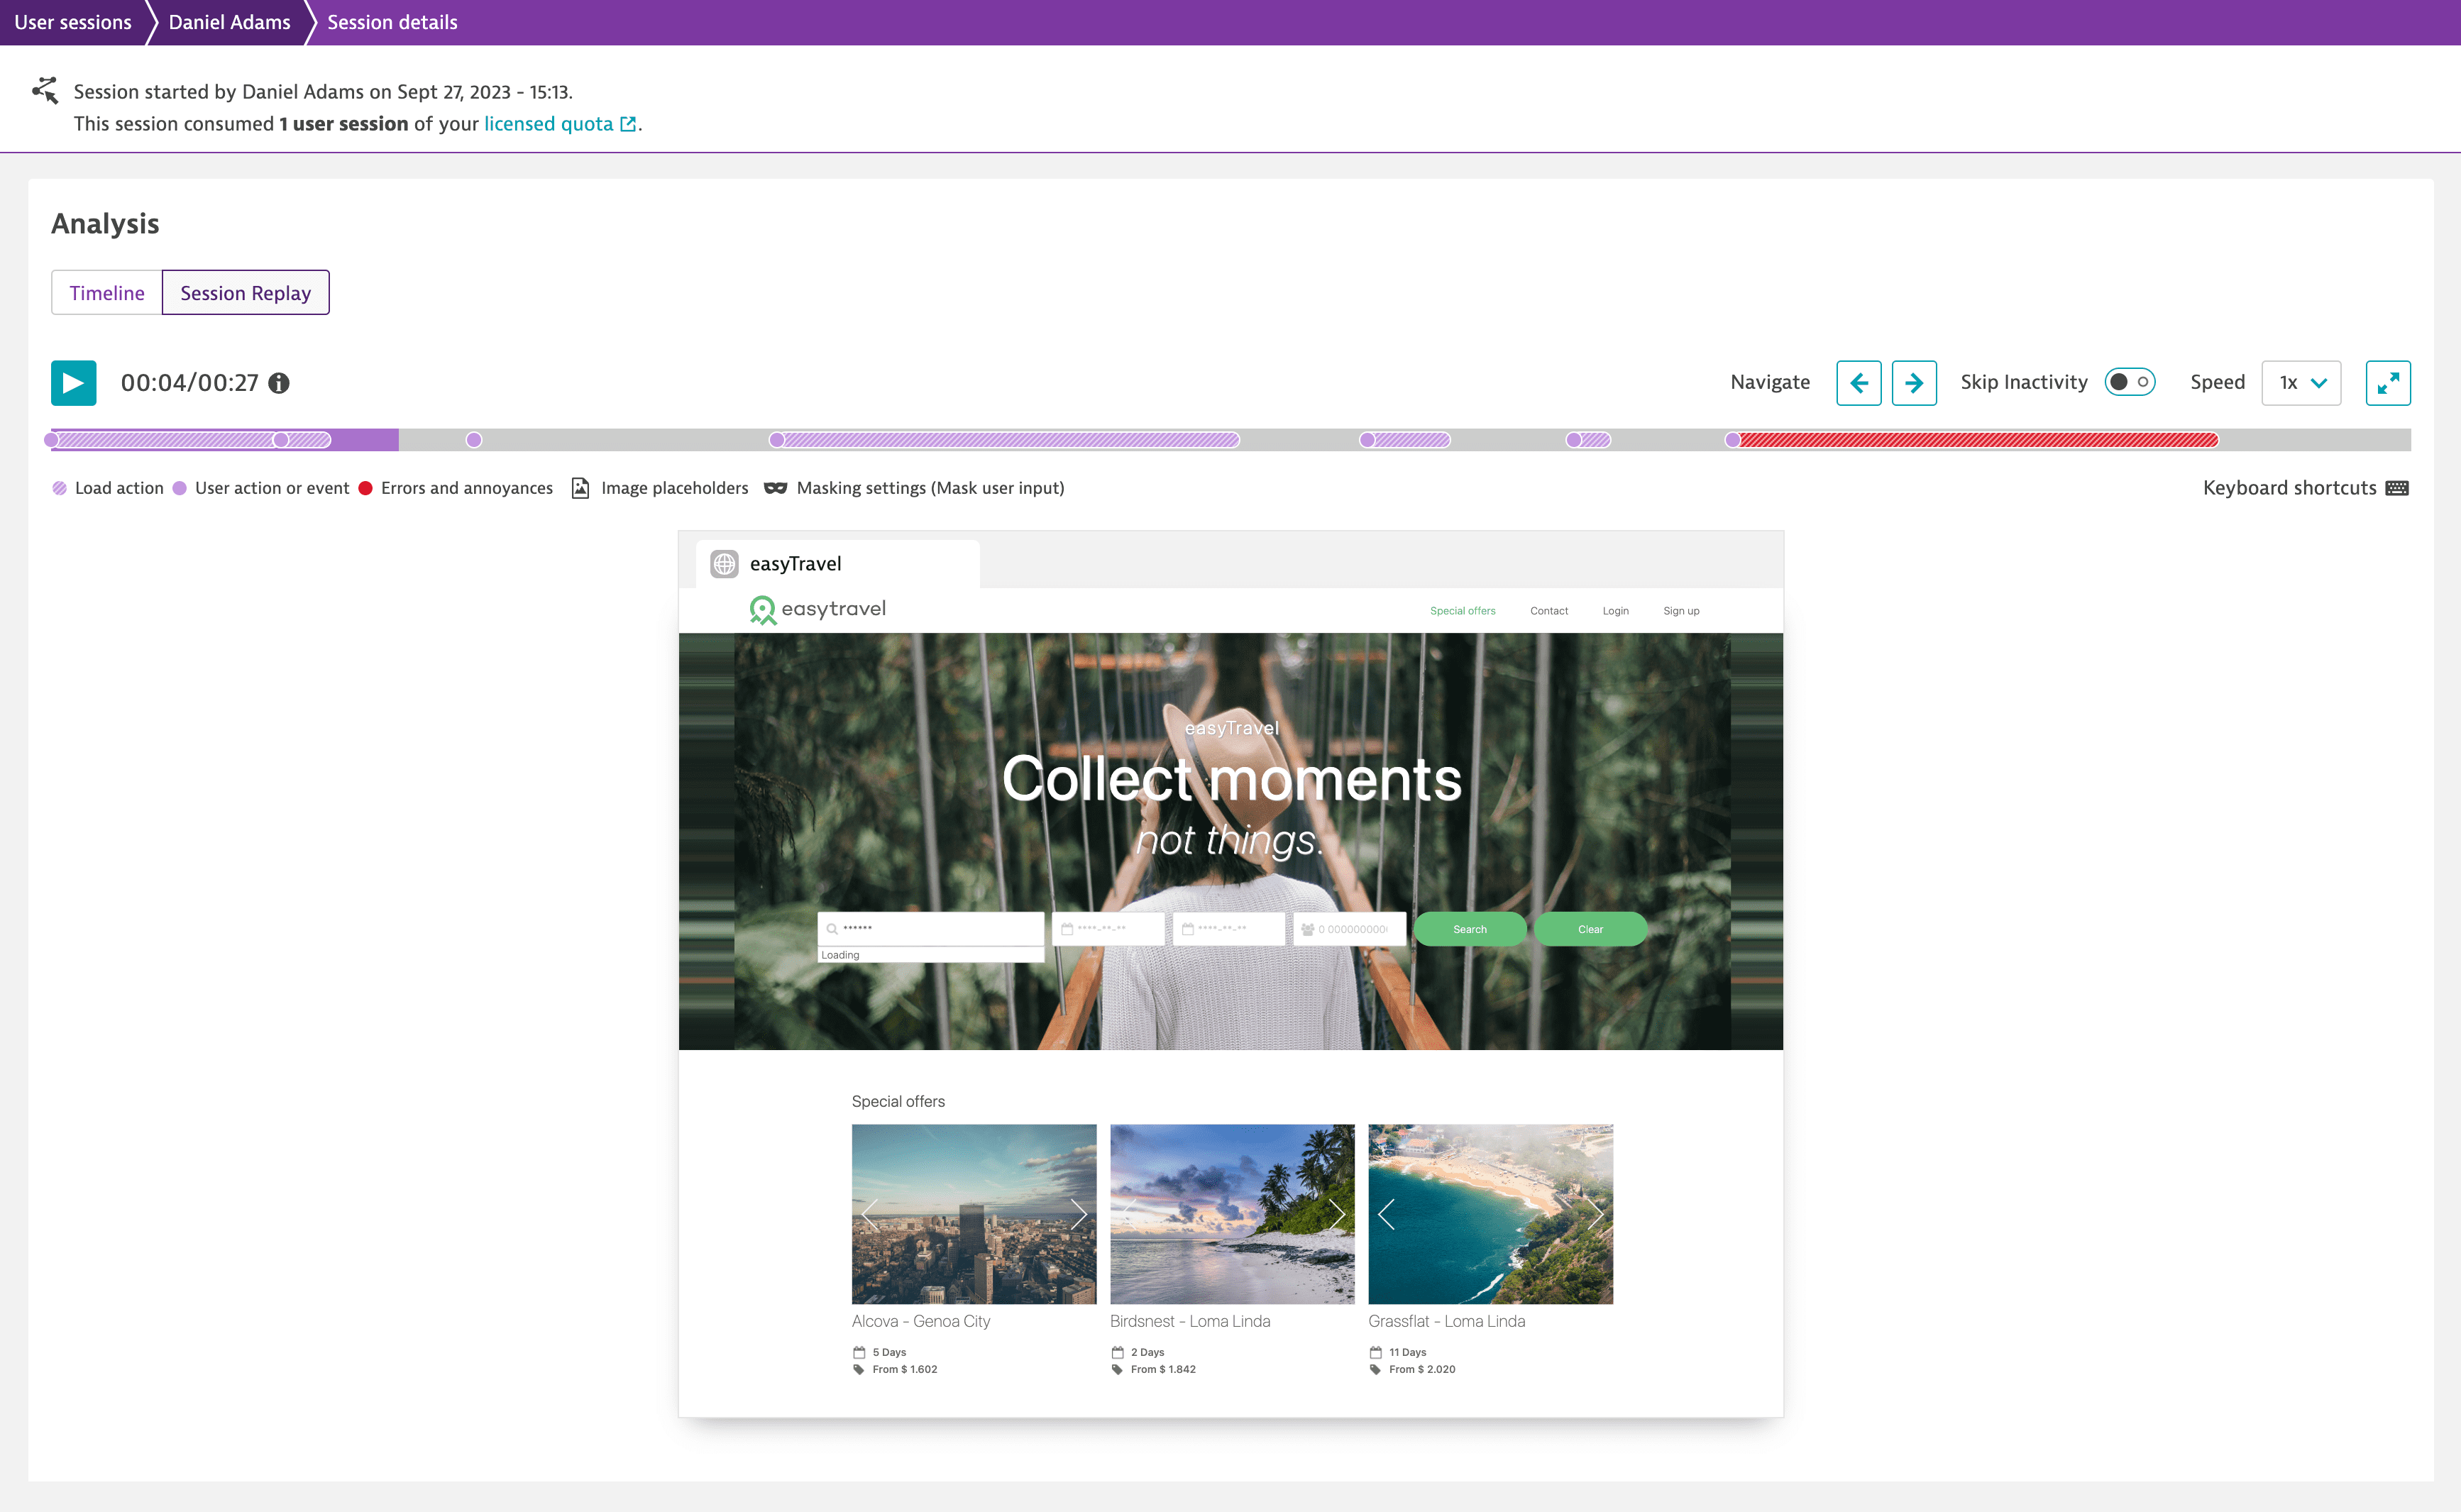
- On the session details page, in the Analysis section, go to the Session Replay tab.
- Select Play
, and watch the recording of the user session.
- Use the Session Replay controls to carefully examine the actions that the user performed in your application. Note that the errors are represented by red dots in the timeline.
Check request waterfall graphs
After watching the session recording, let's investigate the issue further using waterfall analysis and identify a specific request to blame.
Waterfall analysis proves to be invaluable in analyzing the performance of a user action and getting detailed information about various requests that comprise a user action. Waterfall graphs come in handy when you want to find a specific request that is responsible for failures or performance violations, while top findings streamline the captured data into easily understandable and actionable information, simplifying the troubleshooting process.
To view waterfall graphs for a user action
-
On the session details page, under Events and actions, find and expand the action that caused the trouble. Such an action is marked with a red line, and its Apdex rating is usually Frustrating.
-
In the lower-right corner of the action details, select Perform waterfall analysis to navigate to the action waterfall graphs.
-
On the action waterfall analysis page, study the available information.
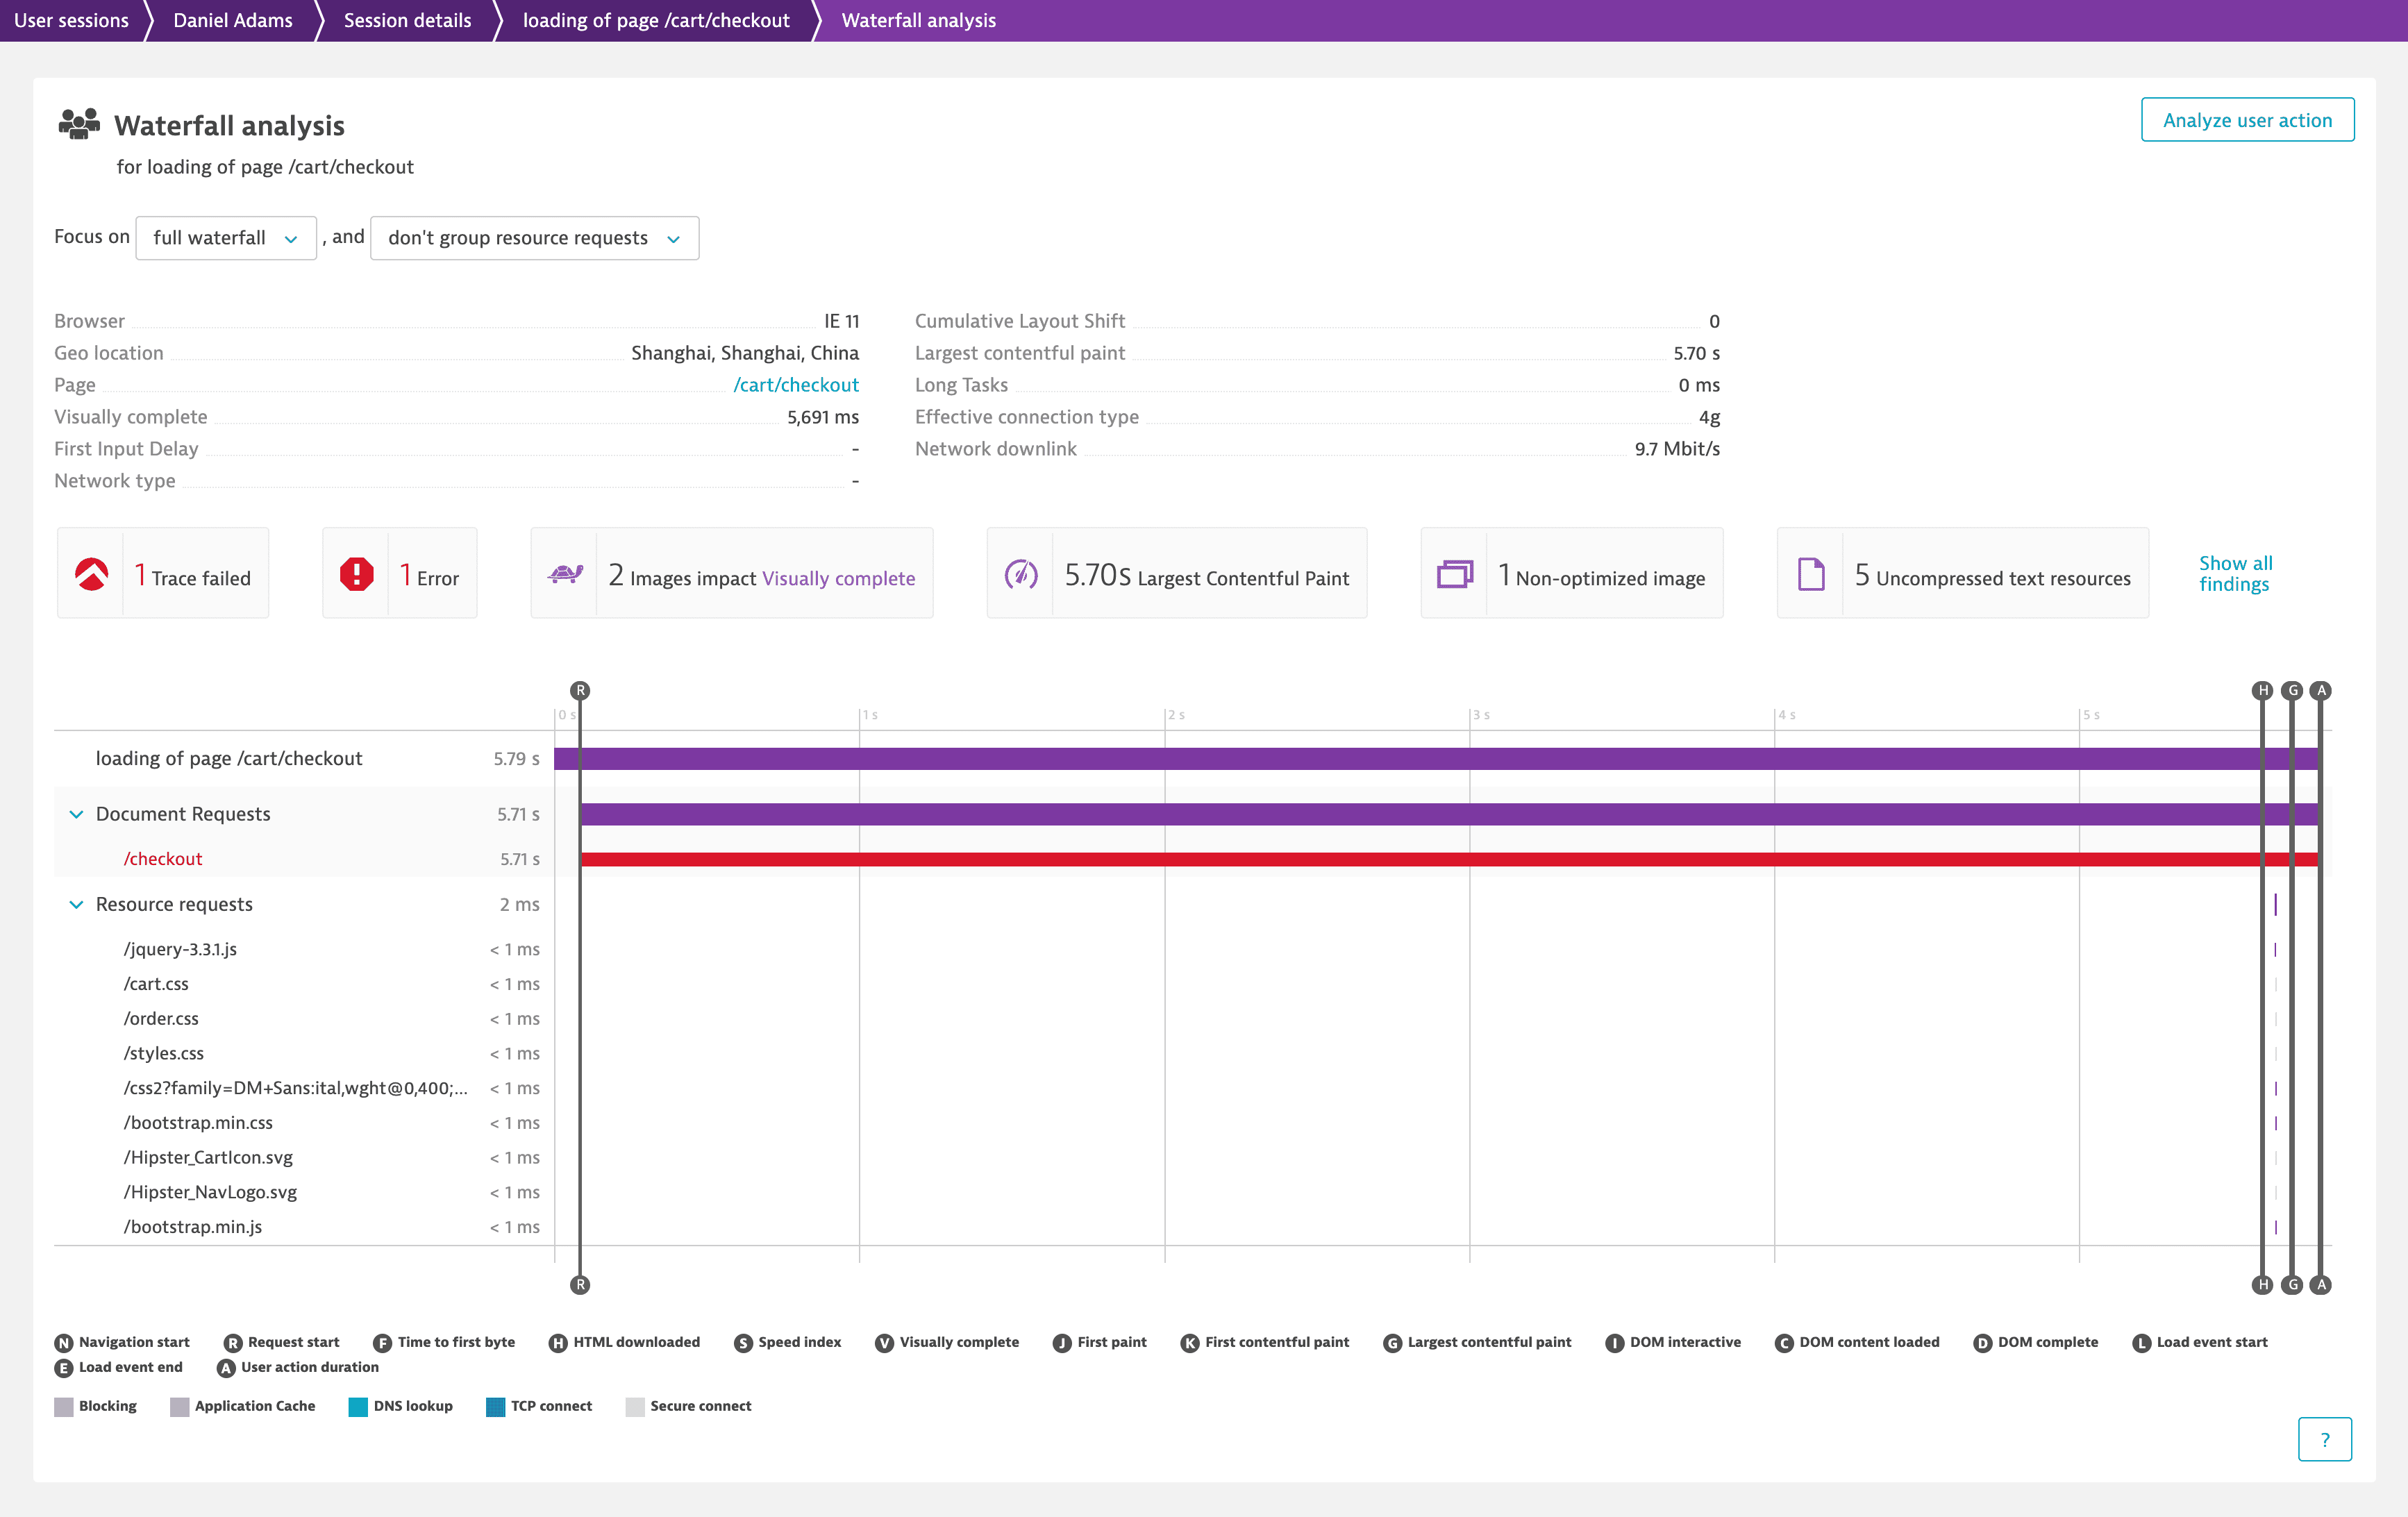
- Hover over the requests that happened during the action and check various user action metrics.
- Select Show all findings to view and analyze all of them at once.
- Select each finding to get additional information on it. When you select a finding, the associated requests and resources are highlighted in the waterfall.
-
Select the # Error finding. The associated erroneous requests and resources are highlighted in the waterfall.
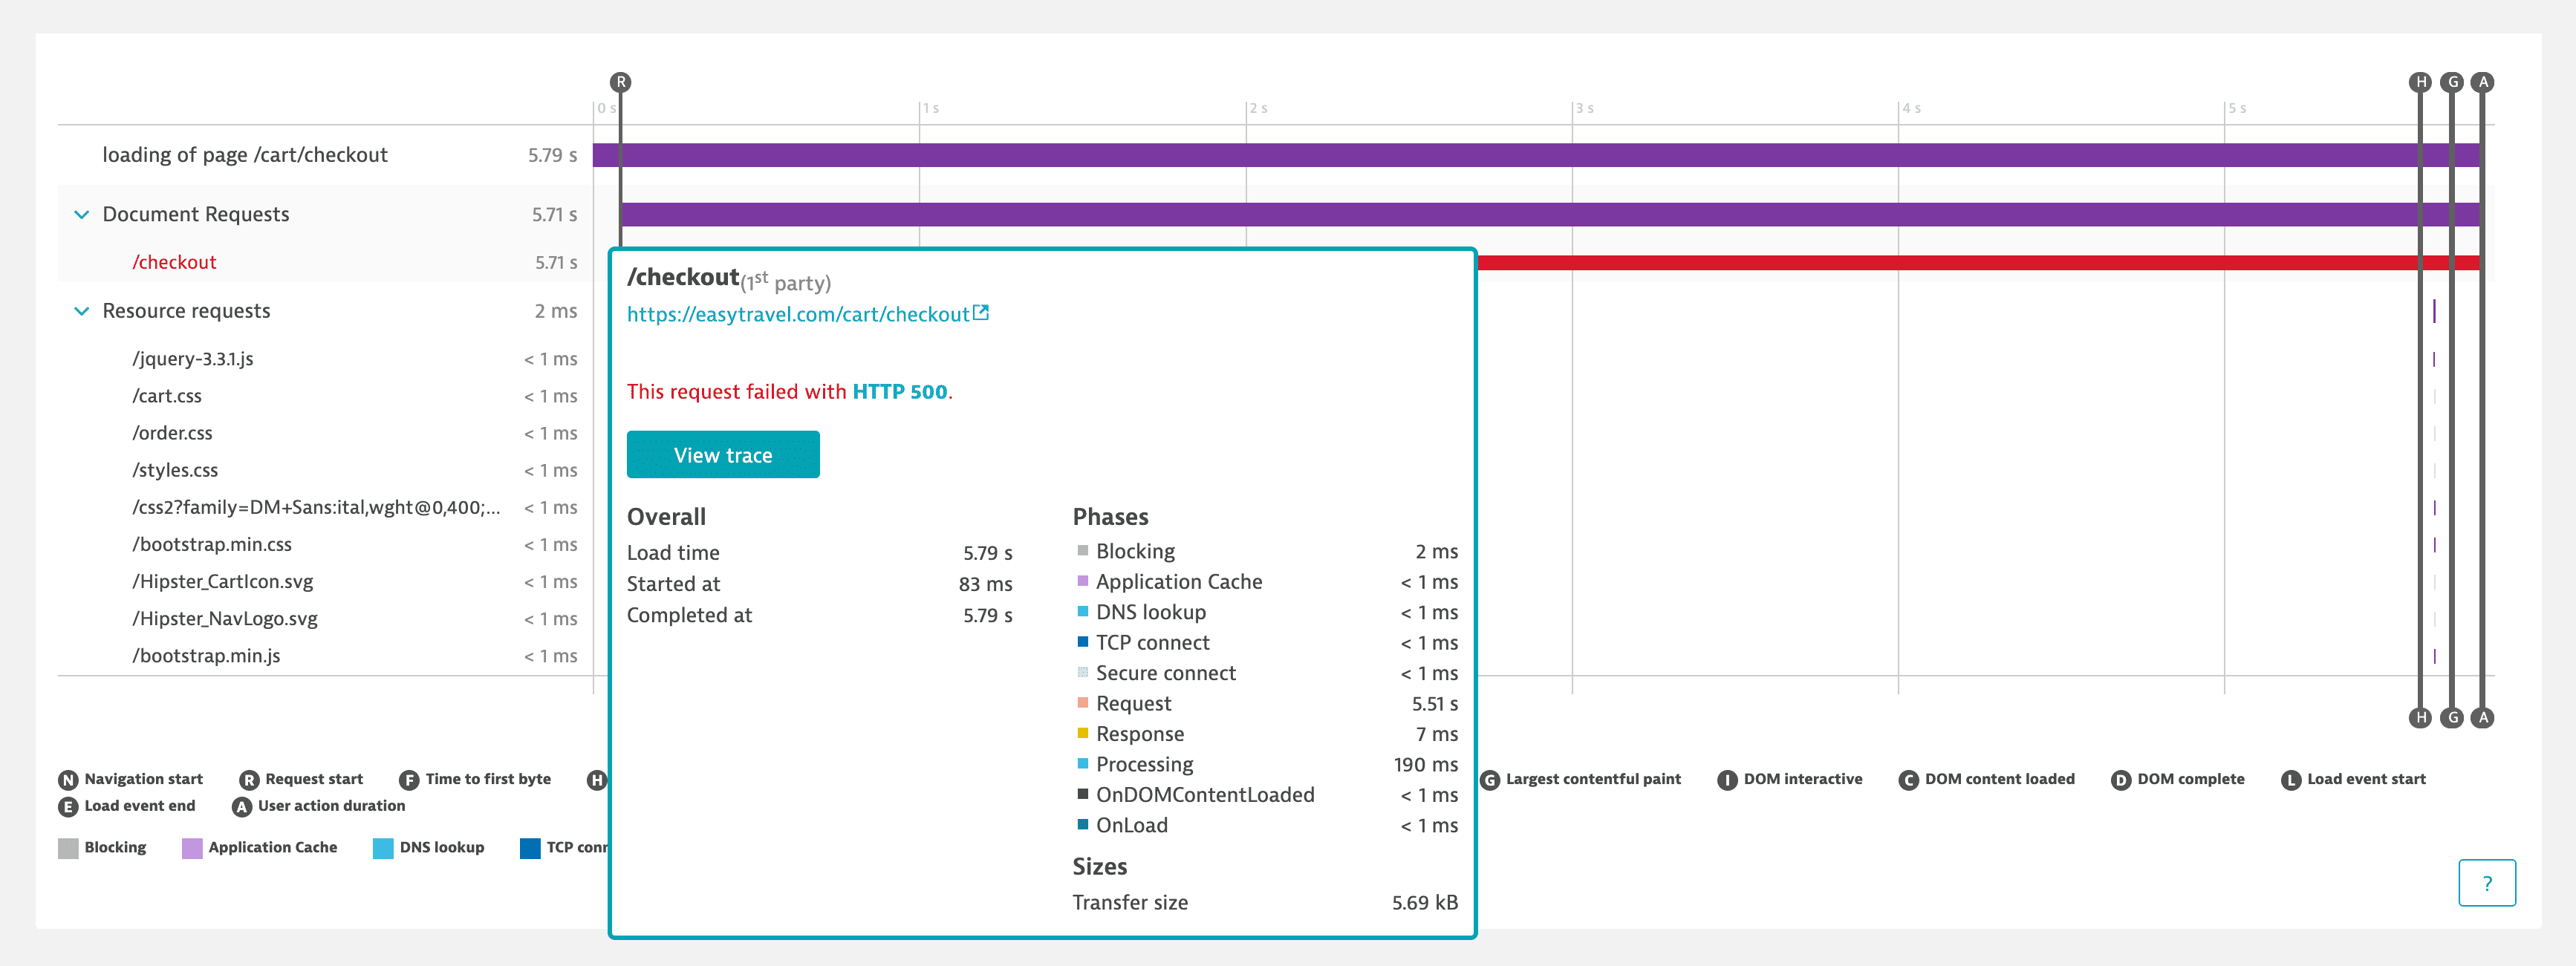
In our example, we've selected the 1 Error finding and learned that the /checkout request failed with the HTTP 500 error.
Explore distributed traces
After you've grasped the summary of the situation from the Waterfall analysis view, it's time to drill down to code-level information. Let's view the distributed traces of the failed request to investigate the timing, code-level context, and downstream call details.
PurePath® technology traces each web request through your application infrastructure, offering valuable insights into performance factors at the application level. For instance, if you see that one or two requests are consuming most of the action time, you can drill into the distributed trace to discern whether the issue stems from an abundance of database requests or a single slow one. With this data, you can enhance the application performance or conduct in-depth error analysis to optimize your system.
To view distributed traces of a request
- On the action waterfall analysis page, select the failed request, which is in red, and check the available details.
- Select View trace to navigate to the distributed traces page for that request.
- In the distributed traces list view, select a resource or request and drill down to the available details.
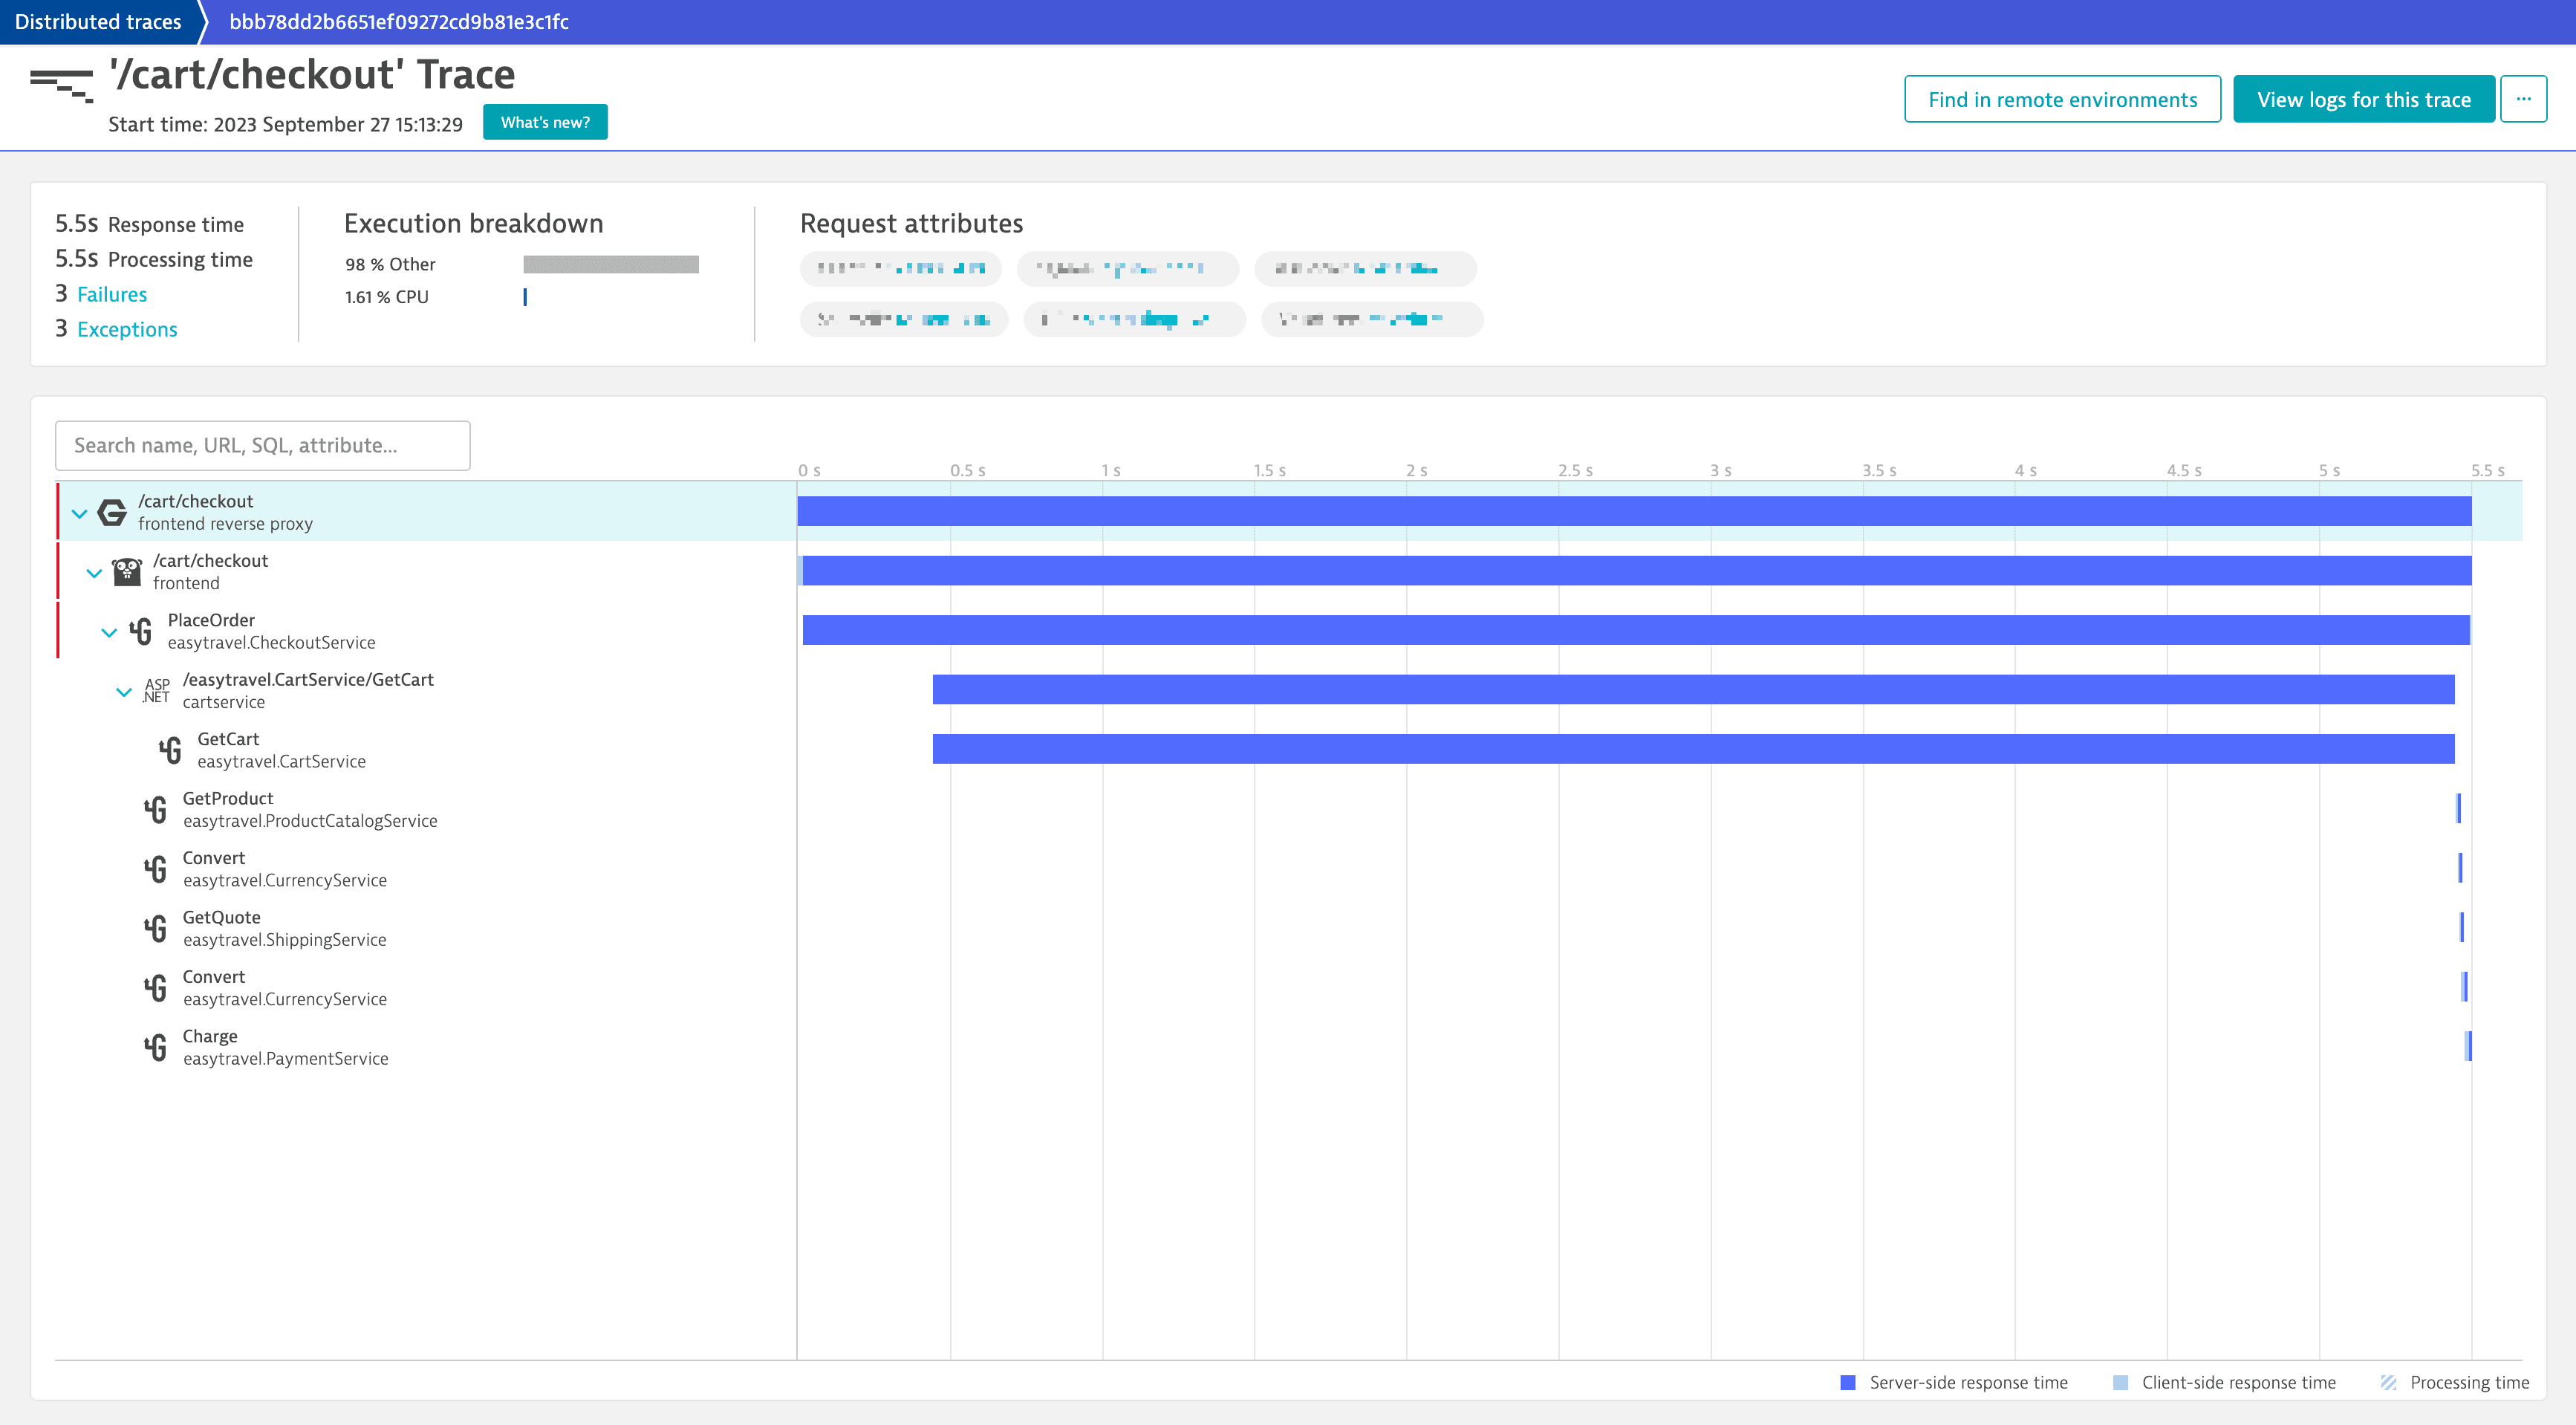
On the distributed traces page, you can check the response time, processing time, execution breakdown, and request attributes. When required, you can study the trace logs, view the failure details, or navigate to the Service flow or Service backtrace view.
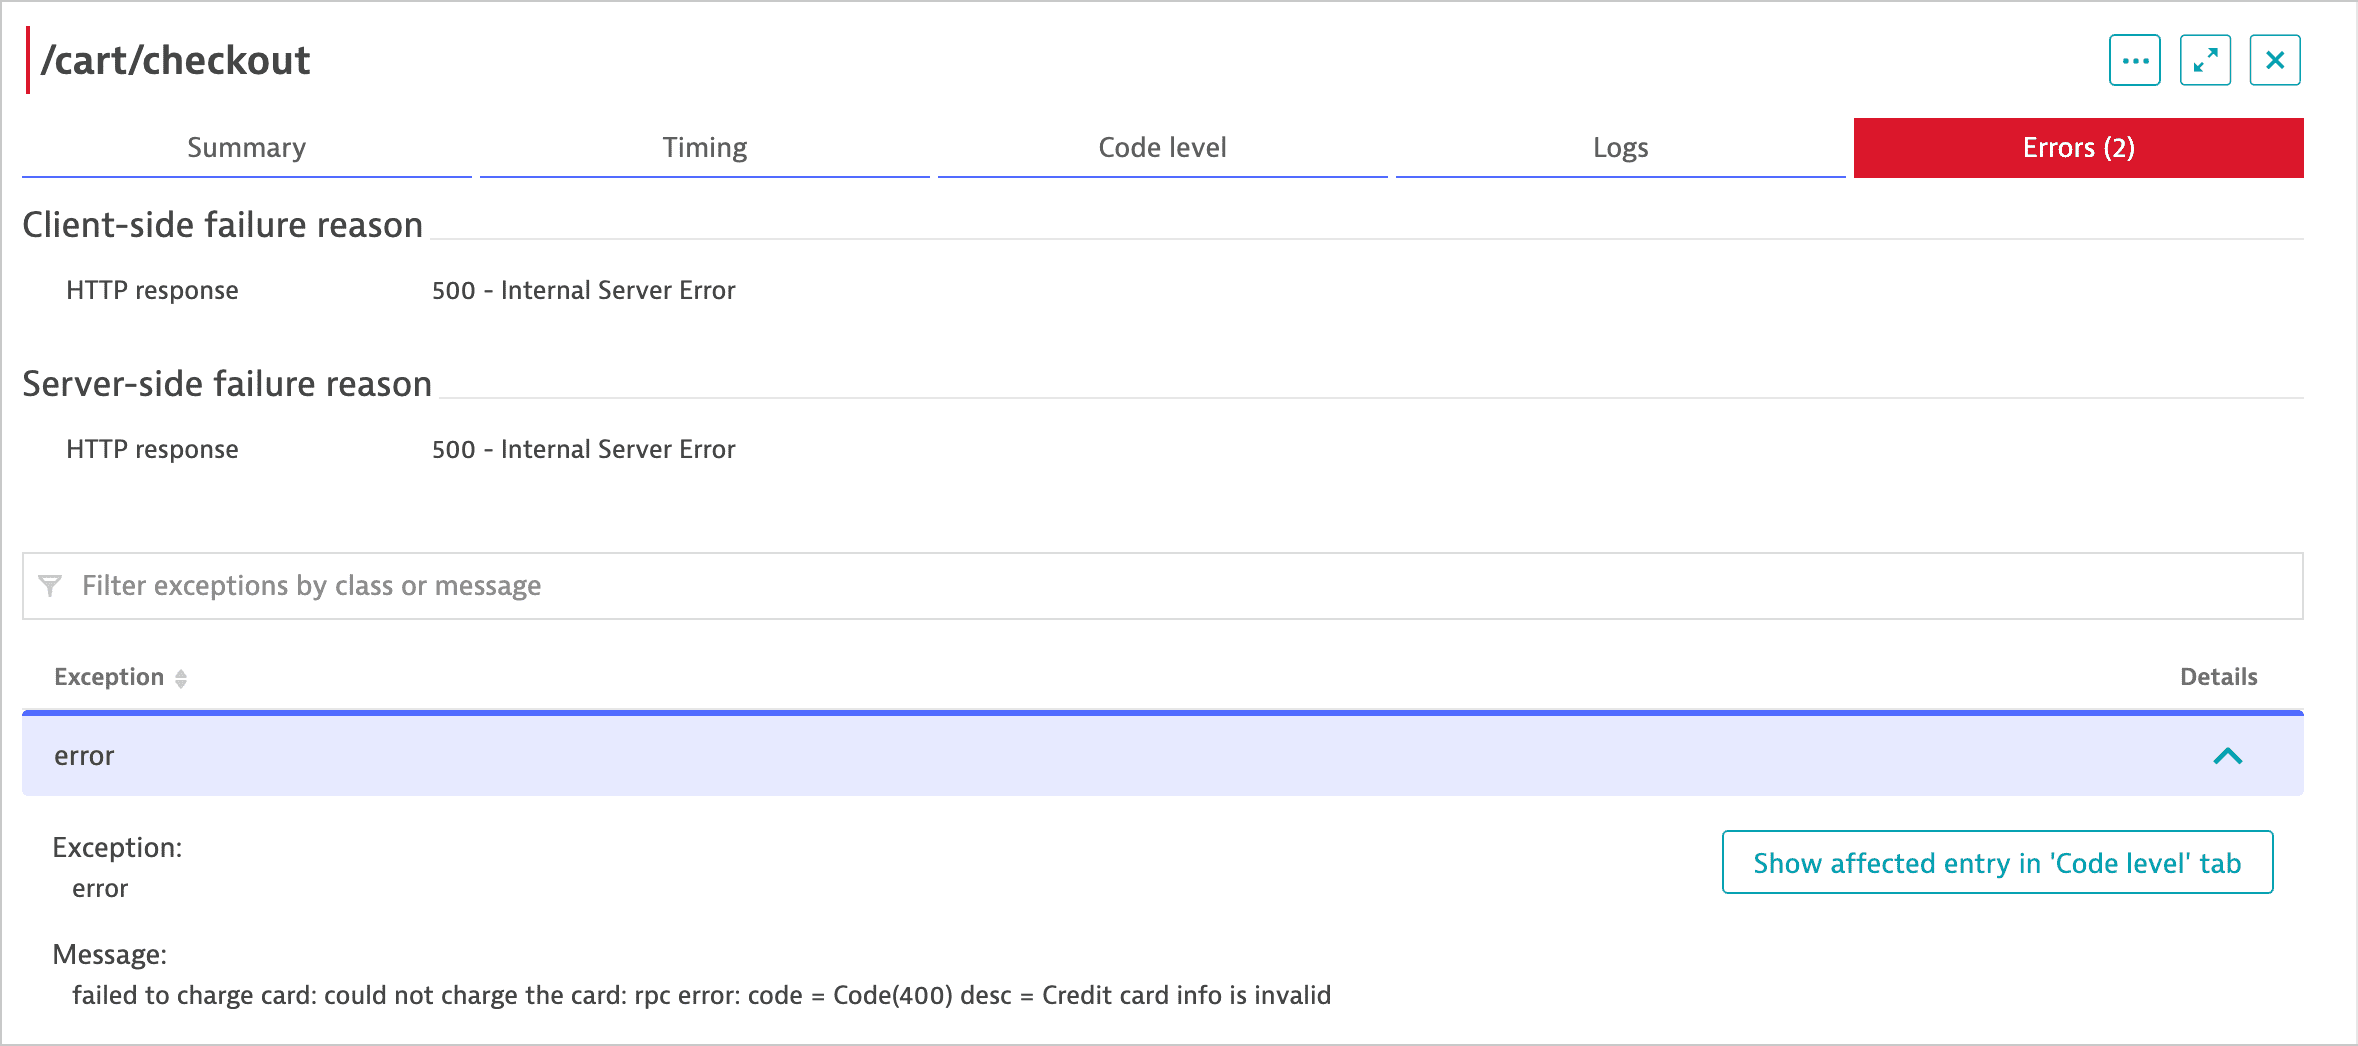
By checking the Logs and Errors tabs on the distributed traces page, we've finally found out that there was an issue with Daniel Adams's credit card: its details were invalid.
failed to charge card: could not charge the card: rpc error: code = Code(400) desc = Credit card info is invalid
Resolve the issue
Now that you know the whole story—what, when, and where—it's time to eliminate a problem that might have caused your client frustration. Whether it's a broken HTML tag, an outdated JavaScript code, or a user interface issue, your development team now knows where to start.