Business events end-to-end example
- Latest Dynatrace
- Tutorial
- 7-min read
This use case shows how your data can be captured, how a processing rule is set, and how this data can be further analyzed and visualized.
Target audience
This article is intended for business analysts and process managers who understand how their businesses are performing in real time and look for optimal execution of their business processes. You should have a basic knowledge of how business events are captured and some domain knowledge of the business area you are trying to analyze.
Scenario
EasyTrade is a simulated trading application with the following use cases:
- Money deposits and withdrawals
- Buy-assets and sell-assets transactions
- Basic dashboards for your trading activities
- Order a credit card
In this scenario, we suppose you need to calculate the total value of deposits placed on each account, the total and maximum dollar trading volume per account on EasyTrade, and the total value of buy-asset transactions per account in quick buy operations.
Before you begin
You need to determine:
- The processing logic and rules
- The data fields needed
Because you need to calculate the dollar trading volume, your processing rule should multiply the price by the amount and add the result as a new field to the event:
Dollar Trading Volume = Price * Amount
You also need to define the data items of the quick-buy-asset request. For example:
{"accountId":6,"amount":10,"instrumentId":1,"price":157.025}
Steps
1. Create a capture rule
-
Go to
 Settings app.
 -
Select Collect and capture > Business Events > Incoming.
-
Select Add new capture rule and set Rule name to
easyTrade- /v1/trade/buy. -
Select Add trigger and, in the Summary section, set the following:
- Data source:
Request - Path - Operator:
starts with - Value:
- /v1/trade/buy
- Data source:
-
Select again Add trigger and, in the Summary section, set the following:
- Data source:
Request – HTTP Method - Operator:
equals - Value:
POST
- Data source:
-
Define the Event provider:
- Data source:
Fixed value - Fixed value:
www.easytrade.com
- Data source:
-
Define the Event type:
- Data source:
Fixed value - Fixed value:
com.easytrade.quick-buyIf you need to add more event types, select Event type separately for each event type. In this case, the event types will also be
com.easytrade.andcom.easytrade.deposit.
- Data source:
-
Define the Event category:
- Data source:
Fixed value - Optional Fixed value: you can leave it blank in this case.
- Data source:
-
In the Event data section, you need to add four data fields.
For each data field:
-
Select Add data field.
-
Set the Field name, Source, and Path values according to the following table:
Field name
Source
Path
accountId
Request-Body
accountId
amount
Request-Body
amount
instrumentId
Request-Body
instrumentID
price
Request-Body
price
-
-
Select Save changes.
2. Create a data processing rule
To create your data processing rule
-
Go to
Settings > Process and contextualize > OpenPipeline. -
Select Business Events > Pipelines tab.
-
To create a new pipeline, select Pipeline and enter the name—
Process EasyTrade data. -
In the Processing tab, select Processor > DQL and name your processor
EasyTrade trade volume. -
Set your rule's Matching condition to the following matcher-specific DQL query:
matchesValue(event.provider, "www.easytrade.com")1. Details
- If you needed to add only one event type (for example,
com.easytrade.buy-assets), the matcher would be:matchesValue(event.type, "com.easytrade.buy-assets") - For two event types within the same event provider, the matcher would be:
matchesValue(event.type, "com.easytrade.buy-assets") or matchesValue(event.type, "com.easytrade.sell-assets")
- In this use case, however, you need to take all event types under the EasyTrade event provider, so it's sufficient to use:
matchesValue(event.provider, "www.easytrade.com")
- If you needed to add only one event type (for example,
-
In the DQL processor definition field, add
fieldsAdd trade_volume=amount*price -
Select Save.
-
To create a new route, go to the Dynamic routing tab > Dynamic route and specify:
- A descriptive name for your new dynamic route
- The Matching condition to be:
matchesValue(event.provider, "www.easytrade.com")
-
Select the
Process EasyTrade datapipeline, where the business events will be routed. -
Select Add, then Save. Note: Any rule put under Dynamic routing in
Process EasyTrade datapipeline will process data under the same matching condition.
3. Add business event metric
To add your business event metric
-
Go to
Settings > Process and contextualize > OpenPipeline. -
Select Business Events > Pipelines tab.
-
Select the previously created
Process EasyTrade datapipeline. -
Go to the Metric Extraction tab.
-
Select Processor > Value metric and name it
bizevents.EasyTrade.TradingVolume. -
Add Matching condition to your rule by pasting your matcher-specific DQL query:
matchesValue(event.type, "com.easyTrade.quick-buy") -
Choose the Field extraction on which your metric will be based—add
trading_volume. -
In Metric key, name your metric
bizevents.EasyTrade.TradingVolume. -
You can also choose Dimensions, either Pre-defined, for example
dt.entity.host, or Custom. -
Select Save.
To display your metrics
-
Go to
 Notebooks.
 -
Select Notebook and name it
Notebook for business analytics metrics. -
To open the metrics query builder, add a new section and select Metrics.
-
Find your metric in the search window, select Run, and display your results.
You can also:
- Pin the metric to a dashboard
- Export your data to a CSV file
- Share a link
- Copy the DQL query
- Use Davis AI to analyze the times series to detect anomalies or do a forecasting
4. Choose the retention period
If you need to store your data for one year, for example, for tax purposes, first you need to create a bucket for bizevents with a one year retention period.
- Go to Settings app.
- Select Storage management > Bucket storage management.
- Select Bucket and name the bucket with a unique identifier—
easytrade-bizevents. - Add the Display name
EasyTrade bizevents. - Define the retention period for 365 days.
- For Bucket table type choose
bizevents. - Select Create.
After creating the bucket, you need to define the rules to store the incoming bizevents in that bucket.
- Go to Settings > Process and contextualize > OpenPipeline.
- Select Business Events > Pipelines tab.
- Select
Process Easytrade datafrom the pipelines list. - Go to the Storage tab, select Processor > Bucket assignment.
- Name it
Easytrade data bucket assignment. - Define Matching condition as
true(since the routed bizevents all belong to theEasyTrade data). - Set Storage to
EasyTrade bizevents. - Select Save.
5. Test your results
To see if your data was captured correctly
-
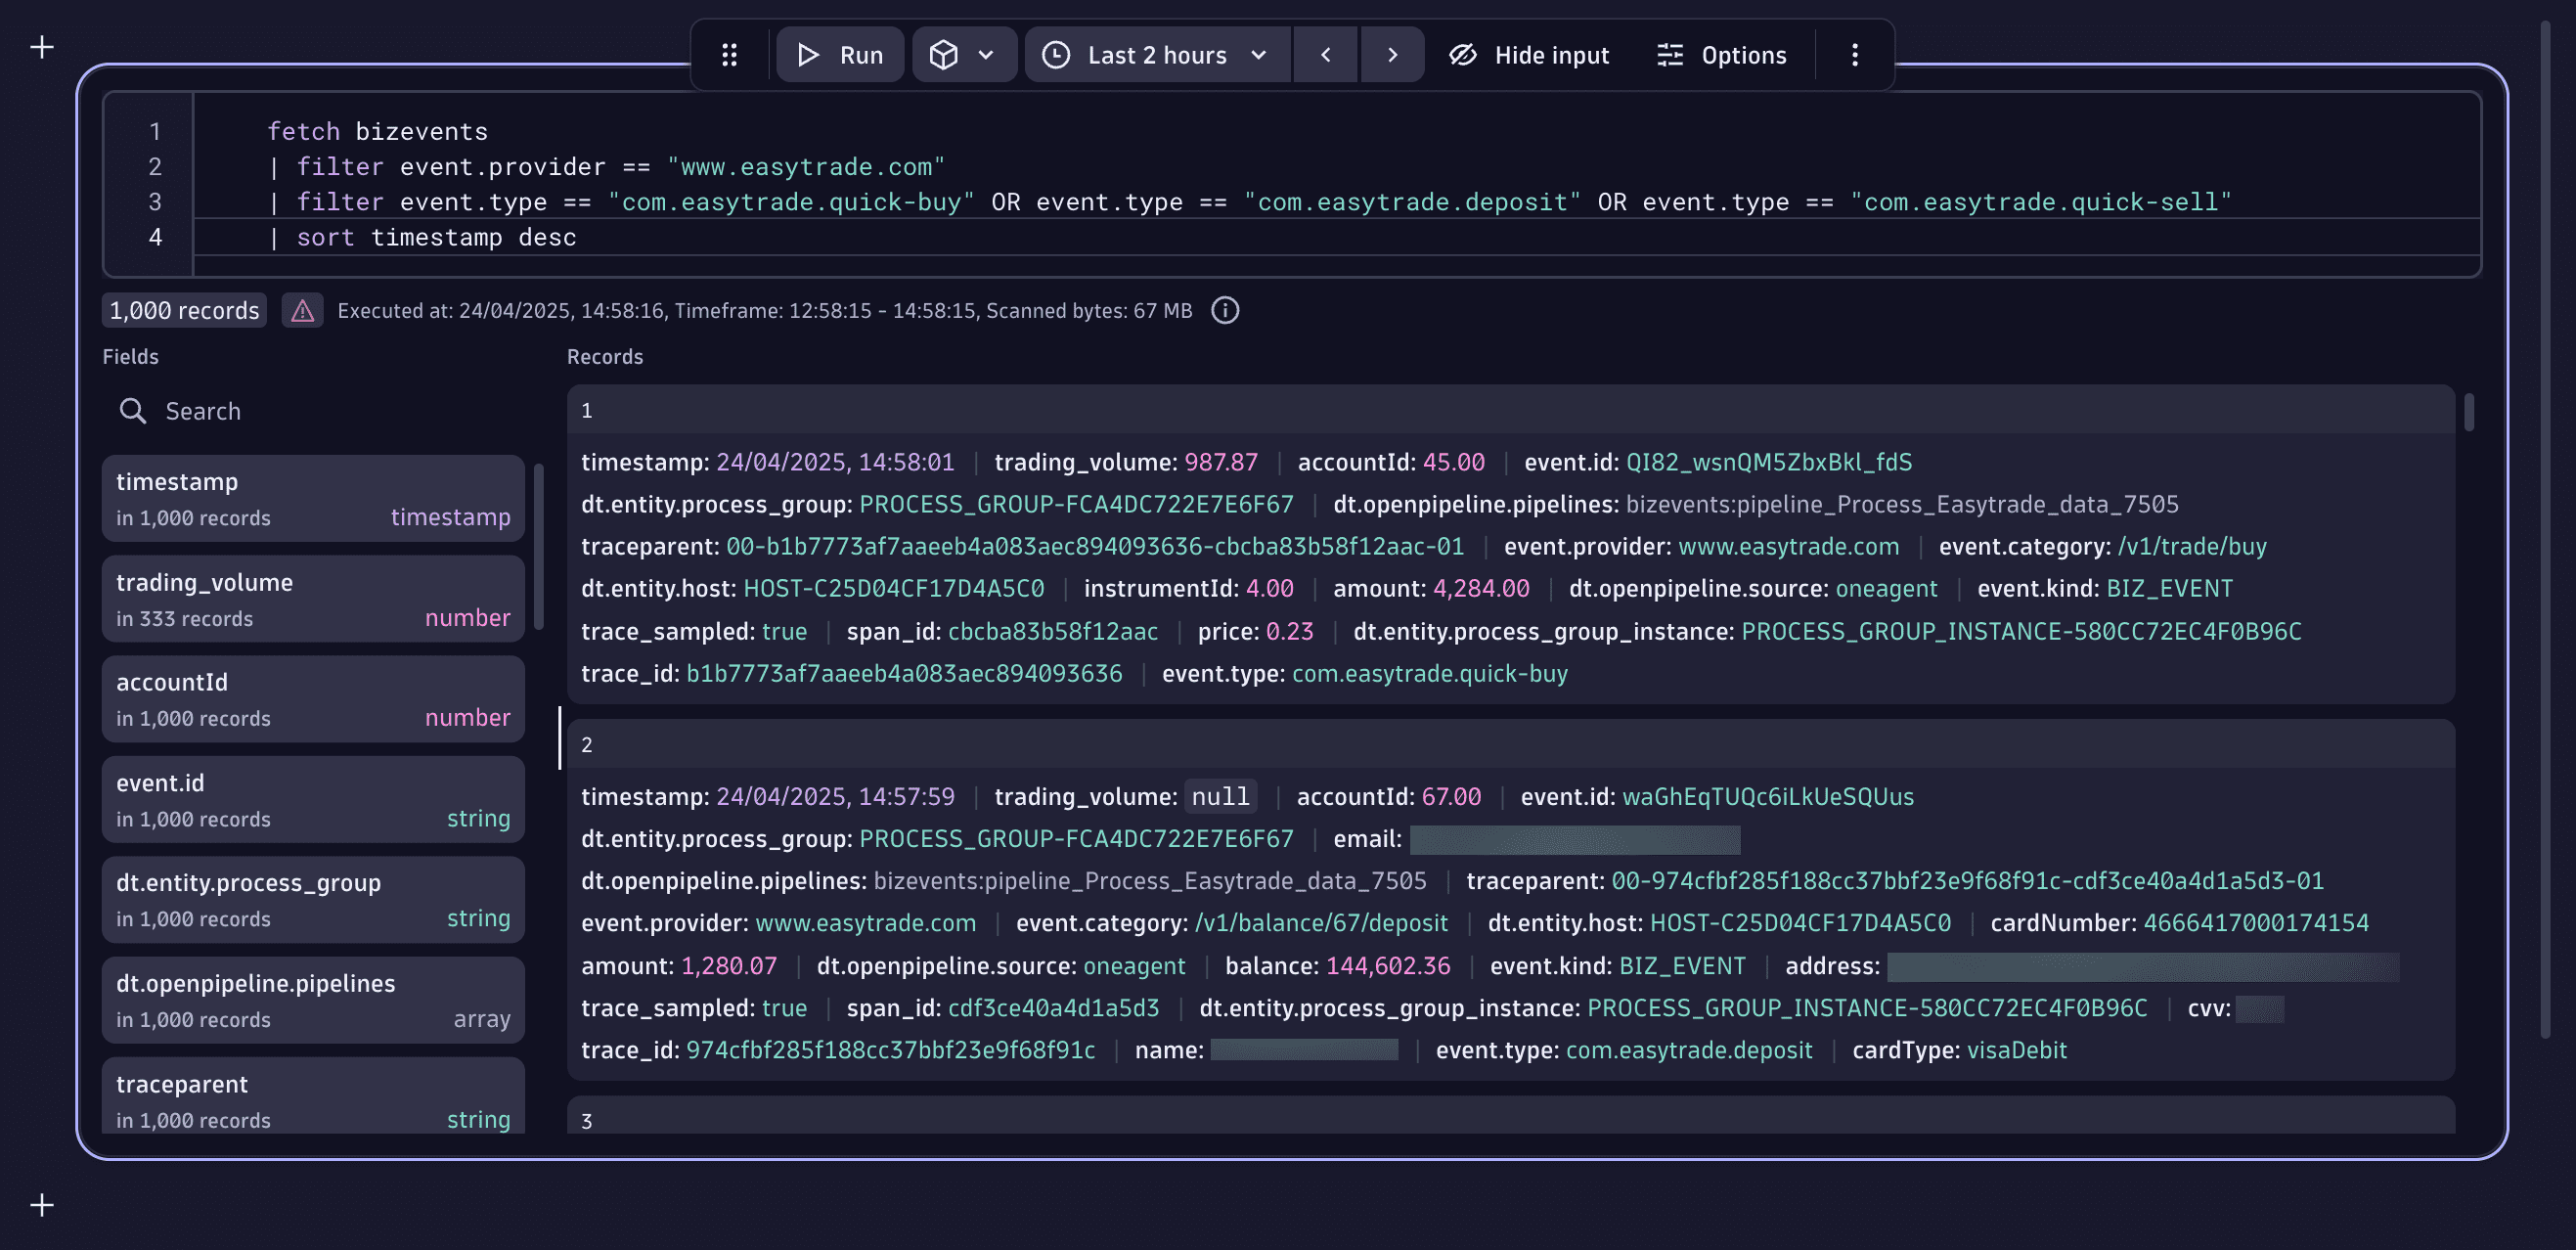
Select Run in Playground below this query:
fetch bizevents| filter event.provider == "www.easytrade.com"| filter event.type == "com.easytrade.quick-buy" OR event.type == "com.easytrade.deposit" OR event.type == "com.easytrade.quick-sell"| sort timestamp desc -
Select New notebook and the query will run itself automatically.
You should get results something like the following:
6. Analyze your data with DQL
At this point, you can start building your DQL queries to analyze the data loaded, define metrics, and create charts and dashboards.
You need to calculate:
- The total value of deposits per account in the last 30 days
- The total value of buy-asset transactions per account in the last 30 days
- The total and maximum dollar trading volume per account in the last 30 days
To analyze your data using DQL, select Run in Playground below this query:
fetch bizevents, from:now()-30d, to:now()| filter event.provider == "www.easytrade.com" and (event.type == "com.easytrade.quick-buy" OR event.type == "com.easytrade.deposit" OR event.type == "com.easytrade.quick-sell")| fieldsAdd moneyTransfered = if(event.type == "com.easytrade.deposit", toDouble(amount)),buyAssets = if(event.type == "com.easytrade.quick-buy", toDouble(amount)),trading_volume= if(event.type == "com.easytrade.quick-sell",(amount*price))| summarize sum(moneyTransfered), sum(buyAssets), sum(trading_volume), max(trading_volume), by:accountId
Results table:
accountid
max(trading_volume)
sum(buyAssets)
sum(moneyTransfered)
sum(trading_volume)
6
19924.3187495
609491
1340160.809059129
526623.1340707905
7
47827.65870614
593648
1287203.0690401047
922284.0555854205
8
16718.08125
615123
1288892.9309932007
550042.8770441795
7. Display your results
You can display your results in several ways, including the following options.
-
As a bar chart in
Notebooks, limiting the result to the top 10 with maximum money transfer.- Select Options.
- In the right-side panel, select the Bar type of visualization.
-
On a dashboard tile
To pin your results to a dashboard in
Notebooks- Select > Open with.
- Select
 Dashboards.
 - Decide whether you want to open it with a new dashboard or an existing one.
 Explore Business Events