Live Debugger
- Latest Dynatrace
- App
- 8-min read
 Live Debugger is a cloud native, live data collection app that gives you instant access to the code-level data you need to troubleshoot and debug quickly in any environment, from development to production.
- Access the necessary and relevant data without adding additional code, waiting for redeployment, or attempting to reproduce issues locally.
- Using non-breaking breakpoints, instantly see the complete state of your application, including stack trace, variable values, and more, all without stopping or breaking your running code.
Prerequisites
- Dynatrace SaaS environment with a Dynatrace Platform Subscription (DPS) that includes Code Monitoring
- OneAgent version 1.309+ with Java Live-Debugger and Node.js Live-Debugger OneAgent features enabled
- Monitoring modes: Full-Stack, Infrastructure, or Discovery (with container code-module injection)
- Code modules: Java and Node.js
Get started
Activate the Live Debugger feature
To activate the Live Debugger feature
- Go to
 Settings > Collect and capture > General monitoring settings > OneAgent features.
 - Turn on Java Live-Debugger, Node.js Live-Debugger, or both, depending on your needs.
- Restart any process that is affected.
Enable Observability for Developers
To use Live Debugger, you need to opt-in to Observability for Developers. You can enable it for specific process groups, Kubernetes namespaces, clusters, or the entire environment.
Environment level
- Go to Settings > Collect and capture > Observability for Developers > Enable Observability for Developers.
- Turn on Enable Observability for Developers.
Process group level
- Go to Technologies & Processes Classic.
- Select the category and then the required process group.
- On the process group overview page, select Settings.
- Go to Observability for Developers > Enable Observability for Developers.
- Turn on Enable Observability for Developers.
Kubernetes namespaces and clusters level
- Go to
") Kubernetes.
Kubernetes. - Select the required namespace or cluster.
- In the upper-right corner, select > Connection settings or, if not available, Anomaly detection settings.
- Close the Kubernetes namespace anomaly detection or Connection settings overlay. You should see the namespace or cluster settings page.
- Go to Collect and capture > Observability for Developers > Enable Observability for Developers.
- Turn on Enable Observability for Developers.
Enable Live Debugging in ActiveGate
ActiveGate version 1.311+
An ActiveGate isn't strictly required for Live Debugger to work, but it significantly streamlines the process, especially in Kubernetes environments. It allows you to reduce your interaction with Dynatrace to one single point, which is available locally. Besides convenience, this solution optimizes traffic volume and reduces the complexity of the network and cost.
Host-based deployments
The Live Debugger module is enabled by default for host-based ActiveGate deployments starting from ActiveGate version 1.311.
Kubernetes Operator deployments
For Kubernetes Operator deployments, enable the Live Debugger module via the ActiveGate capabilities section in the DynaKube configuration.
To enable the Live Debugger module
-
Set
debuggingcapability in theDynaKube.yamlfile.activeGate:capabilities:- debugging
If you're using a proxy, configure it within the Environment ActiveGate as described in Proxy for ActiveGate.
Start live debugging an application
To start a live debugging session
- Go to Live Debugger.
- Select (Debug Configuration) under the app header to open the Customize your debug session overlay.
- Scope the instances you would like to debug.
- Add one or more filters from the facets list.
- Choose a filter within the application properties.
Fetch source code
Each debug session must contain the application source code you're about to debug. Live Debugger lets you quickly load sources from your local file system and various Git providers. When you integrate your source code into Live Debugger, it remains between your code repository and your local browser.
There are two main ways to import your source code:
- Automatic fetching
- Manual fetching
Automatic fetching
Live Debugger can connect to a repository and automatically fetch the source code for the selected instance.
Your repository can be automatically fetched for the selected instance based on your Git permissions if your admin has already set it up.
To learn more about automatic fetching, see Integrate with your version control.
Manual fetching
Live Debugger lets you easily load your relevant source code into the application. Select under Source Code to open a list of the supported Git providers from which you can fetch sources.
Git on-premises integration
Live Debugger integrates directly with the cloud editions of the following Git providers, both on-premises and SaaS:
- GitHub
- Bitbucket
- GitLab
- Azure DevOps
To enable Live Debugger to integrate with your on-premises or locally hosted Git provider
- Go to Settings > Apps > Git On-Premise Servers.
- Select Add item.
- Git Provider: Specify your Git provider.
- Server URL: Provide your server's HTTP/HTTPS URL.
- Select Save and close.
To use Bitbucket On-Premises, install the Dynatrace Desktop app.
Local file system
Live Debugger includes a desktop application (Dynatrace Desktop app) that can access source repositories from your local file system. This allows you to fetch source code from locally hosted Git providers.
Windows: Versions 7, 8, and 8.1 aren't supported. MacOS: All versions are supported.
- Under Source Code, select > Local Filesystem.
- Select Download desktop app to get the installation file for the Dynatrace Desktop app.
- Install the app according to the instructions in your operating system.
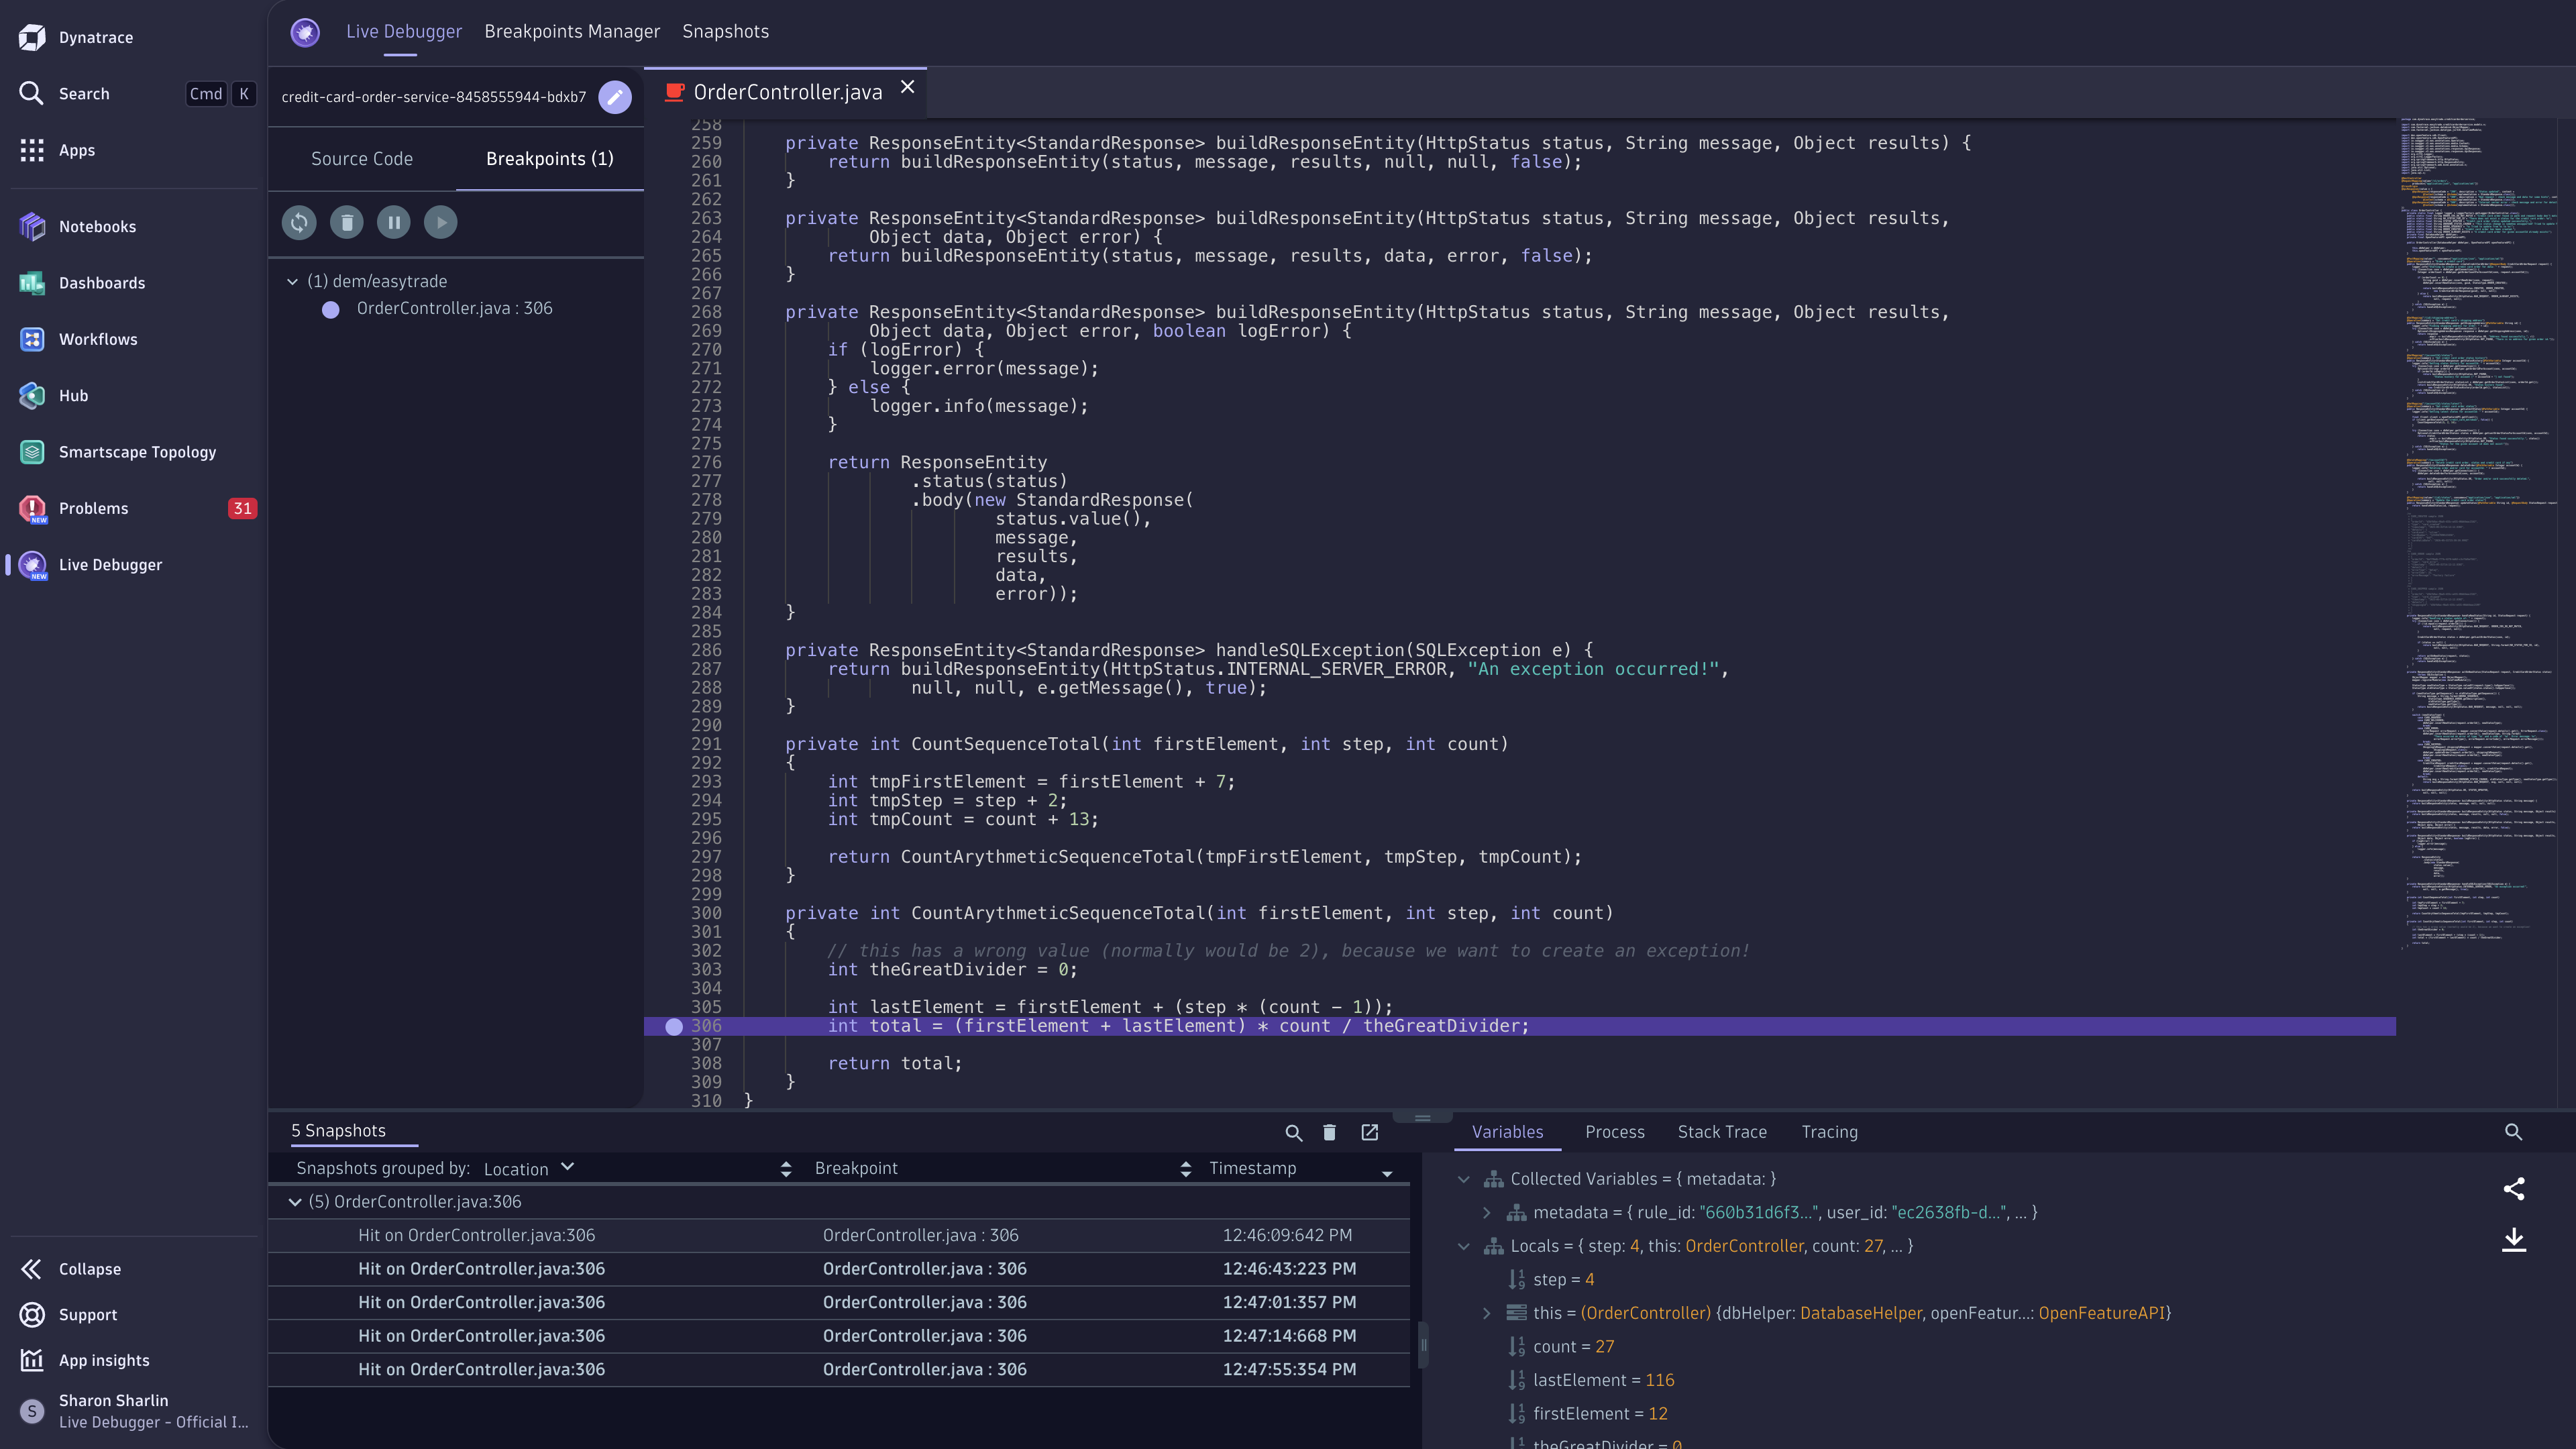
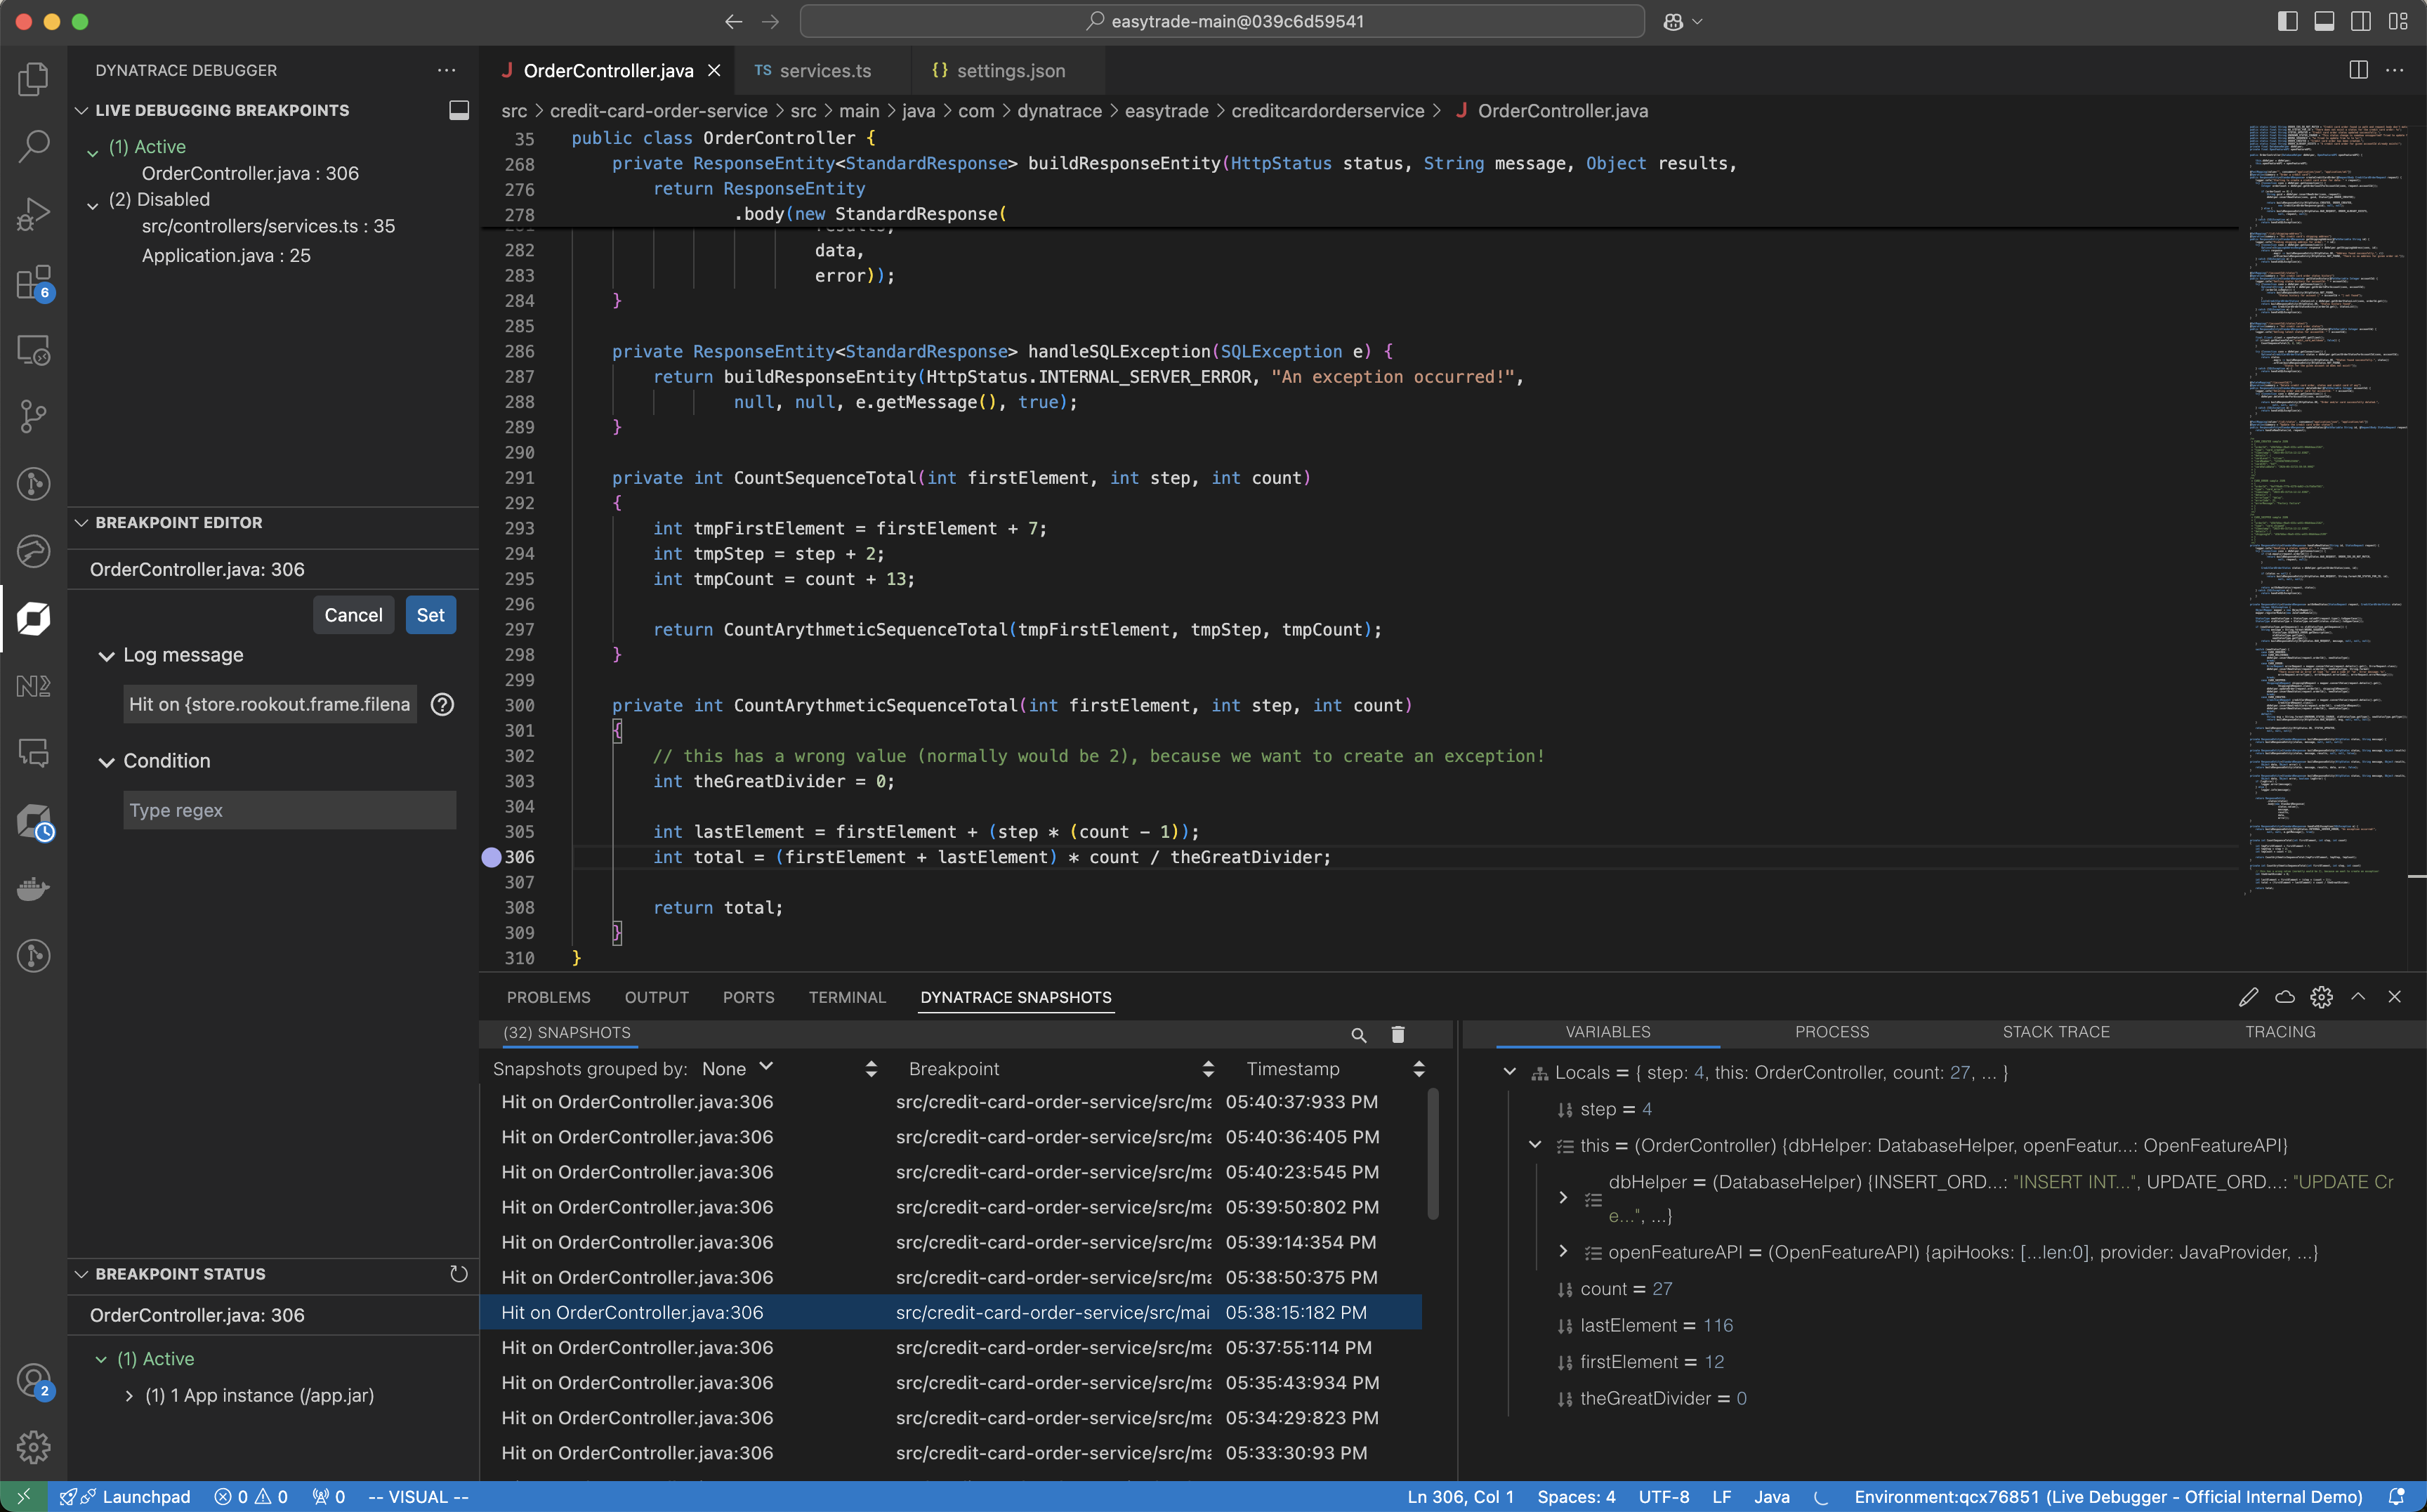
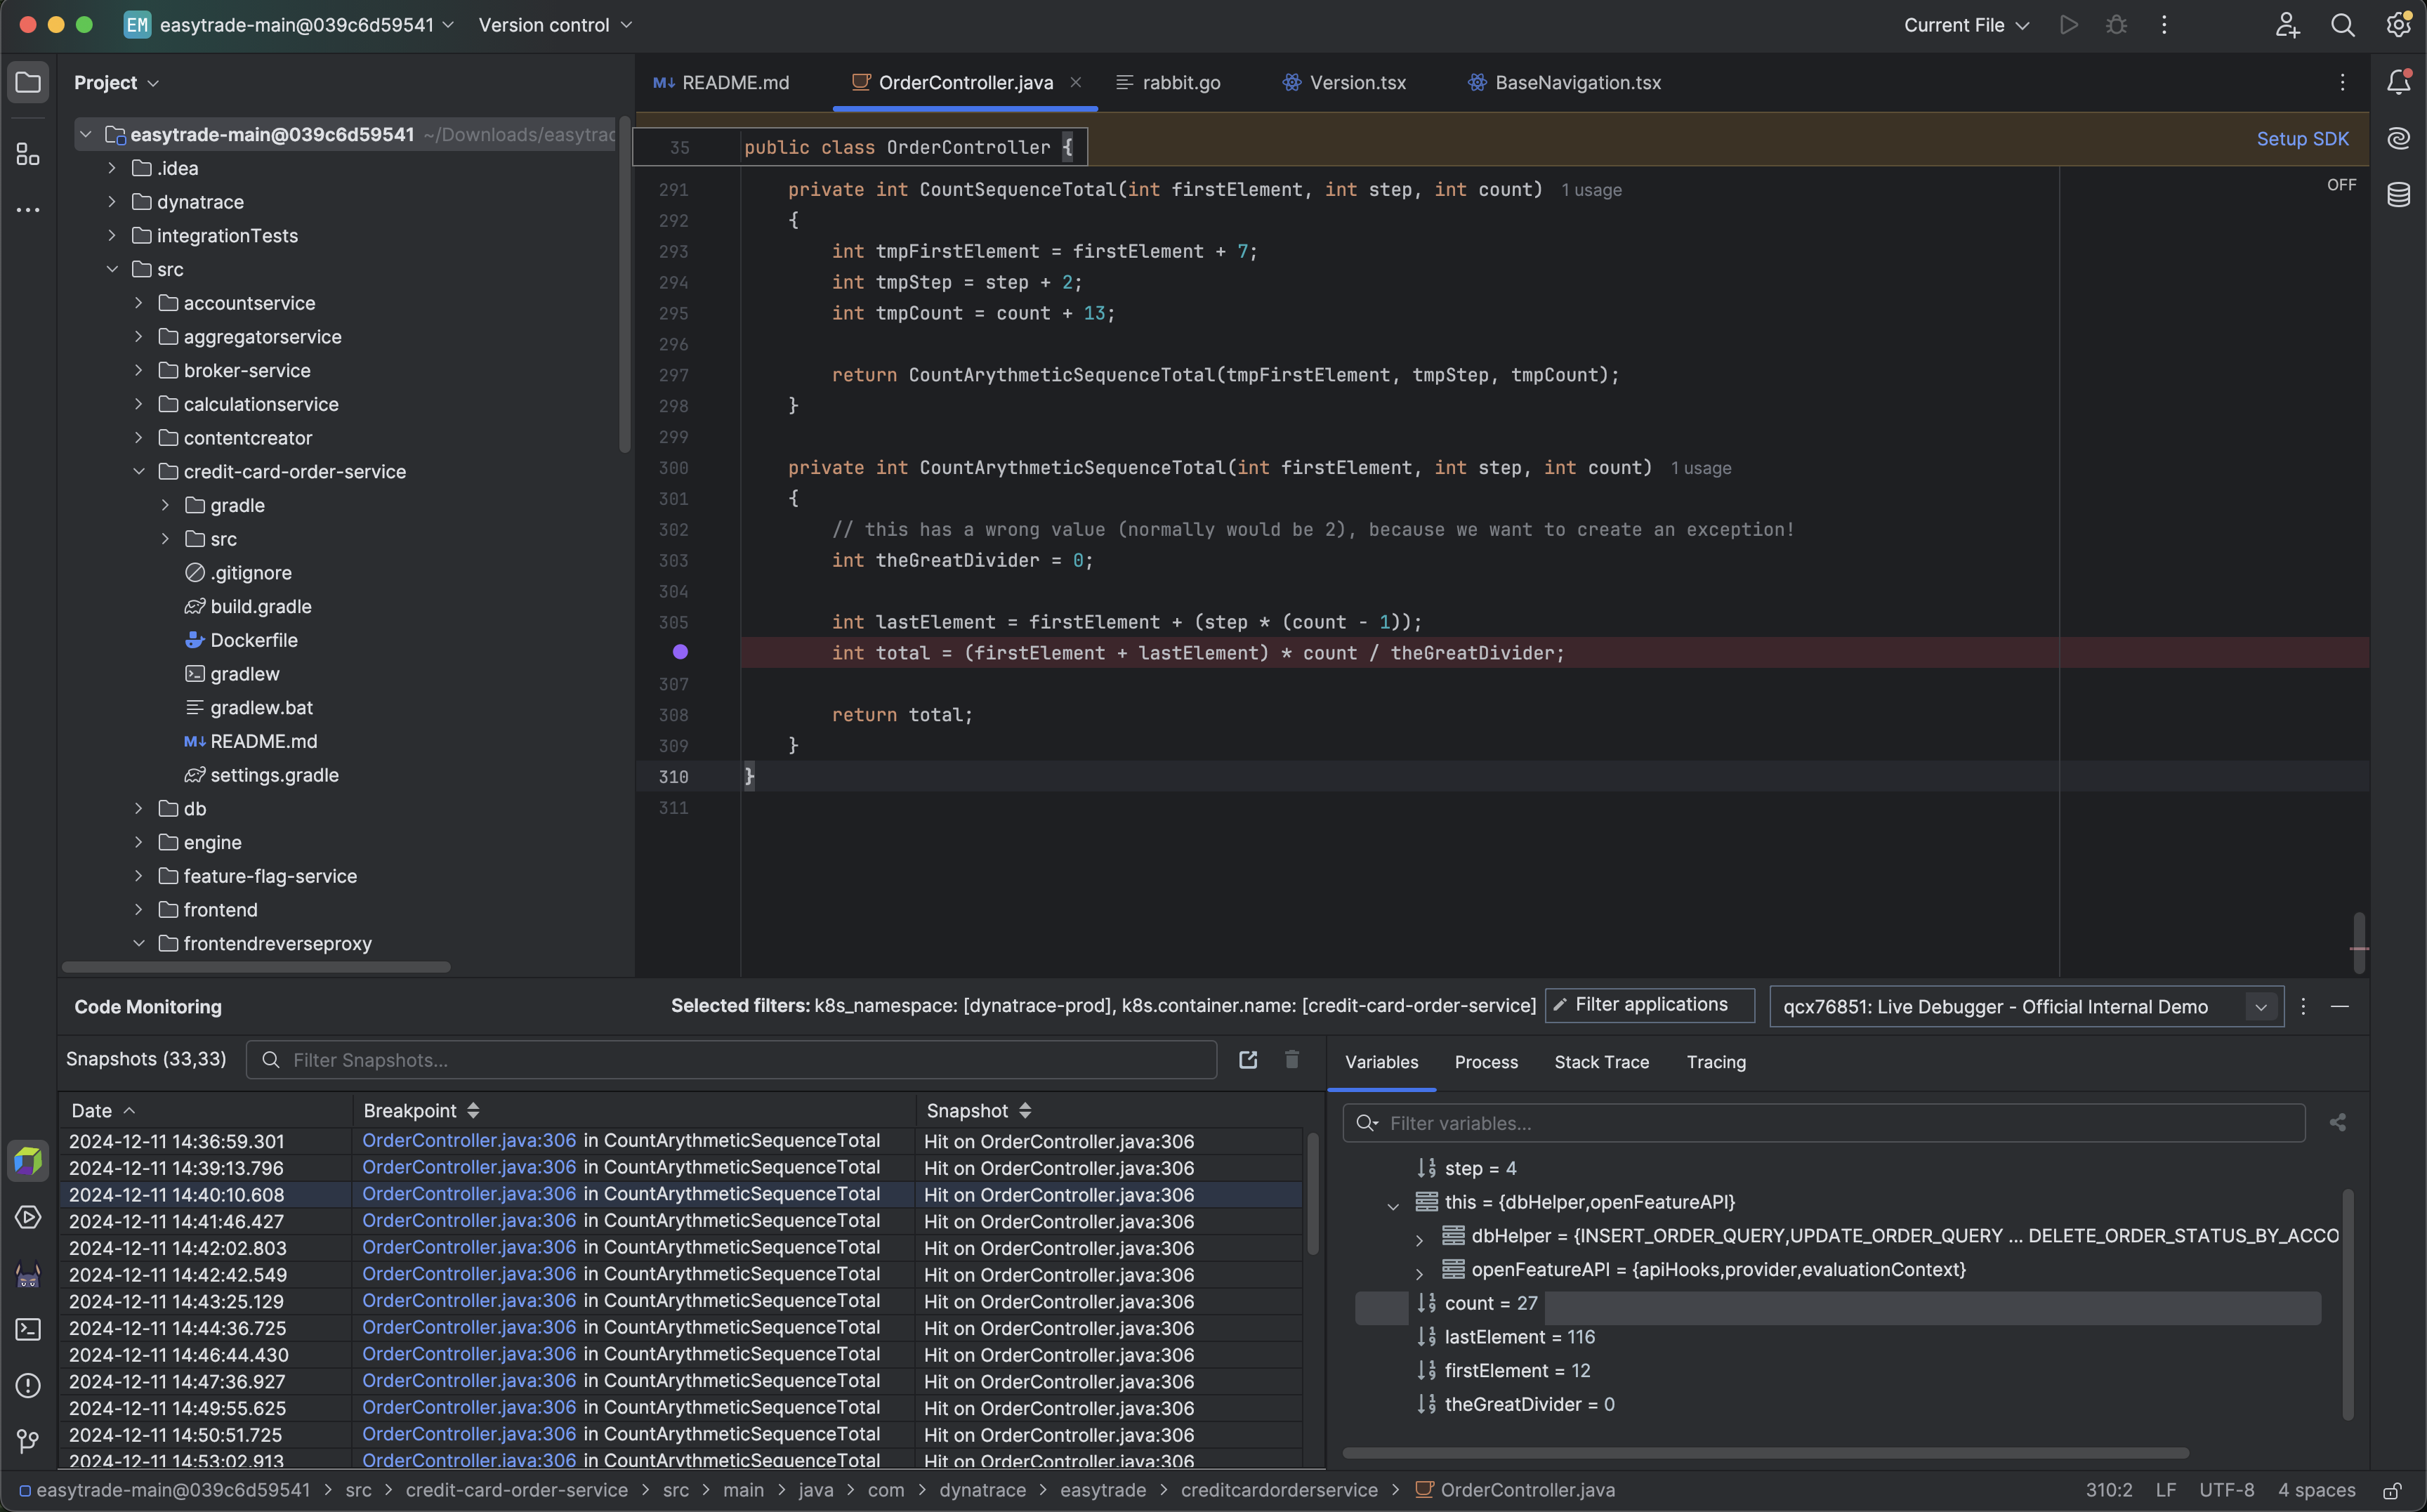
Place a non-breaking breakpoint
To get real-time code-level data
- Select the service you want to debug.
- Navigate to the file system.
- Set a non-breaking breakpoint on the line of code you want to debug.
Non-breaking breakpoints are reference breakpoints for the lines of code from which you want to collect debug data. These breakpoints don't stop your code from running. Instead, they carry the debug data collection request. Placing these breakpoints and receiving the derived snapshots don't affect your application or its users.
After placing a non-breaking breakpoint, ensure your code has been triggered so that the data is collected and appears immediately in Live Debugger.
See the debug data
Once the non-breaking breakpoint is triggered, the collected data is displayed in the Snapshots Pane at the bottom of Live Debugger.
Select the required snapshot to view the following information:
- All local variables and their values.
- Process information.
- Complete stack trace leading to the breakpoint.
- Tracing information from the running application.
You can also debug code up the stack from the stack trace view, including third-party components.
Concepts
- Application Observability
The inability to access code-level data on demand is a challenge that most developers face when troubleshooting and debugging application issues. Instead, they have to go through long deployment cycles and investigation of logs to find the relevant data they need to understand what's going on in their running code.
- Live Debugger
- Live Debugger is a cloud native debugging and live data collection solution that gives instant access to the code-level debug data you need to troubleshoot and understand complex, modern applications with no extra coding, redeployments, or restarts.
You can use
Live Debugger in any environment, from development to production, and at any time, to instantly access the real-time data needed to get to the root cause of issues faster. - Dynamic logging
Developer teams often try to log as much as possible, as they're often not sure what data will be needed to debug an issue. This generates many unneeded logs and horrid signal-to-noise ratios.
By shifting their logging mindset to Live Debugging, teams can reduce logging costs and, most importantly, the heavy effort required to support intense logging pipelines and cleanups.
- Development collaboration
Collected debug data can be shared among team members when debugging application issues. This allows team members to have their own view of collected debug data and share that data with other team members for improved collaboration.
As a result,
Live Debugger can become a single source of truth, the go-to place for developers to see reality as it is and collaborate on it.- On-demand trace inspection
- Live Debugger collects an object representation of traces used by your application. Developers can then correlate captured debug data with tracing data from your application.
- Dev training and onboarding
Understanding new code can be challenging. It's twice as tricky when it's legacy code or, as often occurs, code written by someone else.
Live Debugger lets developers speed up their learning process by allowing them to observe unfamiliar code running in its native environment.
Use cases
Capture real-time debug data
- Instantly understand the state of your application using non-breaking breakpoints and get instant output, including your full stack trace, local and global variables, tracing data and context, and server metrics (CPU, memory, time measurements, and more).
Troubleshoot faster
- Instantly debug the most complex flows.
- Fix bugs with zero friction, overhead, or risk.
- Get real-time data without stopping your app.
- Gain visibility into third-party dependencies and overcome debugging challenges from using open source components, external dependencies, or your legacy code.
Dev-friendly debugging experience
- Empower your developers with on-demand access to code-level data.
- Get full visibility into your code with a simple and intuitive experience. Optimize R&D efficiency: Spend less time fixing bugs and more time developing value for your organization and customers.
- Never leave your comfort zone with the choice of either an IDE plugin or the Live Debugger web app.
Test and optimize your code faster
- Instantly understand if specific line of code was reached at all with exploratory analytics
 Live Debugger