Capture SQL bind variables with OneAgent
- Latest Dynatrace
- How-to guide
- 4-min read
SQL bind variable capture is supported in Dynatrace SaaS and Dynatrace Platform Subscription (DPS) deployments.
This guide explains how to enable Dynatrace OneAgent to capture the runtime values of SQL bind variables so that you can see the exact parameters passed to your queries during troubleshooting without compromising data privacy.
You can use SQL bind variable capture to view the actual parameter values passed to SQL queries at runtime. This provides full context in distributed traces when troubleshooting database performance issues or failures.
Why it matters
Without this feature, parameterized queries appear in traces with placeholders only. With bind variable capture enabled, OneAgent attaches the real values so that you can see exactly what data was queried.
Bind variables are a means of parameterizing SQL statements so that the statements have question marks or parameters in their WHERE clauses. Without bind variable capture, you see a query like:
- SQL server:
SELECT count (*) from report WHERE tenant = @tenant - Java JDBC:
SELECT count (*) from report WHERE tenant = ?
With the capture enabled, you can see a query like:
SELECT count (*) from report WHERE tenant = 23456
This makes it much faster to reproduce issues, understand which data caused a slow query, and diagnose root causes—instead of guessing what parameter values were in play during an incident.
How it works
After you turn on Capture SQL bind values in Settings Classic, OneAgent captures database calls at the ADO.NET, JDBC, or PHP framework level and records parameter values with the corresponding SQL statements in distributed traces. Only users with the required entity permissions can view these values. You can also use OpenPipeline to mask or remove captured values.
Bind variables allow the database server to prepare the statement once and execute it multiple times without reparsing or reanalyzing it.
Bind variables aren't applicable to statements that use literals, such as:
SELECT count (*) from report WHERE tenant = 'xxxx'
These statements can't be parameterized and are reparsed and reanalyzed by the database server with each execution.
Bind variables generate high network and storage demands. To learn more about bind variables support and its availability, see FAQ below.
Enable capture of SQL bind variables for OpenTelemetry
For OpenTelemetry-instrumented services, bind variable capture is not controlled by a Dynatrace setting. Each database span must carry db.query.text and db.query.parameters. Dynatrace stores and displays attributes exactly as sent, and no automatic mapping from other attribute names occurs.
Query text
Set db.query.text to the parameterized SQL statement. The attribute name matches the OpenTelemetry semantic conventions directly, hence the most up-to-date auto-instrumentation libraries populate it automatically.
Bind variable values
Set db.query.parameters as a span attribute on each database span.
Standard OpenTelemetry auto-instrumentation libraries typically use the db.query.parameter.<key> convention (for example, db.query.parameter.0). These attributes appear in the span attributes panel but are not recognized as db.query.parameters and do not enable the bind variable feature. Setting db.query.parameters requires manual instrumentation.
db.query.parameters is classified as sensitive spans in the Dynatrace Semantic Dictionary regardless of whether values arrive from OneAgent or OpenTelemetry. The same access restriction applies: only users with permission to view the corresponding entity or management zone can see the attribute.
Enable capture of SQL bind variables for OneAgent
To enable SQL bind value capture
-
Go to Settings > Server-side service monitoring > Deep monitoring.
-
Expand Database and turn on or off Capture SQL bind values on the global level.
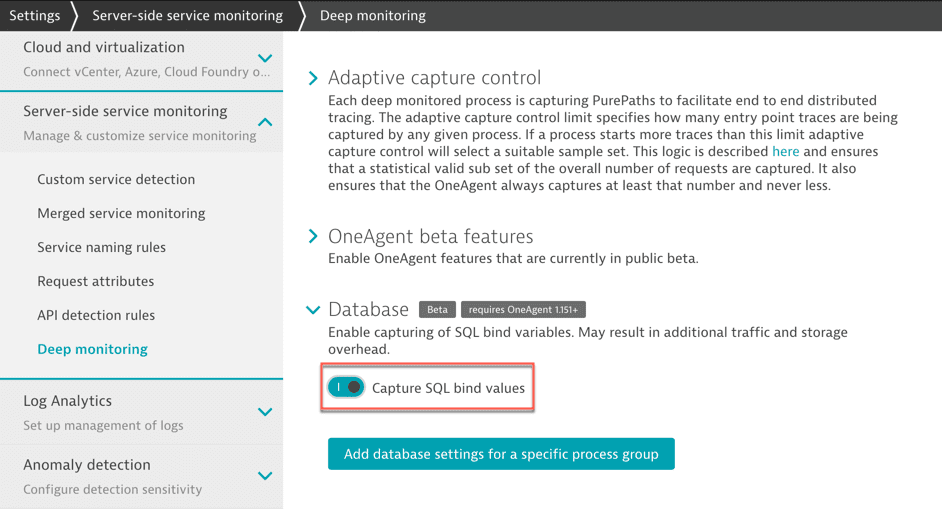 Capture SQL bind values
 -
Optional To override the global setup, go to Process group override.
- To add an override, select Add process group override and select the affected process group.
- Optional To select a specific process from the selected process group, select the process from the dropdown list.
- Select Add.
-
Select Save changes.
Whether you enable this setting environment-wide or for individual process groups, you can use Dynatrace OneAgent to capture the values of bind variables. This is applicable to the following technologies:
- ADO.net
- JDBC
- PHP database frameworks
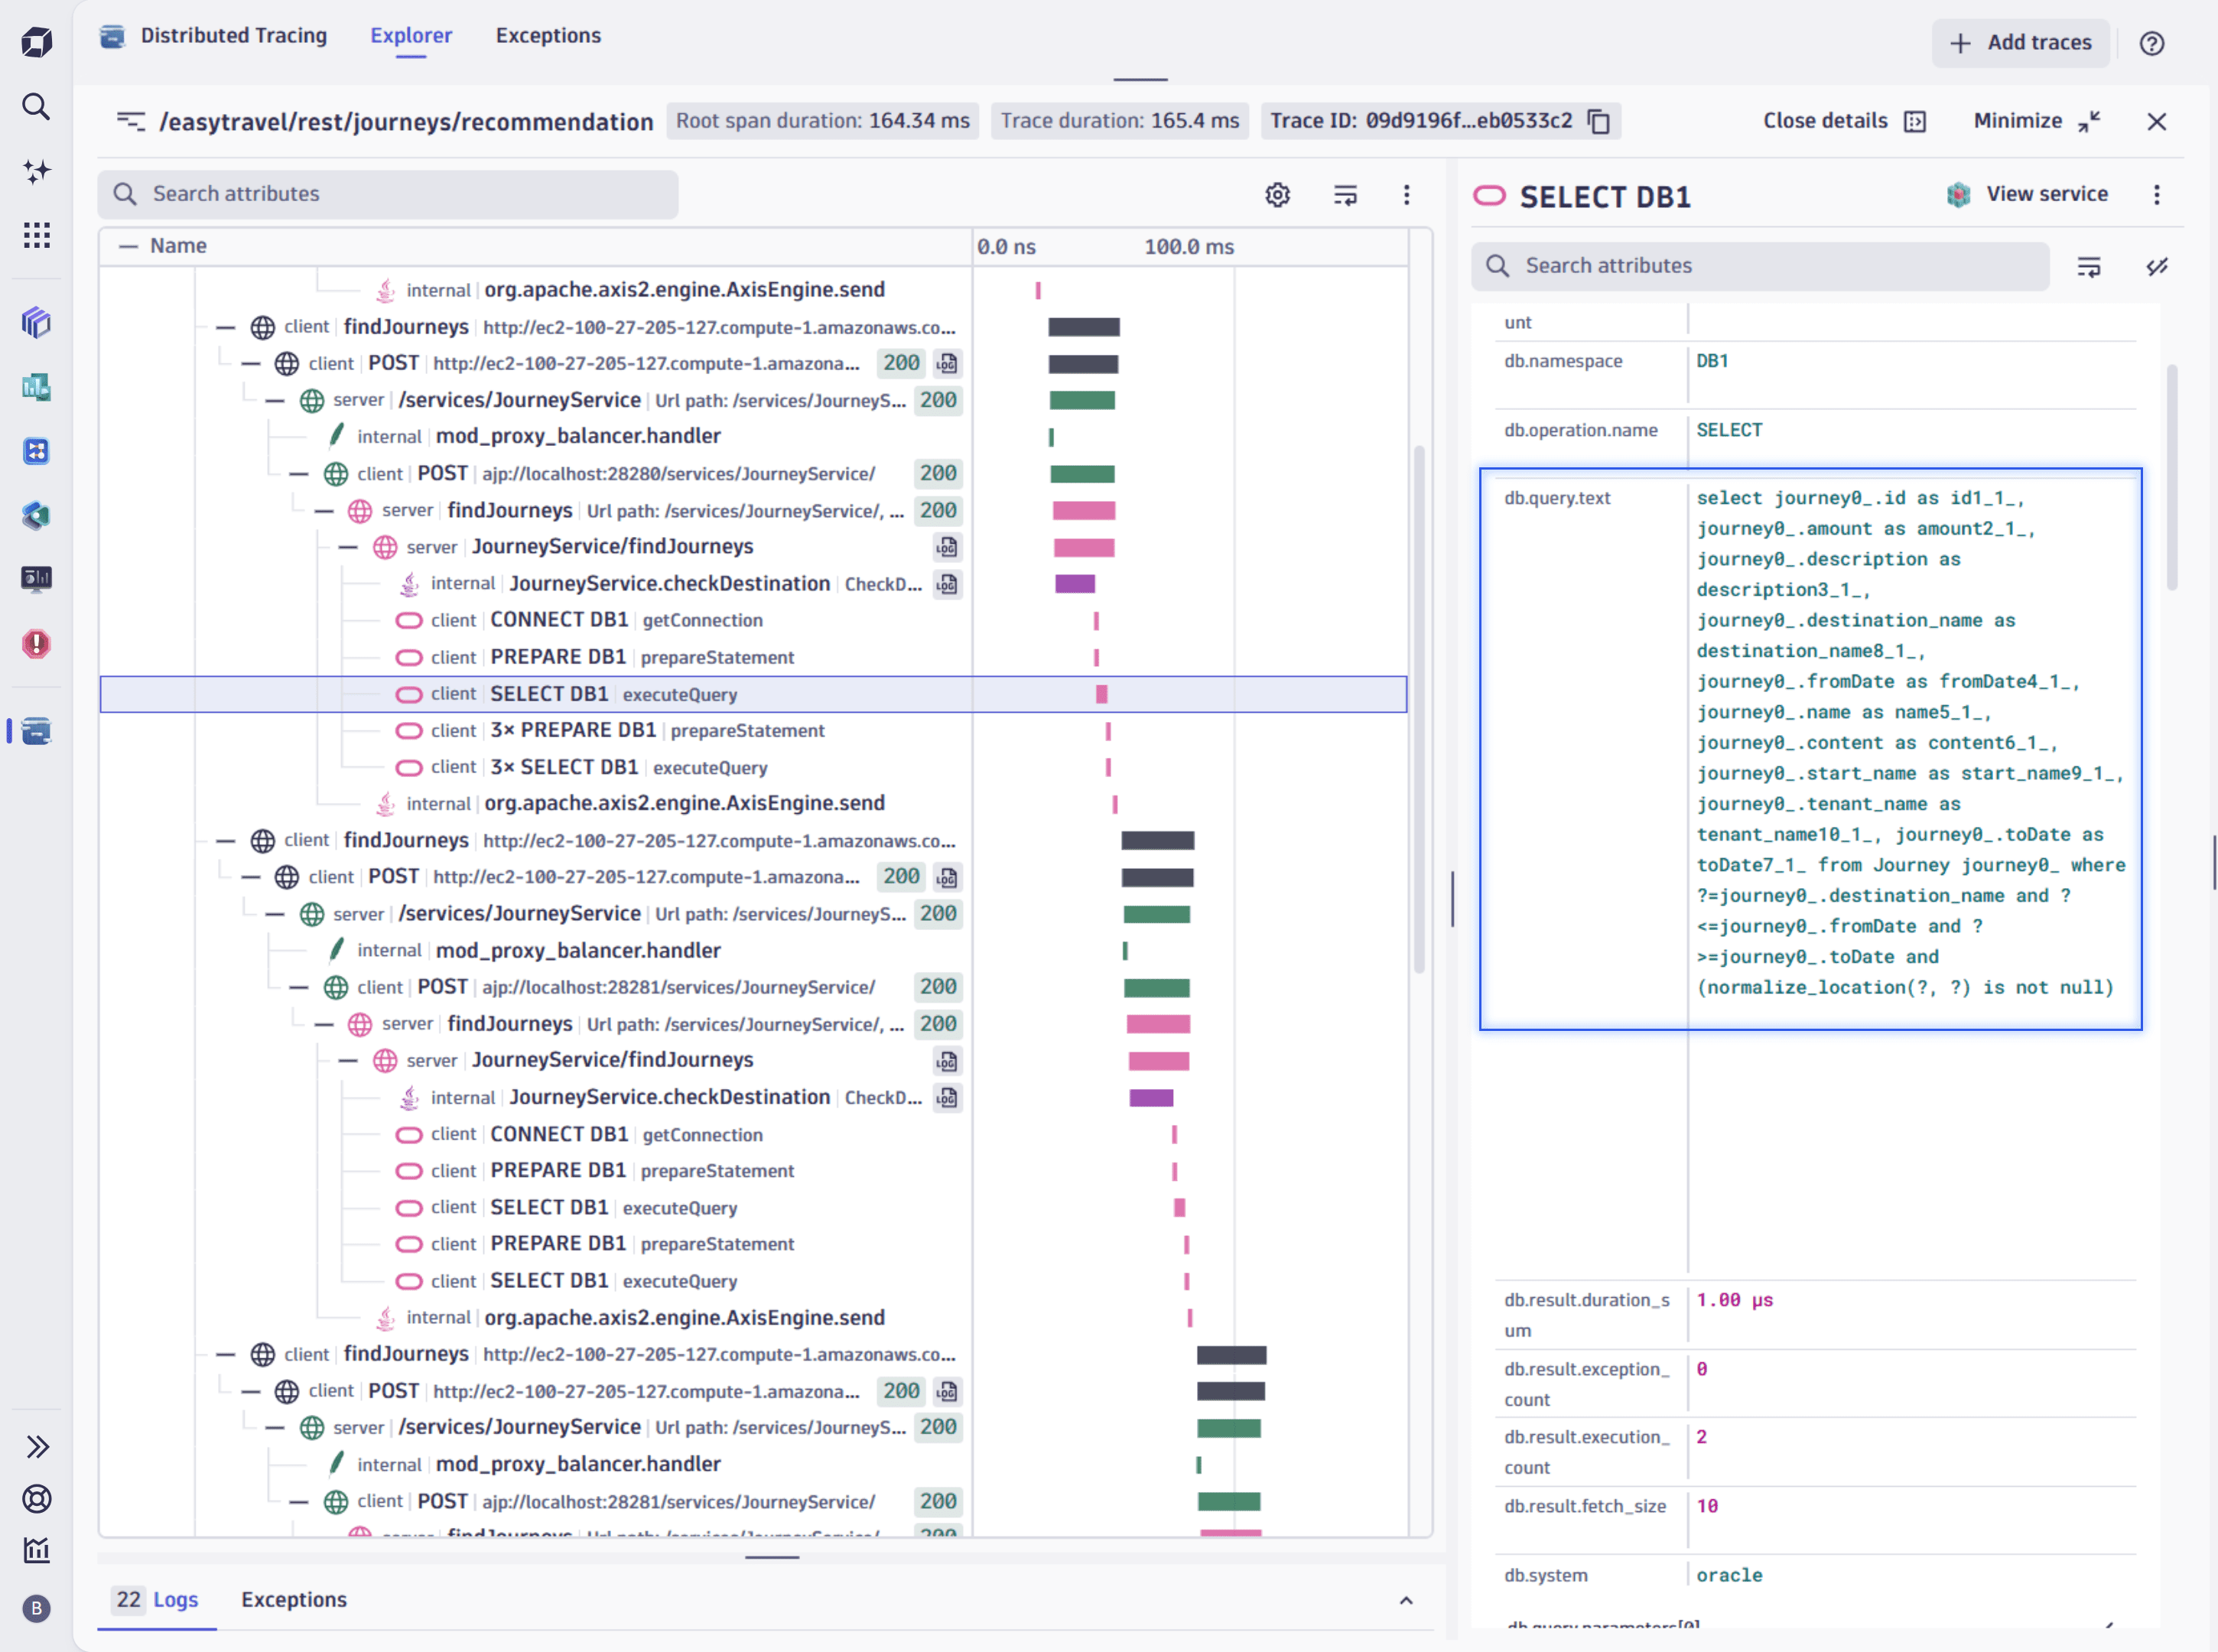
If the array returned by executeBatch() contains more than one element, indicating multiple commands were executed, Dynatrace masks the values of the bind variables to ensure data privacy. This is because different executions of executeBatch() may aggregate multiple commands, requiring the masking of bind variable values to prevent the exposure of sensitive information.
Example of masked and unmasked SQL bind values
A sample result of this feature is  Distributed Tracing. The following screen illustrates the masking of bind variables.
Data privacy
Bind variables are considered confidential as they can contain IDs and other sensitive values. To learn how to ensure the data privacy, see Data privacy and security.
Only users who have permission to view a specific entity or management zone can view the bind variables within that entity or zone.
db.query.parameters and db.connection_string are tagged sensitive-spans in the Dynatrace Semantic Dictionary by default. This restricts access to users who have permission to view the corresponding entity or management zone.
To control which bind variable data is stored or forwarded beyond this access restriction, use OpenPipeline to mask or drop specific field values before they reach Grail.
FAQ
Bind variables are not available in my Dynatrace environment. How do I get this feature?
This feature is available in Dynatrace environments that are licensed via Dynatrace Platform Subscription (DPS). If you have a Dynatrace classic license, change your subscription plan to a Dynatrace Platform Subscription (DPS) license to use bind variables.
Does capturing bind variables have negative consequences?
This feature can capture a lot of sensitive data, so you should consider its usage carefully. You might also choose to mask or drop parts of the captured data via OpenPipeline.
Additionally, this feature can capture a lot of data in the absolute sense. Heavy usage of this feature means that you will run out of the included trace volume for your Full-Stack monitored applications faster. In other words, heavy usage can lower your trace capture rate. To mitigate this, you should either use this feature for troubleshooting only or you can opt into Extended trace ingest to accommodate the increased data volume.