Transition from frequent issue detection
- Latest Dynatrace
- Explanation
- 5-min read
- Published Aug 05, 2026
Frequent issue detection is being phased out on the latest Dynatrace platform. Instead of muting noisy alerts after they are raised, Dynatrace is improving the individual alert sources so that frequent, false-positive alerts are not generated in the first place.
You do not need to perform any migration or upgrade work to replace frequent issue detection. We are improving the alert sources directly, so the noise and false positives that frequent issue detection used to hide are reduced at the root.
The outcome is the same goal—a quiet, trustworthy alerting experience—achieved in a cleaner way. Problem detection becomes more accurate because fewer false-positive events are created in the first place, rather than being created and then suppressed.
If you want to actively tune noise reduction for specific sources, optional self-service settings are described later in this guide. These steps are entirely optional and are not required for the transition.
Prerequisites
- Dynatrace Platform Subscription (DPS) license
How frequent issue detection works in Dynatrace Classic
The main use case for frequent issue detection is to automatically identify and flag alert events that are triggered too frequently over a period of a day or week. After marking those alert events as being frequent issues, Davis Problem detection mutes such events and avoids raising problems for alert events that Dynatrace considers as being frequent, false-positive event noise.
Frequent issue detection in Dynatrace Classic can only be enabled or disabled on three topological levels.
-
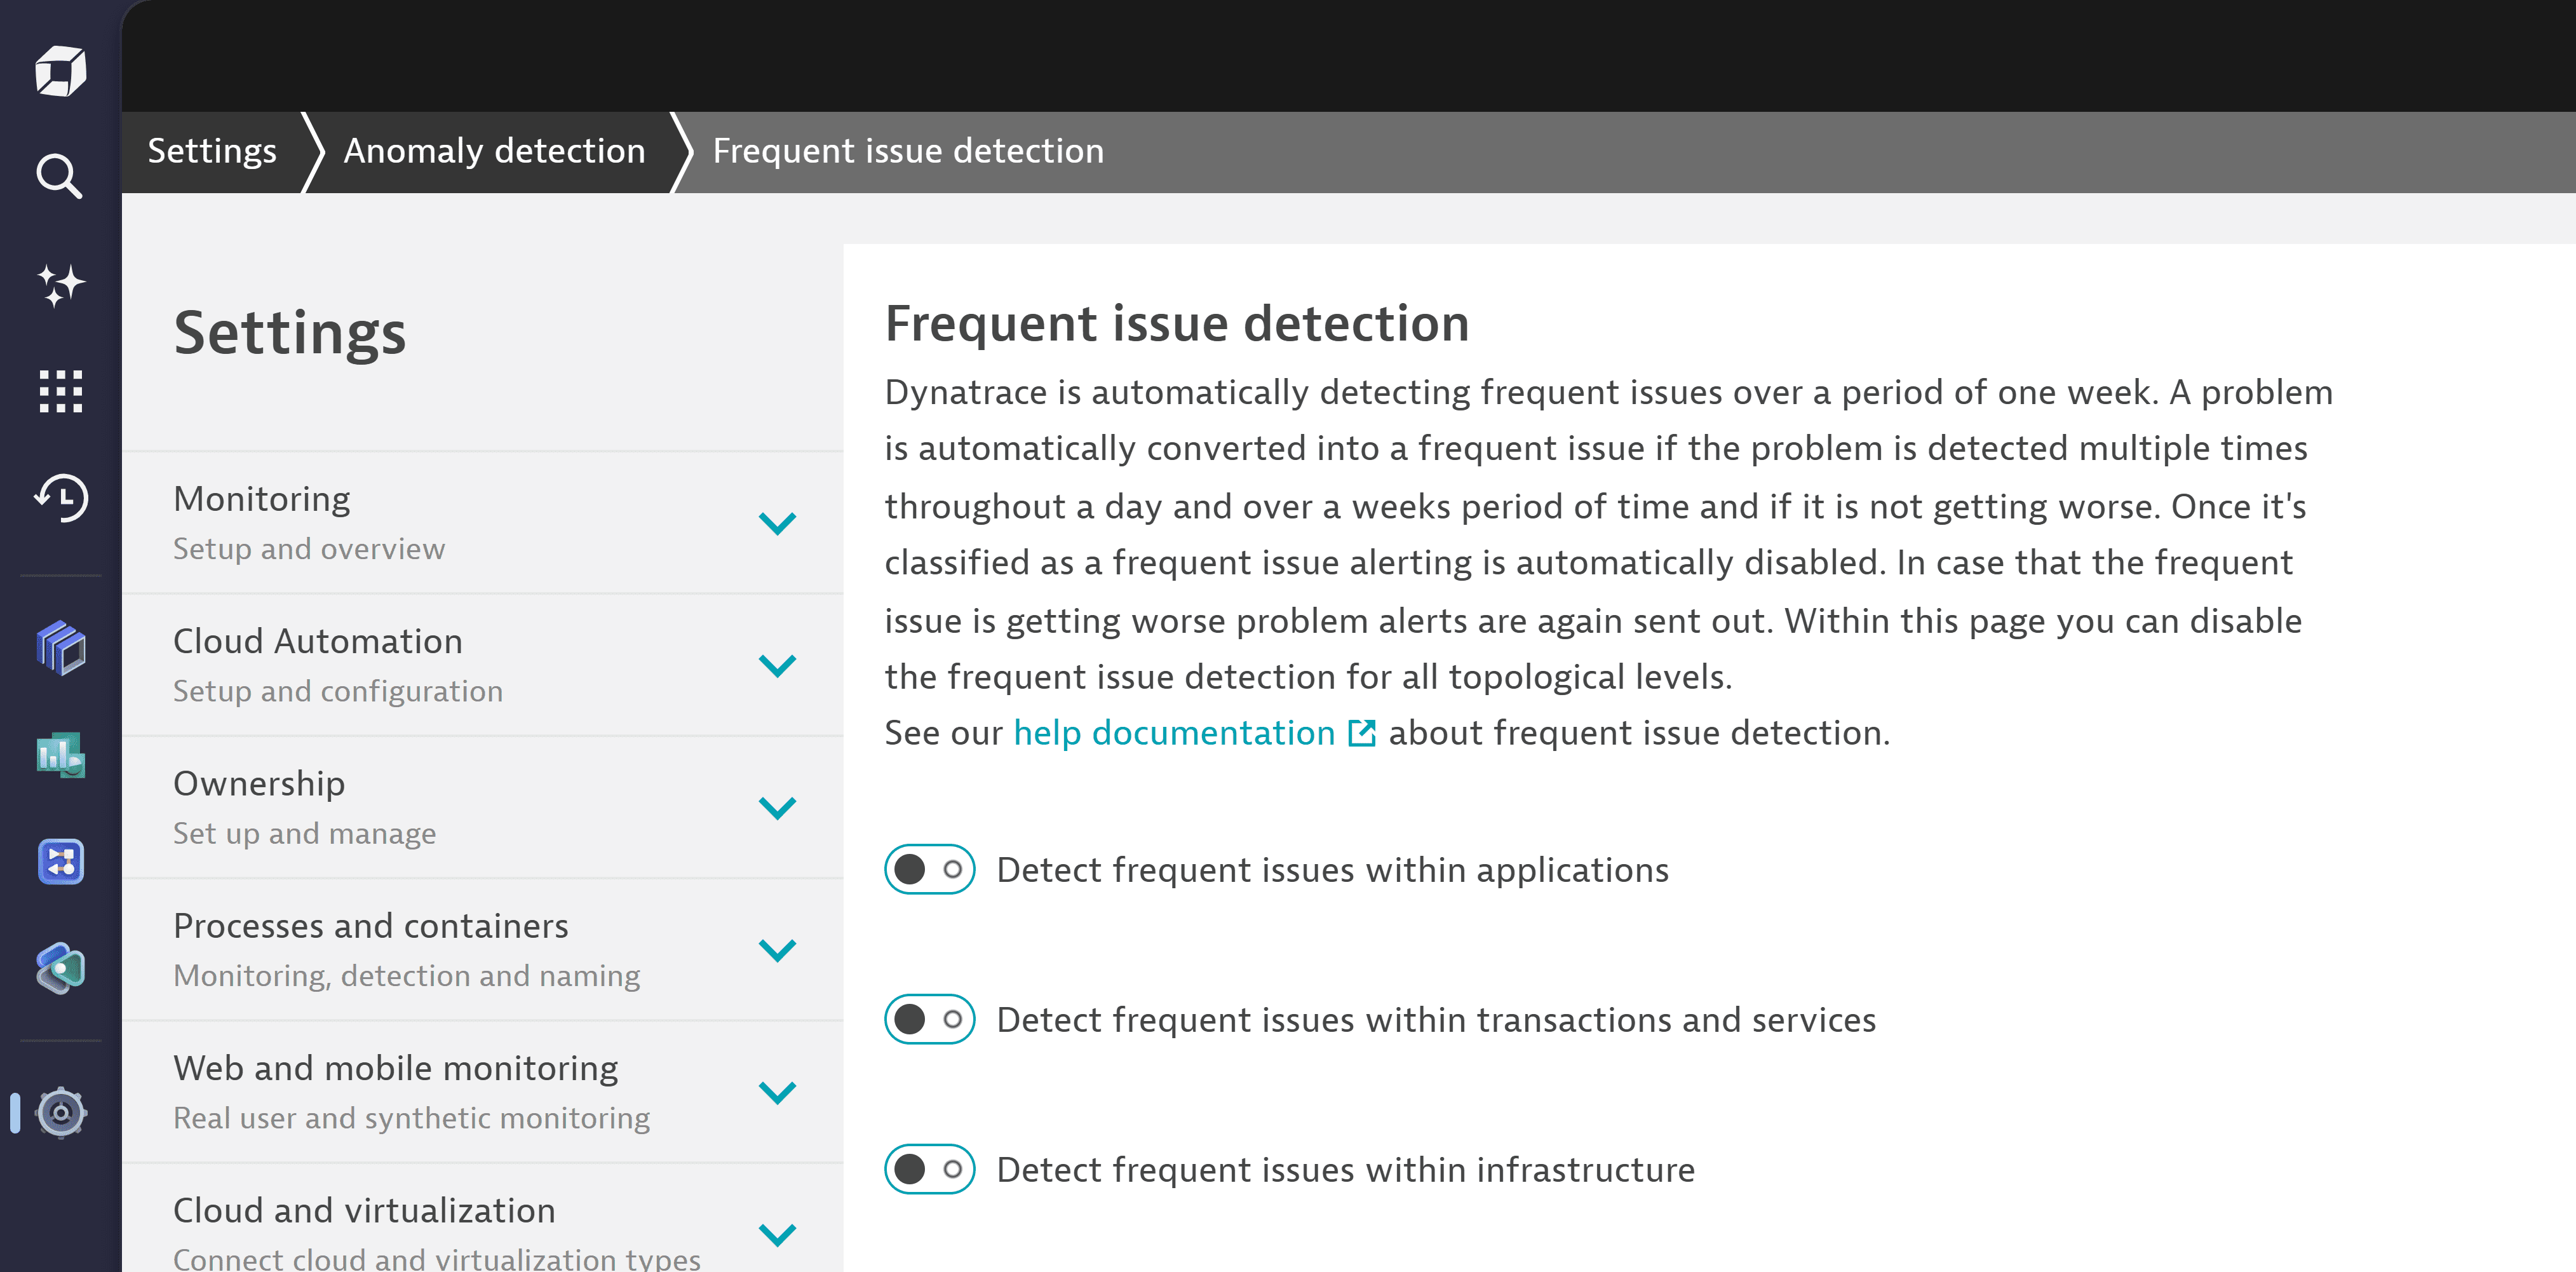
In Dynatrace Classic, go to Settings > Anomaly detection > Frequent issue detection.
-
Select the detection levels.
- Detect frequent issues within applications
- Detect frequent issues within transactions and services
- Detect frequent issues within infrastructure
Why we are changing the approach
Despite its usefulness, the original approach has limitations:
- It works only at a coarse level and does not allow fine-grained control for individual entities or groups of entities.
- It mutes alerts automatically, without notice and without fine-grained configuration options.
Because it mutes large volumes of noisy alerts automatically, simply switching it off was never a good option on its own—teams would risk being overwhelmed by false-positive alerts. That is exactly why we are addressing the noise at its source instead, so these alerts never become noise in the first place.
How frequent issue detection works in Latest Dynatrace
Frequent issue detection in Dynatrace automatically flags and mutes alerting events that are reported by any event source unusually frequently.
For example, consider a process unavailability problem that triggers an active problem every 60 minutes due to a regular but unclean batch process restart. After several such occurrences, frequent issue detection would mark those alerting events as frequent events using a well-defined Dynatrace semantic dictionary field (dt.davis.is_frequent_event), and the problem reporting on top of those marked alerting events would be suppressed.
Optional actions
You do not need to take any of the following actions—Dynatrace handles this transition for you by improving the alert sources. If you prefer to take a more active role, the following optional approaches are available to identify frequent issues and clean them up.
Identify the level and sources of frequent issues
Optional
To review how many frequent issues exist in your environment today, you can optionally use the following steps to create a report of their volume and sources.
-
Create a notebook.
-
Add a DQL section with the following DQL to count frequent alert events.
fetch dt.davis.events| summarize count = countDistinct(event.id), by:{dt.davis.is_frequent_event} -
Add a DQL section with the following DQL to identify top noisy event producers.
fetch dt.davis.events| filter dt.davis.is_frequent_event == true| summarize count = countDistinct(event.id), by:{dt.source_entity, event.name}| sort count desc| limit 10
The alerting events will originate from various sources that require different source configurations in Dynatrace, such as:
- Application and service baselines
- Infrastructure alerts (CPU, Disk, and Memory saturation)
- Kubernetes alerts
- Synthetic tests
- Custom metric alert configurations
- Extension alert configurations
- External alert events sent via Dynatrace API—if you want to fix these, you need to address them outside of Dynatrace or drop these events in OpenPipeline as described below.
- OneAgent local custom alert events
Clean up alert events at their source
Optional
To clean up alert events at their source, identify the level and sources of frequent issues, and then try to adapt the configuration at the event source to get rid of false-positive alarms.
For example, a service baseline might raise too many alerts. To reduce the number of alerts, identify the event entity and adapt the service baseline setting for that single service to be less strict or disable it entirely for the service.
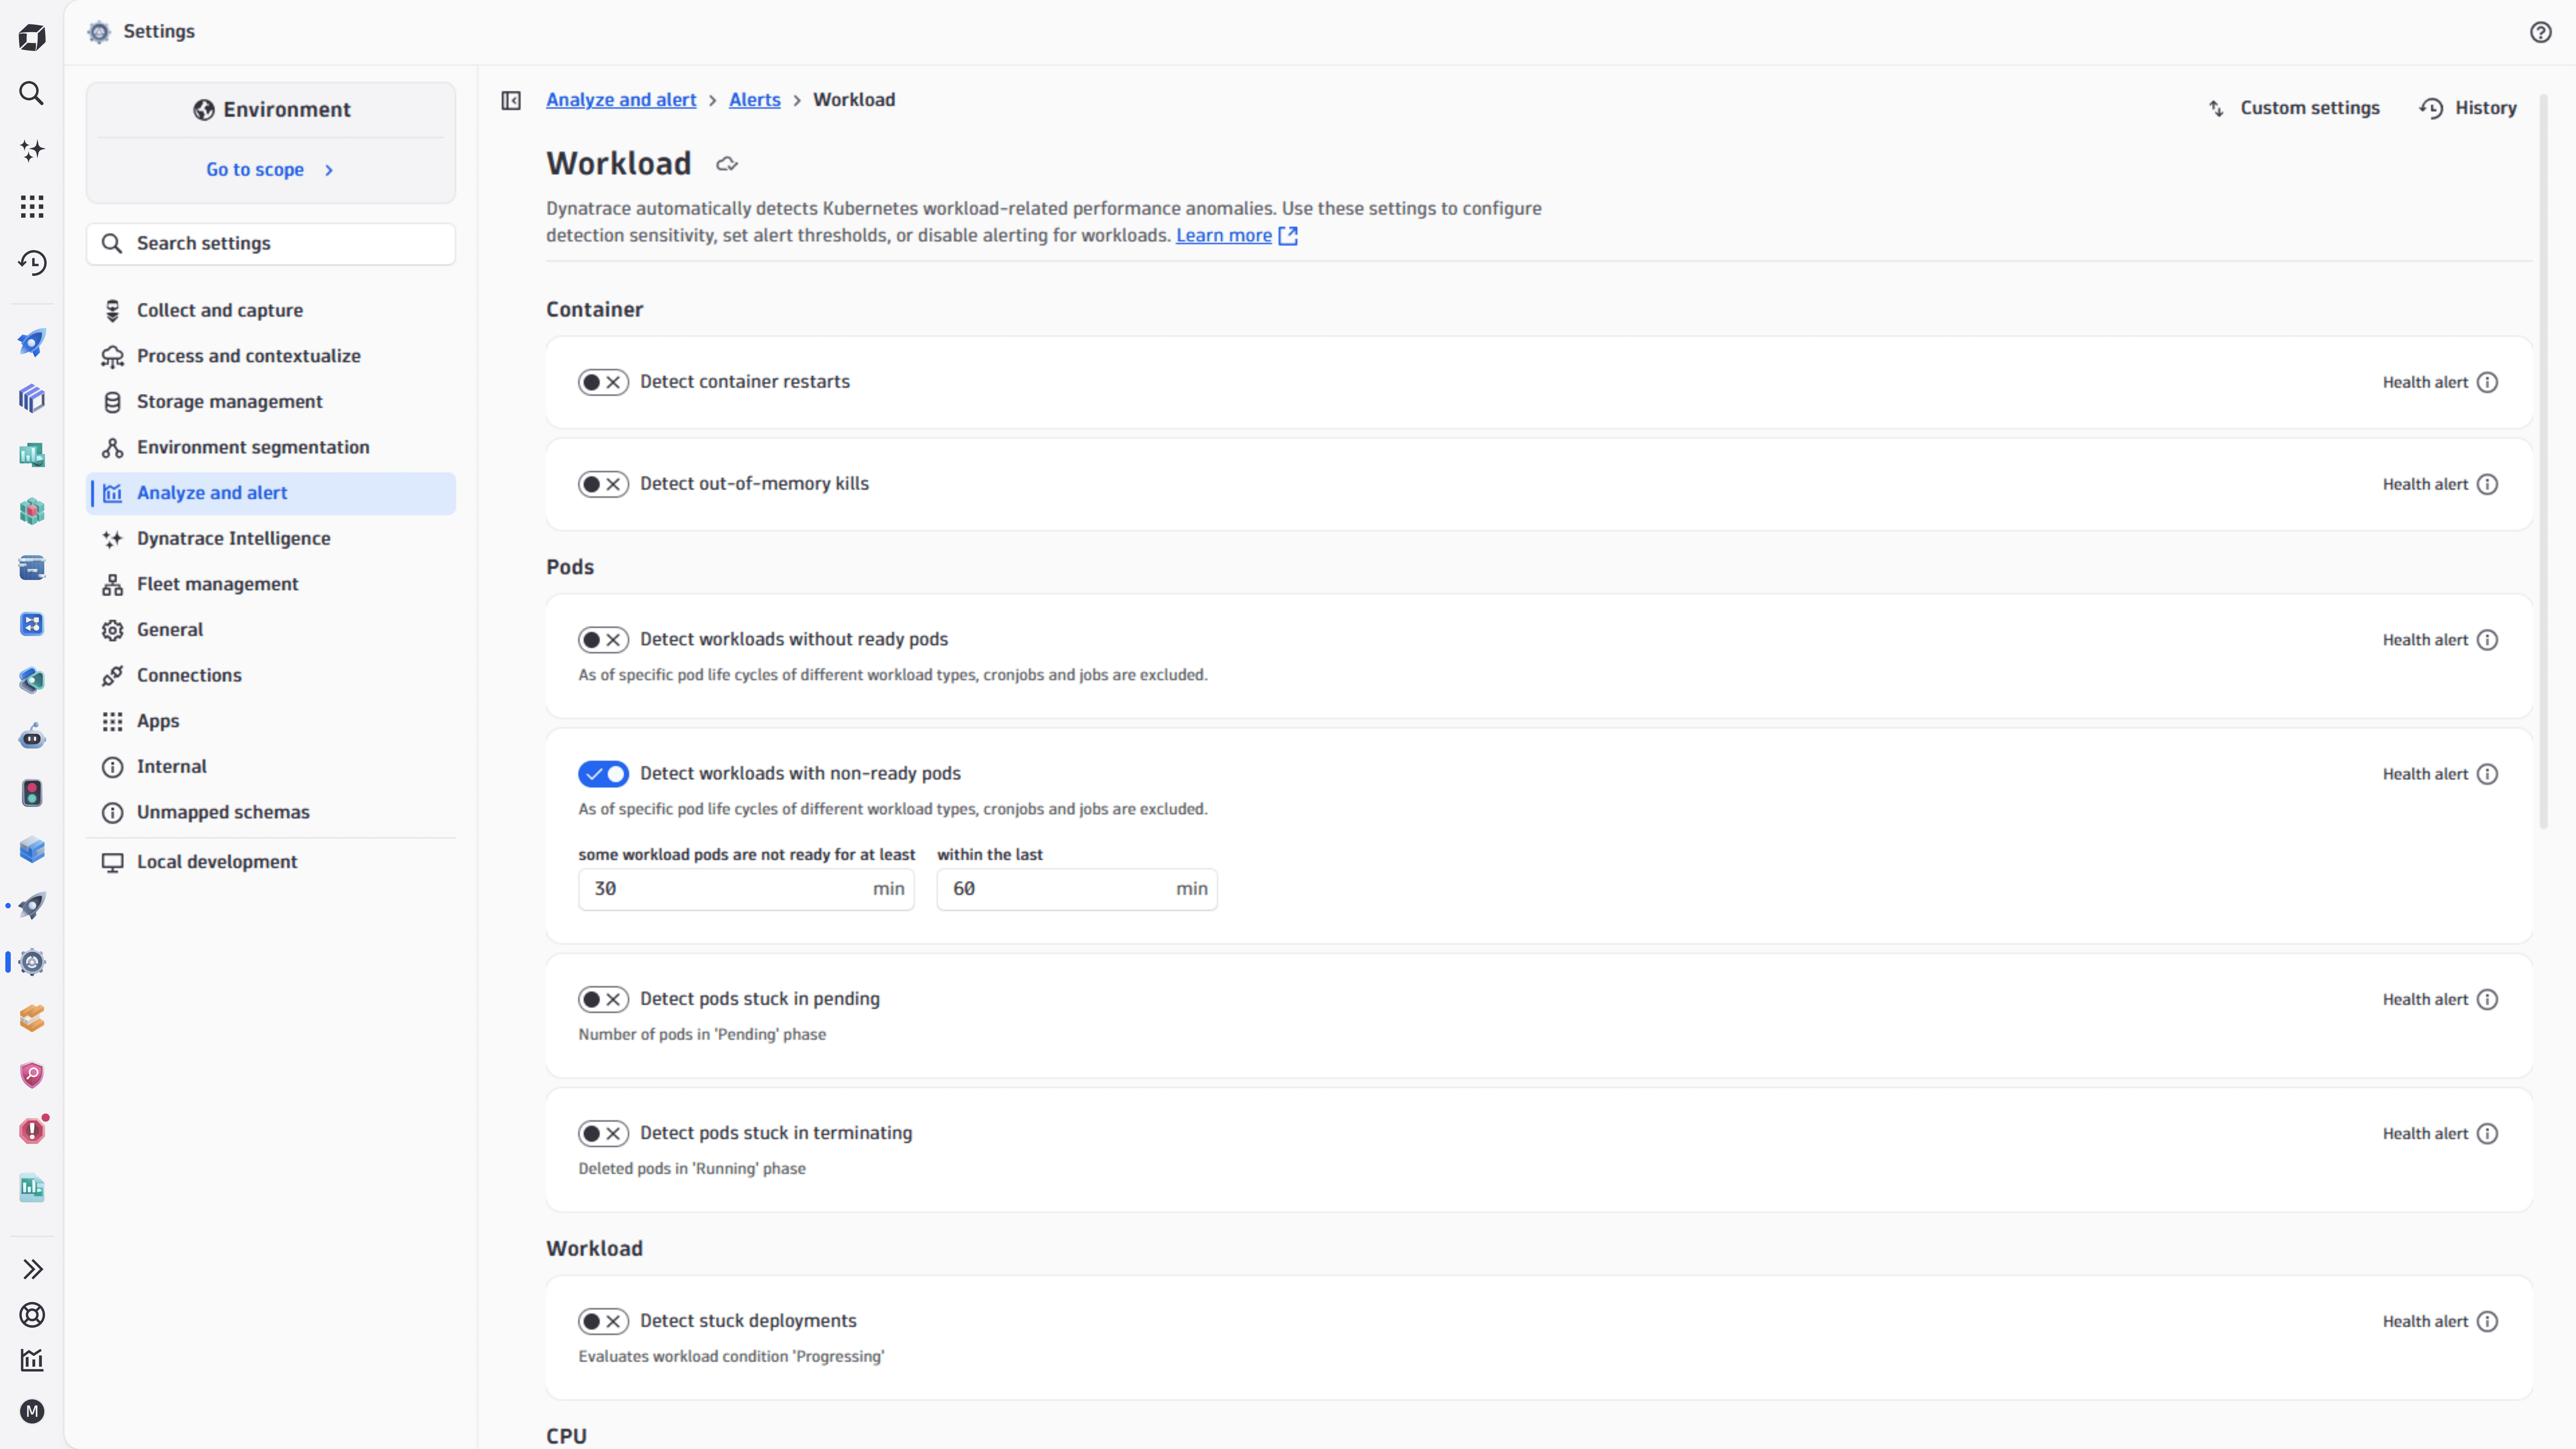
The following example shows how to optionally adjust the sensitivity of key performance metrics for a Kubernetes workload.
- Go to Settings > Analyze and alert > Alerts.
- In the Kubernetes section, select Workload.
- Adjust settings as needed.
- Select Save.
Drop false-positive alarms during ingestion
Optional
If the source of the alarm event is not configurable within Dynatrace—such as an external alert tool that sends in alarm events through the Dynatrace API—you can alter them in OpenPipeline during ingestion. Either drop those events entirely to save storage, or manually mark them with the field dt.davis.is_frequent_event to mute problem reporting and keep them for reference and reporting purposes.
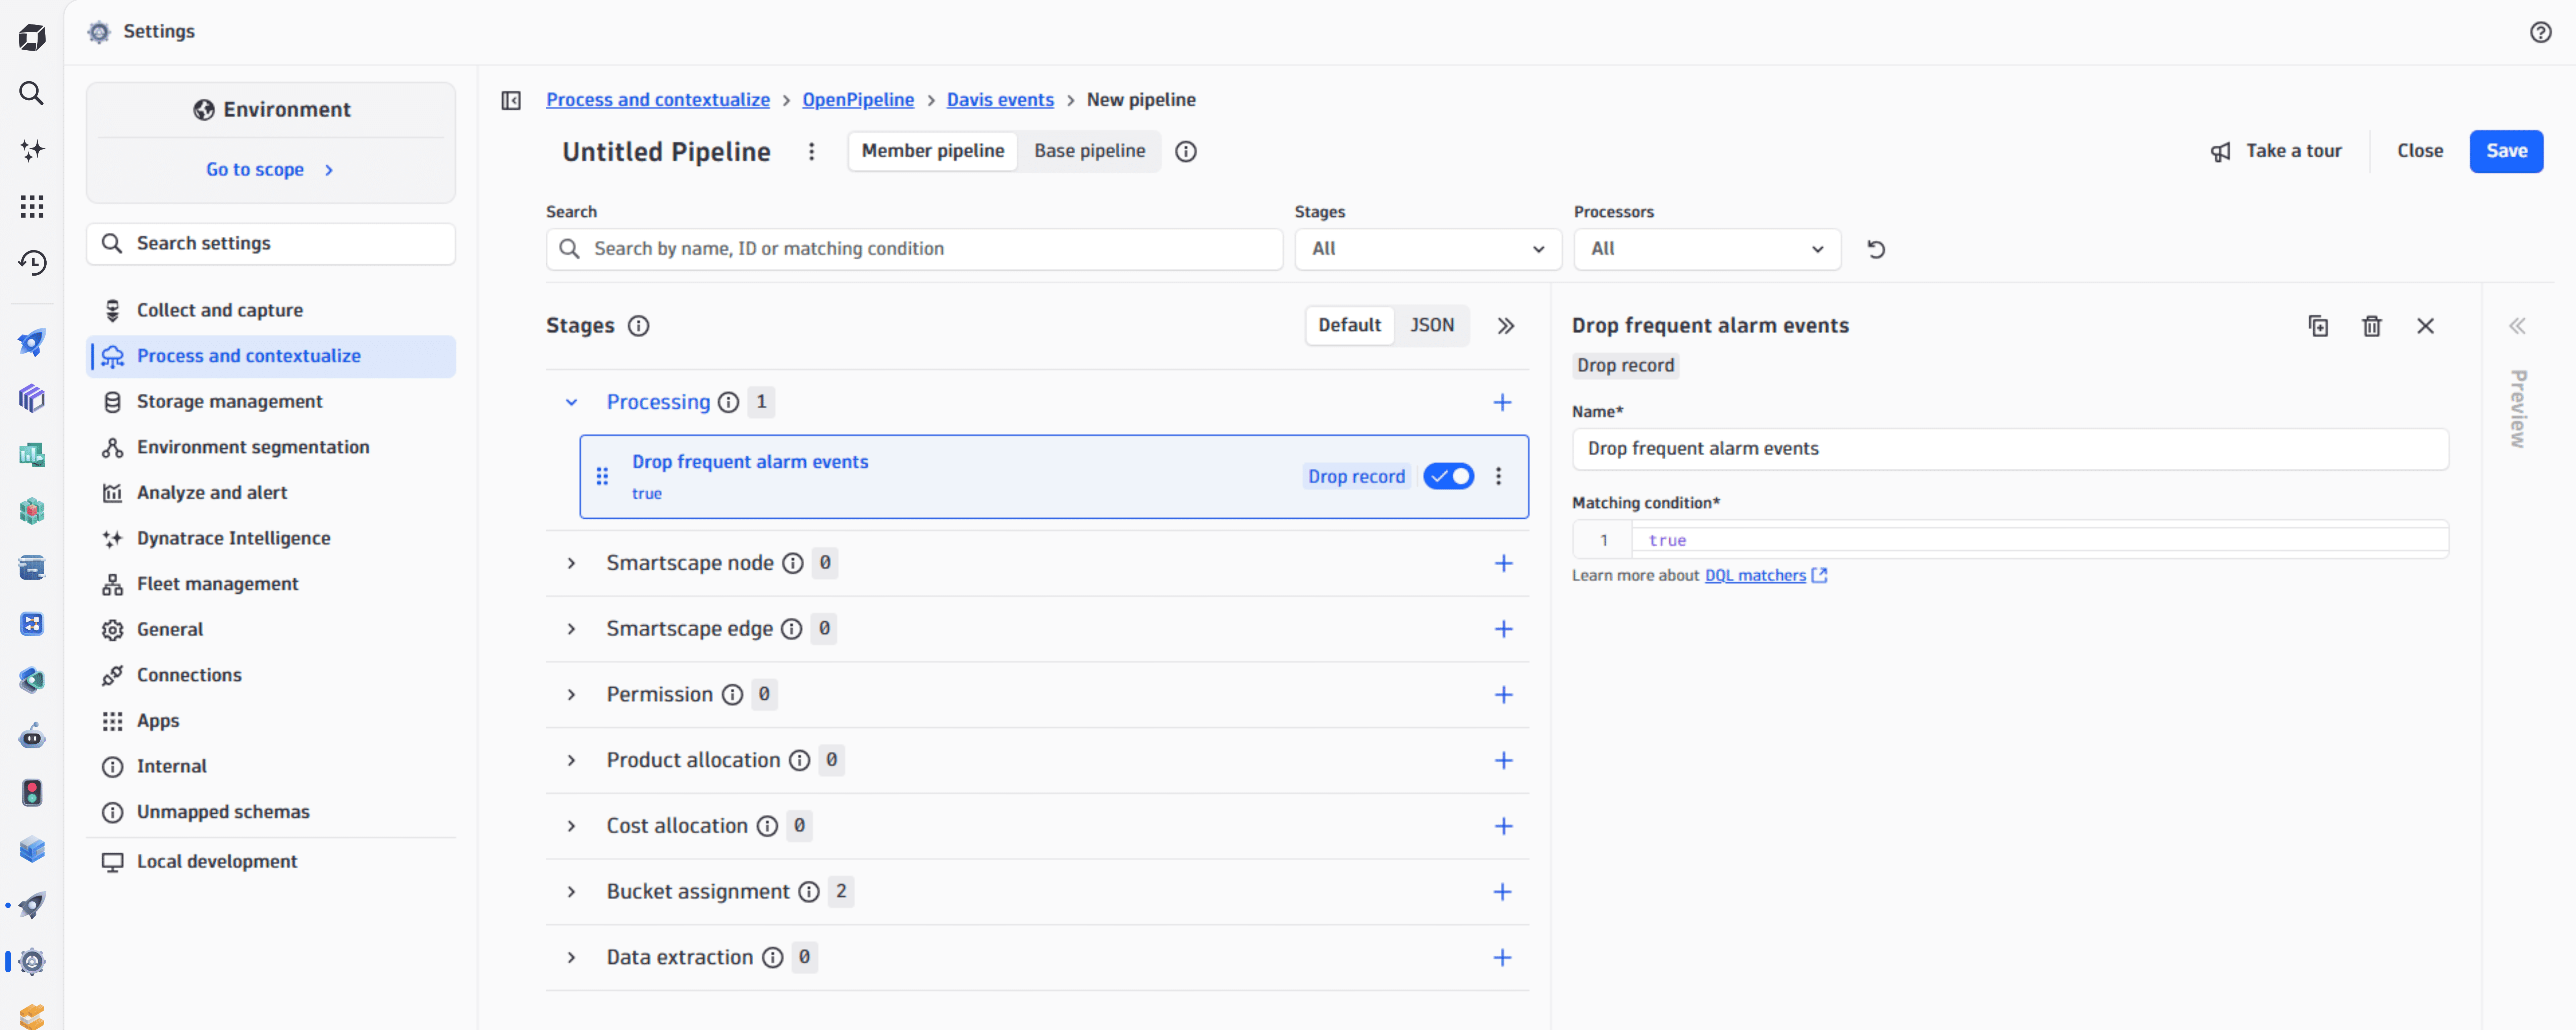
The following example shows how to optionally use OpenPipeline to drop frequent alarming events.
- Go to Settings > Process and contextualize > Davis events to configure an existing pipeline or add a new one handling Davis alarm events.
- Add a new processor in the Processing stage.
- Select the type Drop record.
- In the configuration panel, add a name and matching condition to ensure the Davis event is dropped when processed at ingest and not stored to Grail.
- Select Save.