Segment data by Kubernetes clusters
- Latest Dynatrace
- Tutorial
- 5-min read
Configure a segment for signals and monitored entities related to multiple Kubernetes clusters in a common stack.
Who this is for
This article is intended for administrators and Kubernetes operators who need to organize and logically structure workloads on Kubernetes clusters.
What you will learn
In this article, you'll learn how to create a segment to conveniently filter observability signals and monitored entities in the Kubernetes domain.
Before you begin
Prior knowledge
Prerequisites
- Dynatrace Operator version 1.8.0+
- Dynatrace SaaS environment powered by Grail and AppEngine.
- You have both
storage:filter-segments:writeandstorage:filter-segments:readpermissions. To learn how to set up the permissions, see Permissions in Grail. - You have licensed and set up Kubernetes Platform Monitoring.
How-to
1. Create a segment for clusters of a common stack
- Go to
") Kubernetes and open Explorer.
Kubernetes and open Explorer. - In the top-left corner select to filter by segments.
- In the bottom-left corner select Manage segments.
- Select Segment to add a new segment.
- Give your segment a name and description.
- Select Visibility and set it to
Anyone in the environmentso others can find and use this segment. - Select Save.
At this point, the segment doesn't specify what data it should include. In the next section, we will reference data to be filtered with this segment.
2. Include observability signals and monitored entities
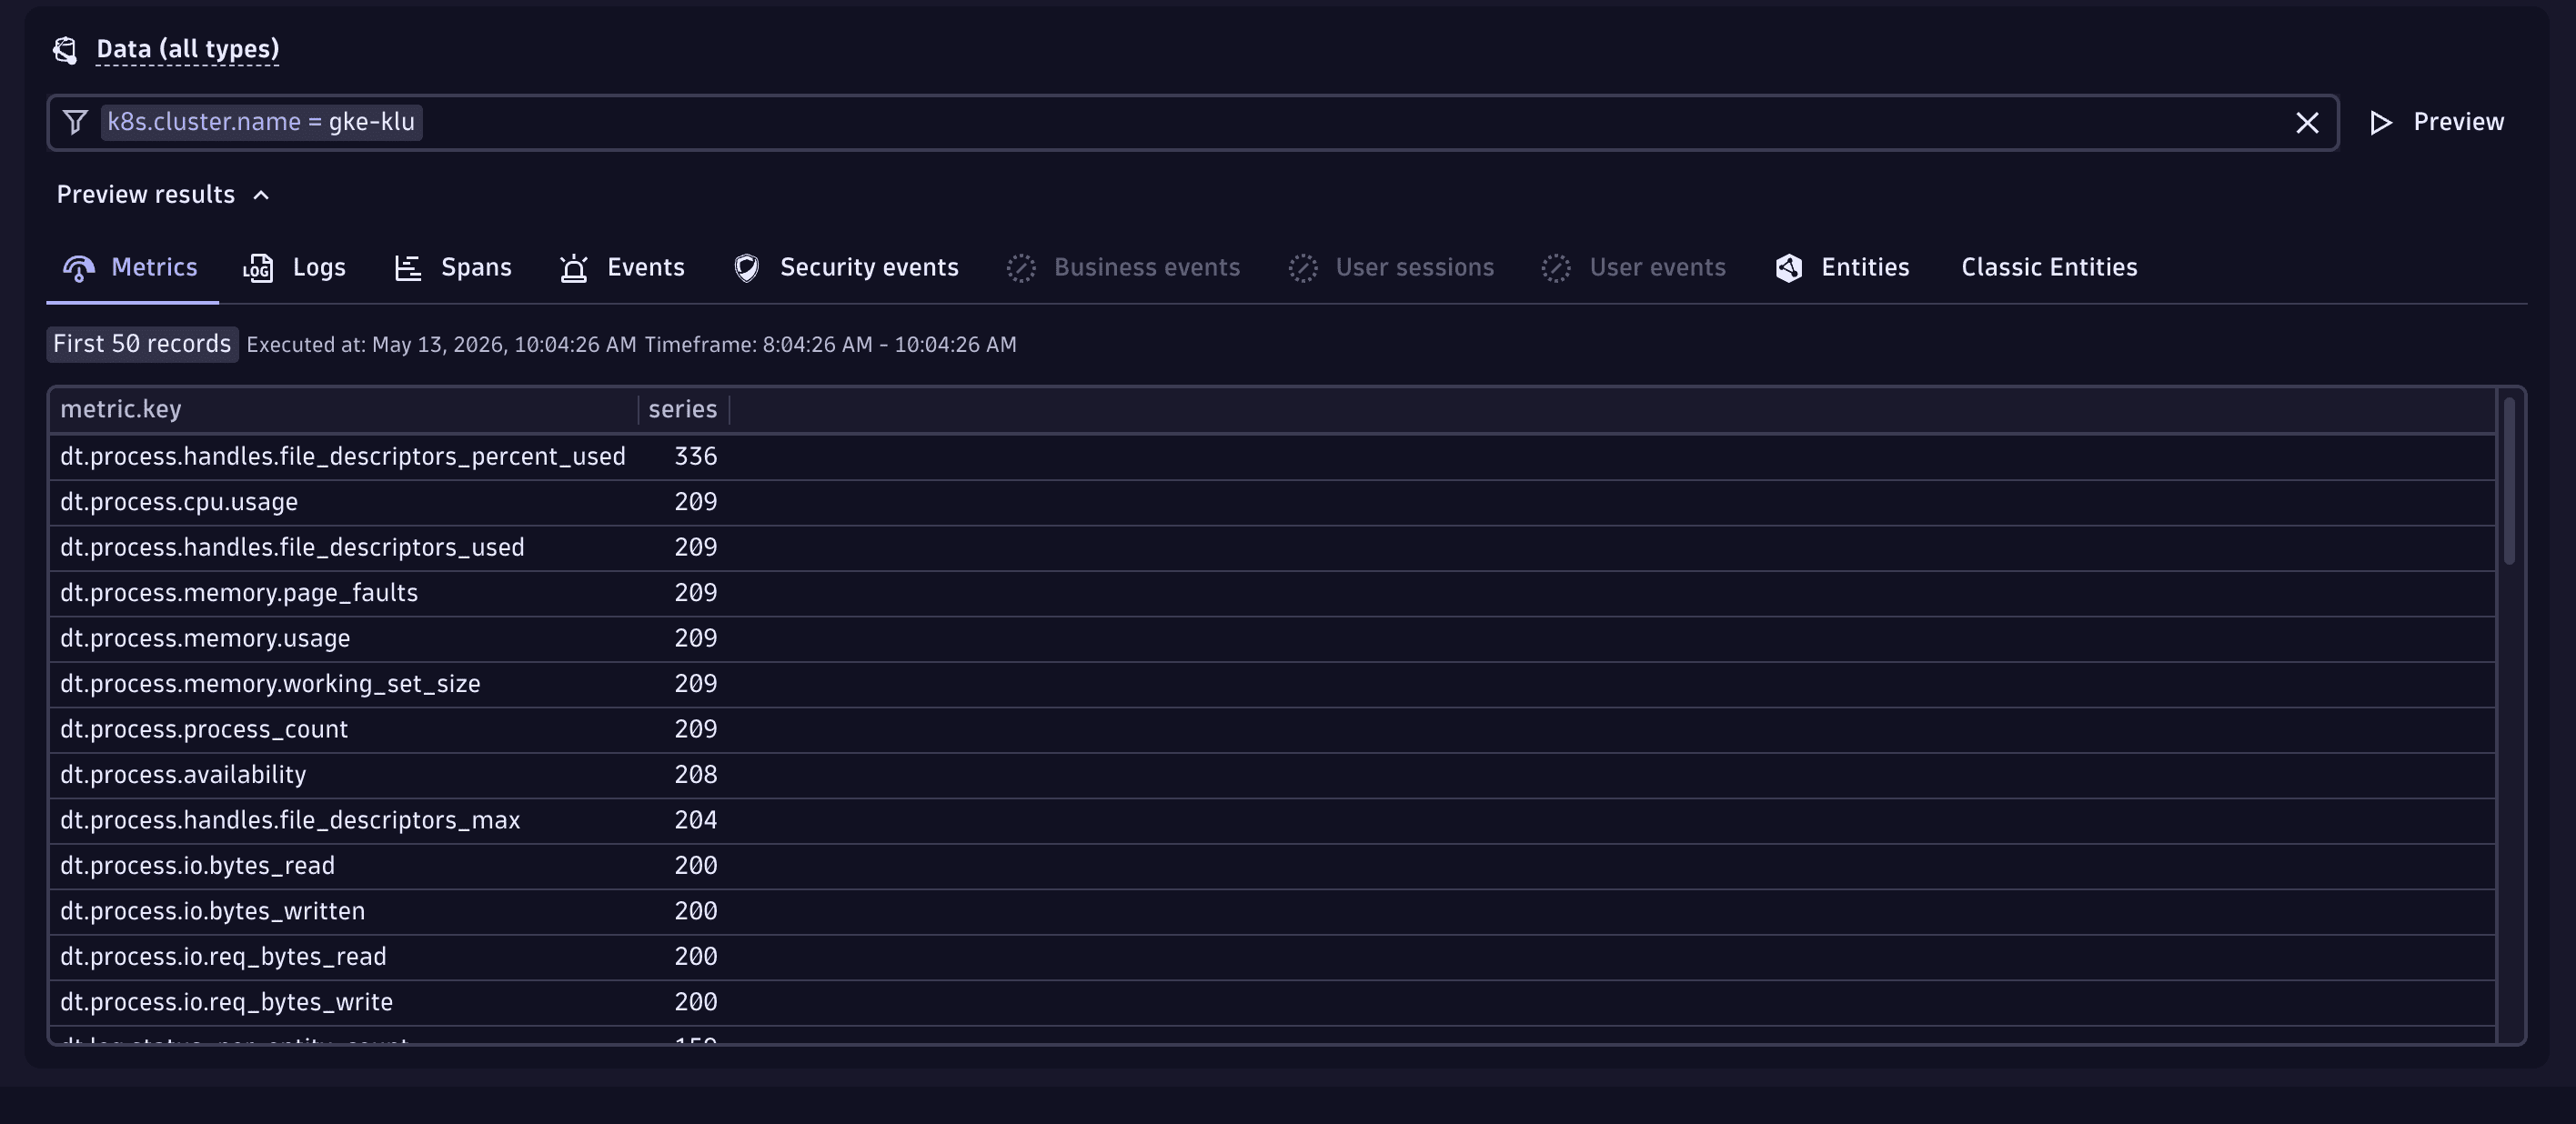
- In the search field, add filter conditions such as
k8s.cluster.name = gke-klu. - Select Run query to get a preview of matching data.
- Select Save to save your changes.
3. Analyze health and performance of entire stack
In this step, we show how to
- Analyze general health of our stack in
 Problems
 - Analyze health and performance of services of our stack in
 Services
 - Analyze Kubernetes workloads of our stack in
 Dashboards
Problems
To analyze general health of our stack in Problems
- Go to Problems
- Open the segment selector and, in Filter by segments, select the previously created segment.
- Select Apply to finish segment selection.
- Select Refresh to refresh the problems list.
Services
To analyze health and performance of services of our stack in Services
- Go to Services and select Explorer tab.
- Open the segment selector and, in Filter by segments, select the previously created segment.
- Select Apply to finish segment selection.
Dashboards
To analyze Kubernetes workloads of our stack in Dashboards
- Go to Dashboards and select Ready-made dashboards.
- In the search bar, find Kubernetes Namespaces - Workloads to open the ready-made dashboard.
- Open the segment selector and, in Filter by segments, select the previously created segment.
- Open the dashboard filter Cluster to find clusters filtered for selected segment.
Applying a segment to dashboards will filter for data explicitly included in segment. Some tiles may no longer show results because queried data isn't included in the applied segment.
Conclusion
You’ve configured a segment for a set of Kubernetes clusters that form a common stack. You’ve learned how segments can be applied to conveniently filter data in different apps. You've seen an example how to analyze health and performance of a monitoring environment without having to write or understand a single line of DQL yourself.
Just as for Kubernetes clusters, segments can also be built with the context of Kubernetes namespaces. Simply use k8s.namespace.name and select all related entities of Kubernetes namespaces (dt.entity.cloud_application_namespace) instead.