Calculate your consumption of Infrastructure Monitoring (DPS)
- Latest Dynatrace
- Explanation
- 1-min read
Dynatrace OneAgent can be configured for Infrastructure Monitoring mode, which provides comprehensive host monitoring for physical and virtual hosts.
In addition to all features of Foundation & Discovery, Infrastructure Monitoring also includes detailed process performance metrics, disk performance metrics, process-to-process network analysis, and per process memory analysis. Dynatrace Extensions can be enabled on hosts with Infrastructure Monitoring mode and may consume custom metric data points and Log Analytics.
Host hours
The unit of measure for calculating consumption of host monitoring in Infrastructure Monitoring mode is a host-hour. Each instance of Dynatrace OneAgent installed and running on an operating system instance (deployed on, for example, a physical or virtual machine) with Infrastructure Monitoring mode enabled consumes host hours. The longer that a host is monitored, the more host-hours you consume. Consumption is independent from a host's memory size.
Billing granularity for host-hour consumption
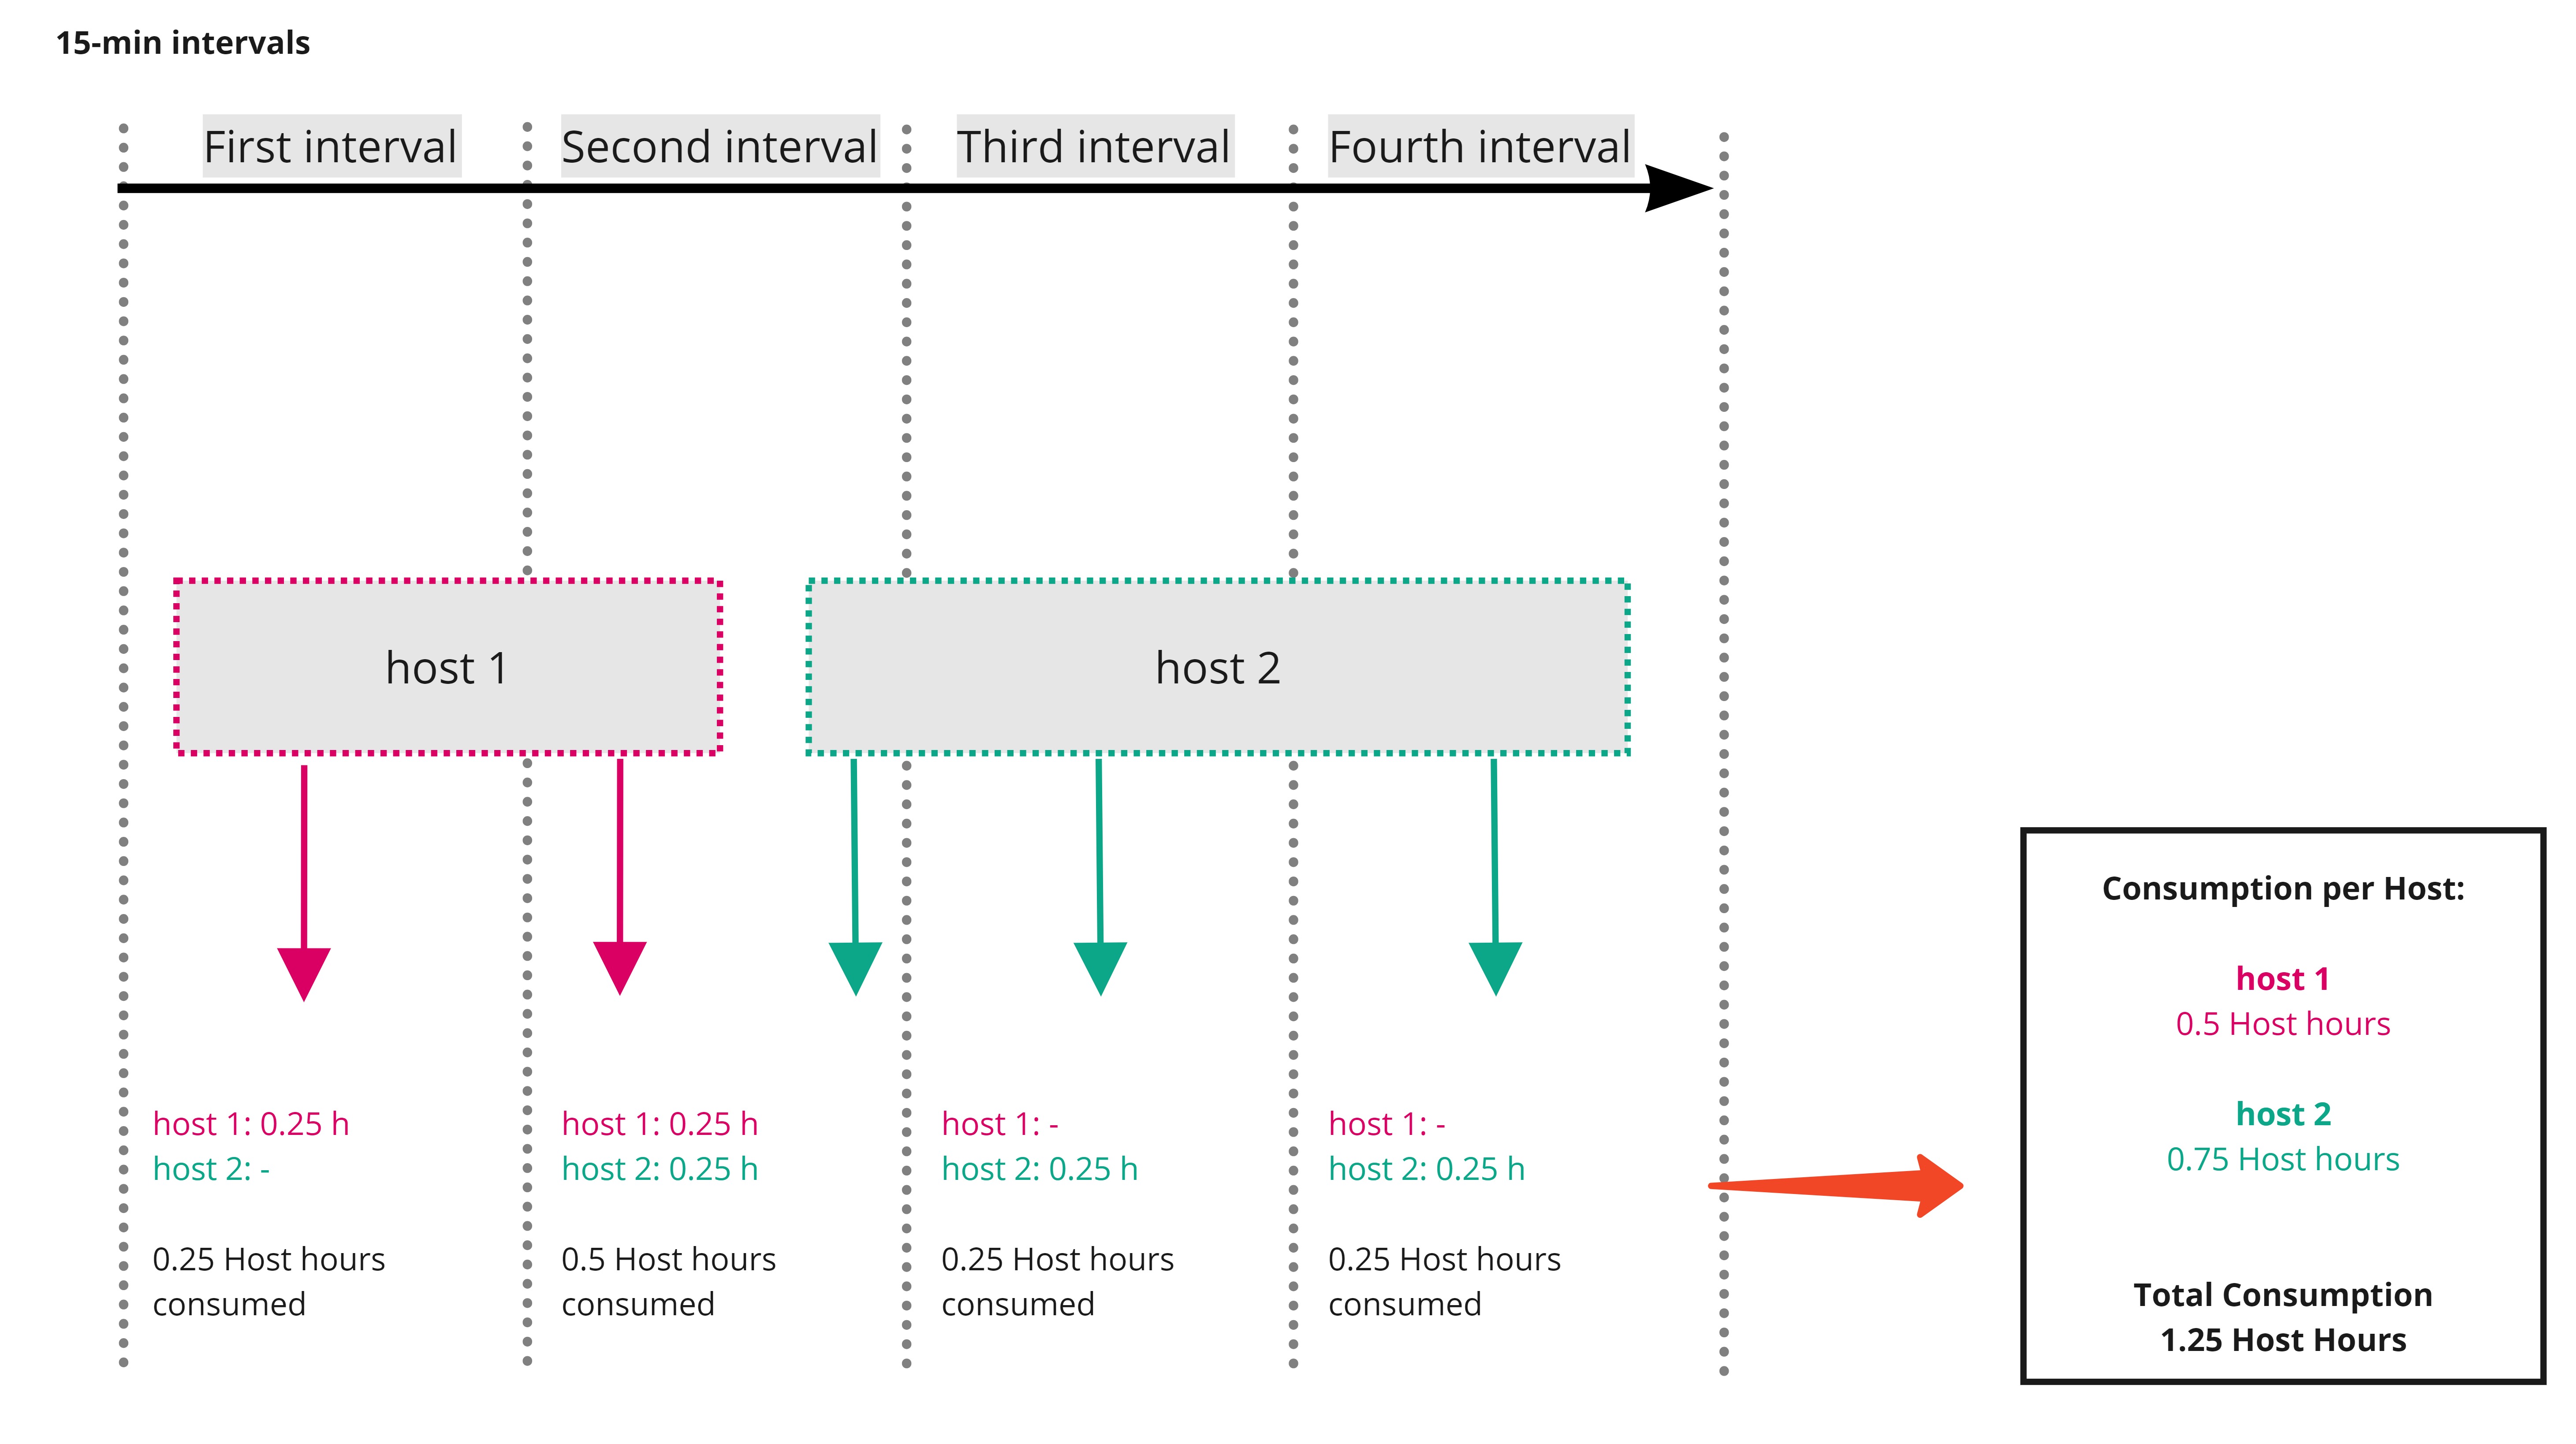
Dynatrace is built for dynamic cloud-native environments where hosts and services are rapidly spun up and destroyed. Therefore, billing granularity for host-hour consumption is calculated in 15-minute intervals. When a host is monitored for fewer than 15 minutes in an interval, host-hour consumption is rounded up to 15 minutes before consumption is calculated.
The figure below illustrates how host-hour consumption per host is calculated at 15-minute intervals.
Metrics
This section assumes that you have followed the Dynatrace-recommended deployment options. If you implement a custom deployment, the charging of included metrics may still work as described—but this is not guaranteed by Dynatrace.
Dynatrace Infrastructure Monitoring includes Infrastructure Monitoring metrics and other built-in metrics. These metrics are included and never produce any charge.
Infrastructure Monitoring also includes a defined amount of custom metric data points. Every host adds 1,500 custom metric data points in each 15-minute interval. Included metric data points that are not consumed within the 15-minute interval in which they are granted do not roll over to subsequent intervals. Your environment's included metric data points are applied automatically to metrics that originate at hosts that are monitored by OneAgent in Infrastructure Monitoring mode. This applies to custom metrics as described in the table below.
Metric data points that exceed your included volume are charged as:
- If Metrics powered by Grail exists on your rate card, these are charged as Metrics powered by Grail.
- If Metrics powered by Grail does not exist on your rate card, these are charged as Custom Metrics Classic.
| Origin | Examples (including but not limited to) |
|---|---|
An Infrastructure-monitored host and sent via the OneAgent metric API |
|
An Infrastructure-monitored Kubernetes node |
|
Metric data points sent via the Dynatrace Collector are included only if Metrics powered by Grail overview (DPS) exists on your rate card.
Metric data points sent via the OpenTelemetry Collector are included only if Metrics powered by Grail overview (DPS) exists on your rate card and the OpenTelemetry Collector has been configured as described in Enrich OTLP requests with Kubernetes data.
Looking at Figure 2 above, the included custom metric data point volume for the four 15-minute intervals is shown below.
Included custom metric data points calculation example
- First 15-minute interval:
1 (hosts monitored) × 1,500 (metric data points) = 1,500 Included custom metric data points - Second 15-minute interval:
2 (hosts monitored) × 1,500 (metric data points) = 3,000 Included custom metric data points - Third 15-minute interval:
1 (hosts monitored) × 1,500 (metric data points) = 1,500 Included custom metric data points - Fourth 15-minute interval:
1 (hosts monitored) × 1,500 (metric data points) = 1,500 Included custom metric data points
How custom metric data points are consumed in Infrastructure Monitoring mode
Custom metric data point consumption takes many forms. An equal number of custom metric data points can be consumed:
- By a few high-resolution metrics or numerous low-resolution metrics.
- Equally across multiple 15-minute intervals or all at once in a single minute.
- By all Infrastructure-monitored hosts, a subset of all Infrastructure-monitored hosts, or a single infrastructure-monitored host.
Consumption details: Infrastructure
Dynatrace provides built-in usage metrics that help you understand and analyze your organization's consumption of Infrastructure Monitoring.
To use these metrics, in  Data Explorer, enter
 DPS in the Search field.
These metrics are also available via the Environment API and in Account Management (Usage summary > Infrastructure Monitoring > Actions > View details)
.
Here is the list of metrics you can use to monitor the consumption details for Infrastructure Monitoring.
- (DPS) Infrastructure Monitoring billing usage
Key:
builtin:billing.infrastructure_monitoring.usageDimension: Count
Resolution: 15 min
Description: Total number of host hours consumed in Infrastructure Monitoring mode.
- (DPS) Infrastructure Monitoring billing usage per host
Key:
builtin:billing.infrastructure_monitoring.usage_per_hostDimension: Host (
dt.entity.host)Resolution: 15 min
Description: Consumed host hours in Infrastructure Monitoring mode per host.
- (DPS) Total metric data points reported by Infrastructure hosts
Key:
builtin:billing.infrastructure_monitoring.metric_data_points.ingestedDimension: Count
Resolution: 15 min
Description: Number of metric data points consumed by all Infrastructure-monitored hosts.
- (DPS) Metric data points reported and split by Infrastructure hosts
Key:
builtin:billing.infrastructure_monitoring.metric_data_points.ingested_by_hostDimension: Host (
dt.entity.host)Resolution: 15 min
Description: Number of metric data points, split by Infrastructure-monitored hosts.
- (DPS) Available included metric data points for Infrastructure-monitored hosts
Key:
builtin:billing.infrastructure_monitoring.metric_data_points.includedDimension: Count
Resolution: 15 min
Description: Total number of included metric data points deductible from the metric data points reported by all Infrastructure-monitored hosts.
- (DPS) Consumed included metric data points for Infrastructure hosts
Key:
builtin:billing.infrastructure_monitoring.metric_data_points.included_usedDimension: Count
Resolution: 15 min
Description: Number of consumed included metric data points for Infrastructure-monitored hosts.
- (DPS) Total metric data points billed for Infrastructure hosts
Key:
builtin:billing.custom_metrics_classic.usage.infrastructure_hostsDimension: Count
Resolution: 15 min
Description: Number of metric data points billed for all Infrastructure-monitored hosts.
Monitor host-hour consumption
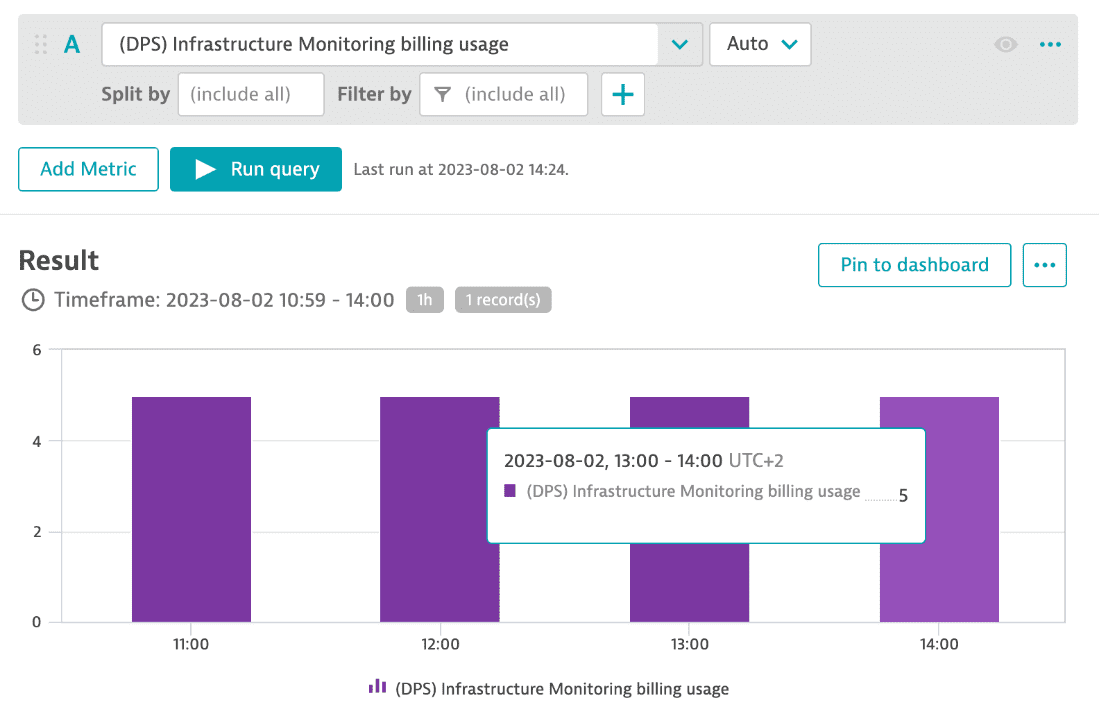
You can monitor the total host-hour consumption for different intervals (15 min, hour, day, or week) for any selected timeframe using the "(DPS) Infrastructure Monitoring billing usage" metric. The example below shows that 5 hosts were monitored, leading to total consumption of 5 host-hours for each hour.
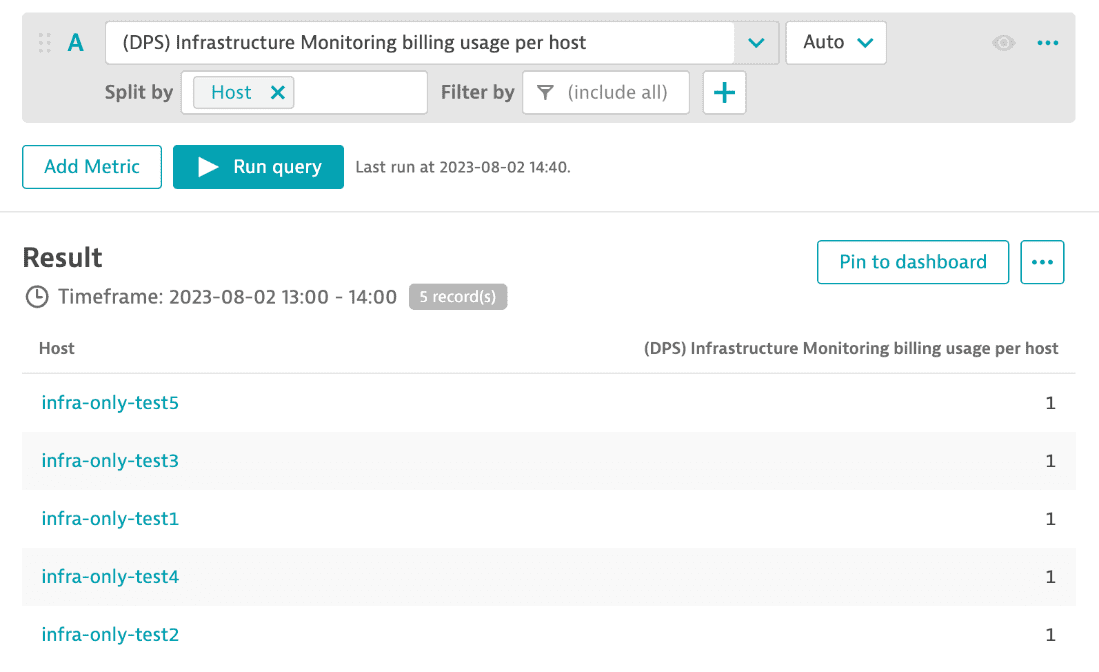
You can split the total host hour consumption using the metric "(DPS) Infrastructure Monitoring billing usage per host". The example below shows the list of all hosts that reported consumption.
Monitor metric consumption for Infrastructure monitored hosts
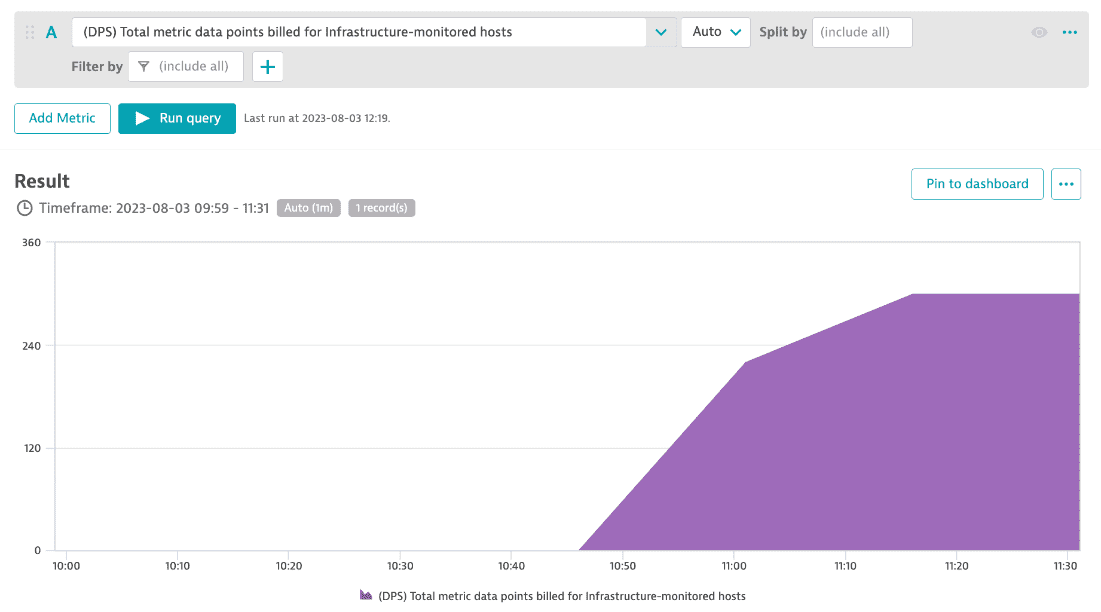
Use the metric "(DPS) Total metric data points billed for Infrastructure hosts" to monitor the number of metric data points that are billed for Infrastructure monitored hosts, as shown in the example below.
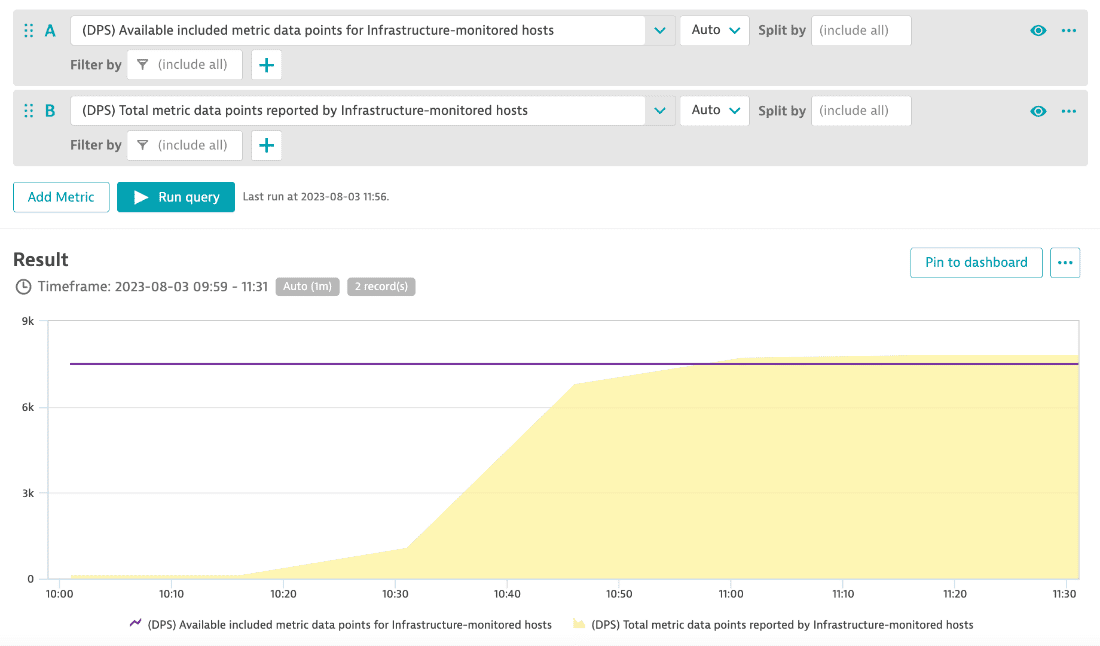
To manage your metrics budget, you can monitor the number of available included metric data points against the number of total consumed metrics data points using these two metrics: "(DPS) Available included metric data points for Infrastructure hosts" and "(DPS) Total metric data points reported by Infrastructure hosts". The example below shows that more metric data points were consumed that were included with these Infrastructure monitored hosts.
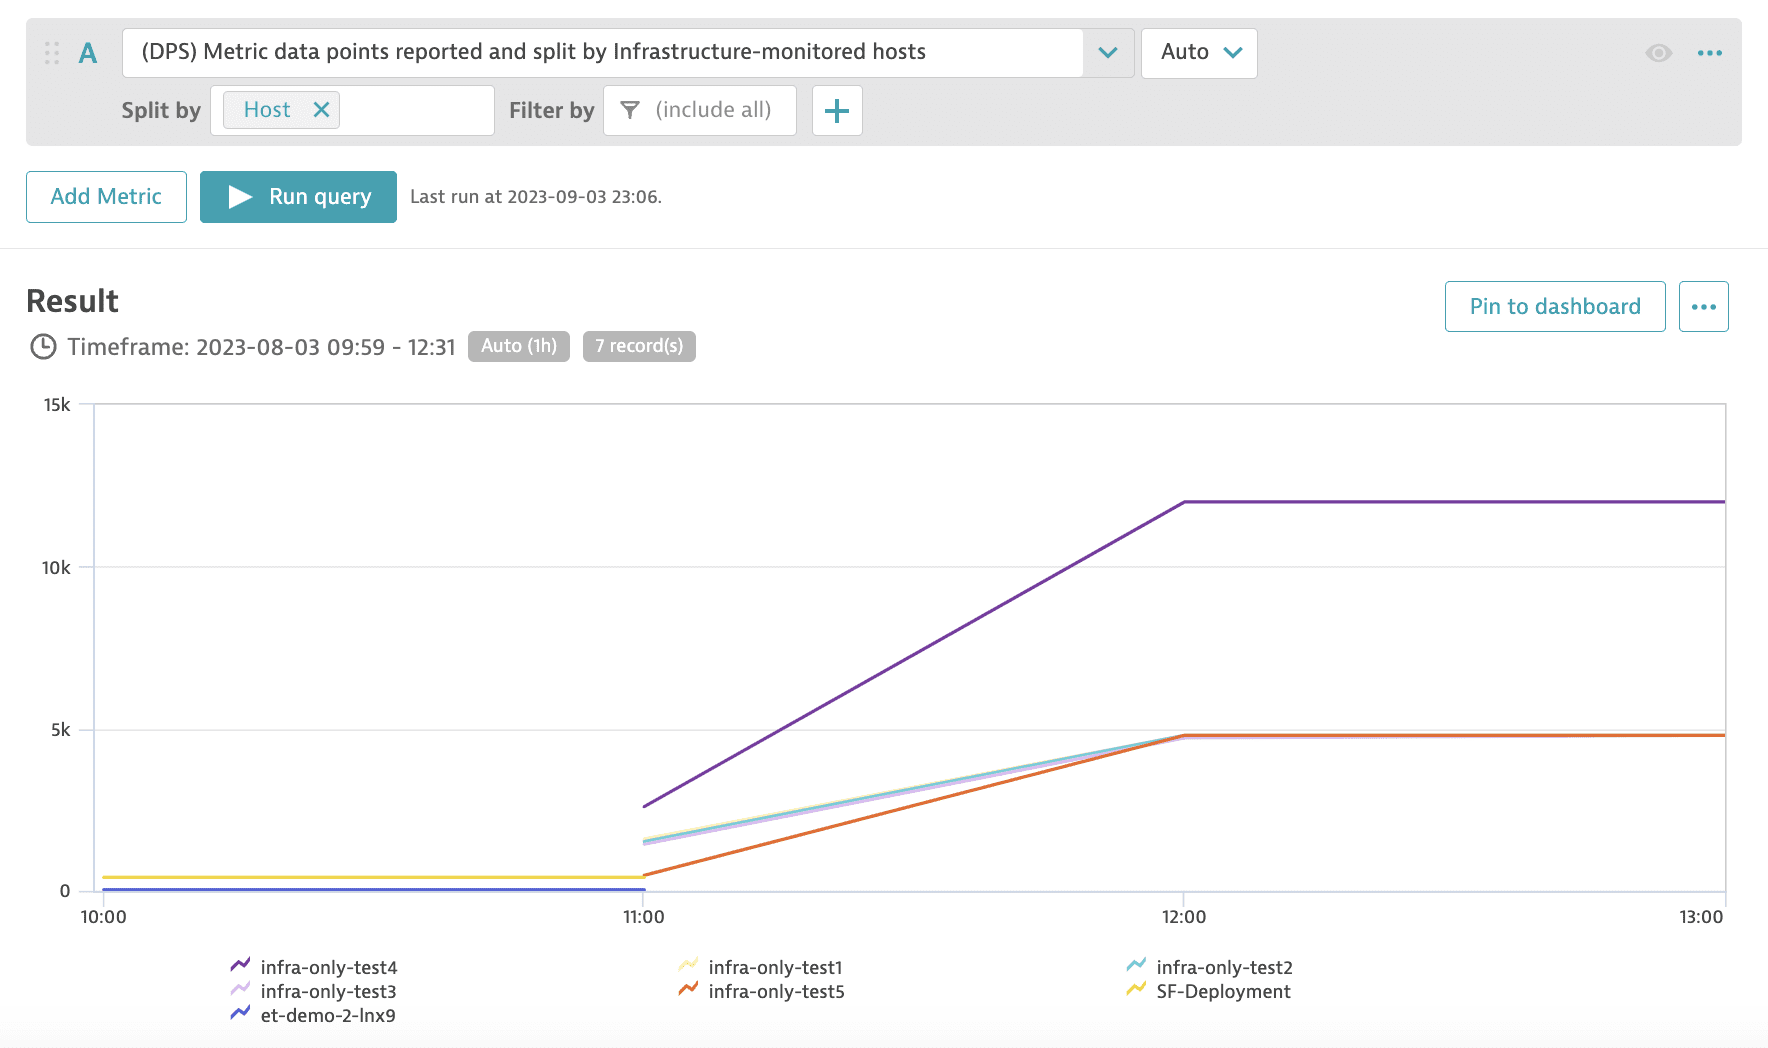
You can use the metric "(DPS) Metric data points reported and split by Infrastructure hosts" to track the number of metric data points consumed per Infrastructure monitored host. The split view helps in discovering the hosts that consume the most metric data points. The example below shows that one of the Infrastructure monitored hosts reported significantly more metrics data points than the others.