Application observability
- Latest Dynatrace
- 3-min read
Application observability focuses on monitoring application-level metrics by injecting code modules into application Pods. This mode offers multiple injection strategies (automatic, runtime, and build-time) to collect application-specific metrics. For infrastructure-level insights, combine it with Kubernetes platform monitoring.
See .spec.oneAgent.applicationMonitoring section of DynaKube for additional information.
Automatic injection
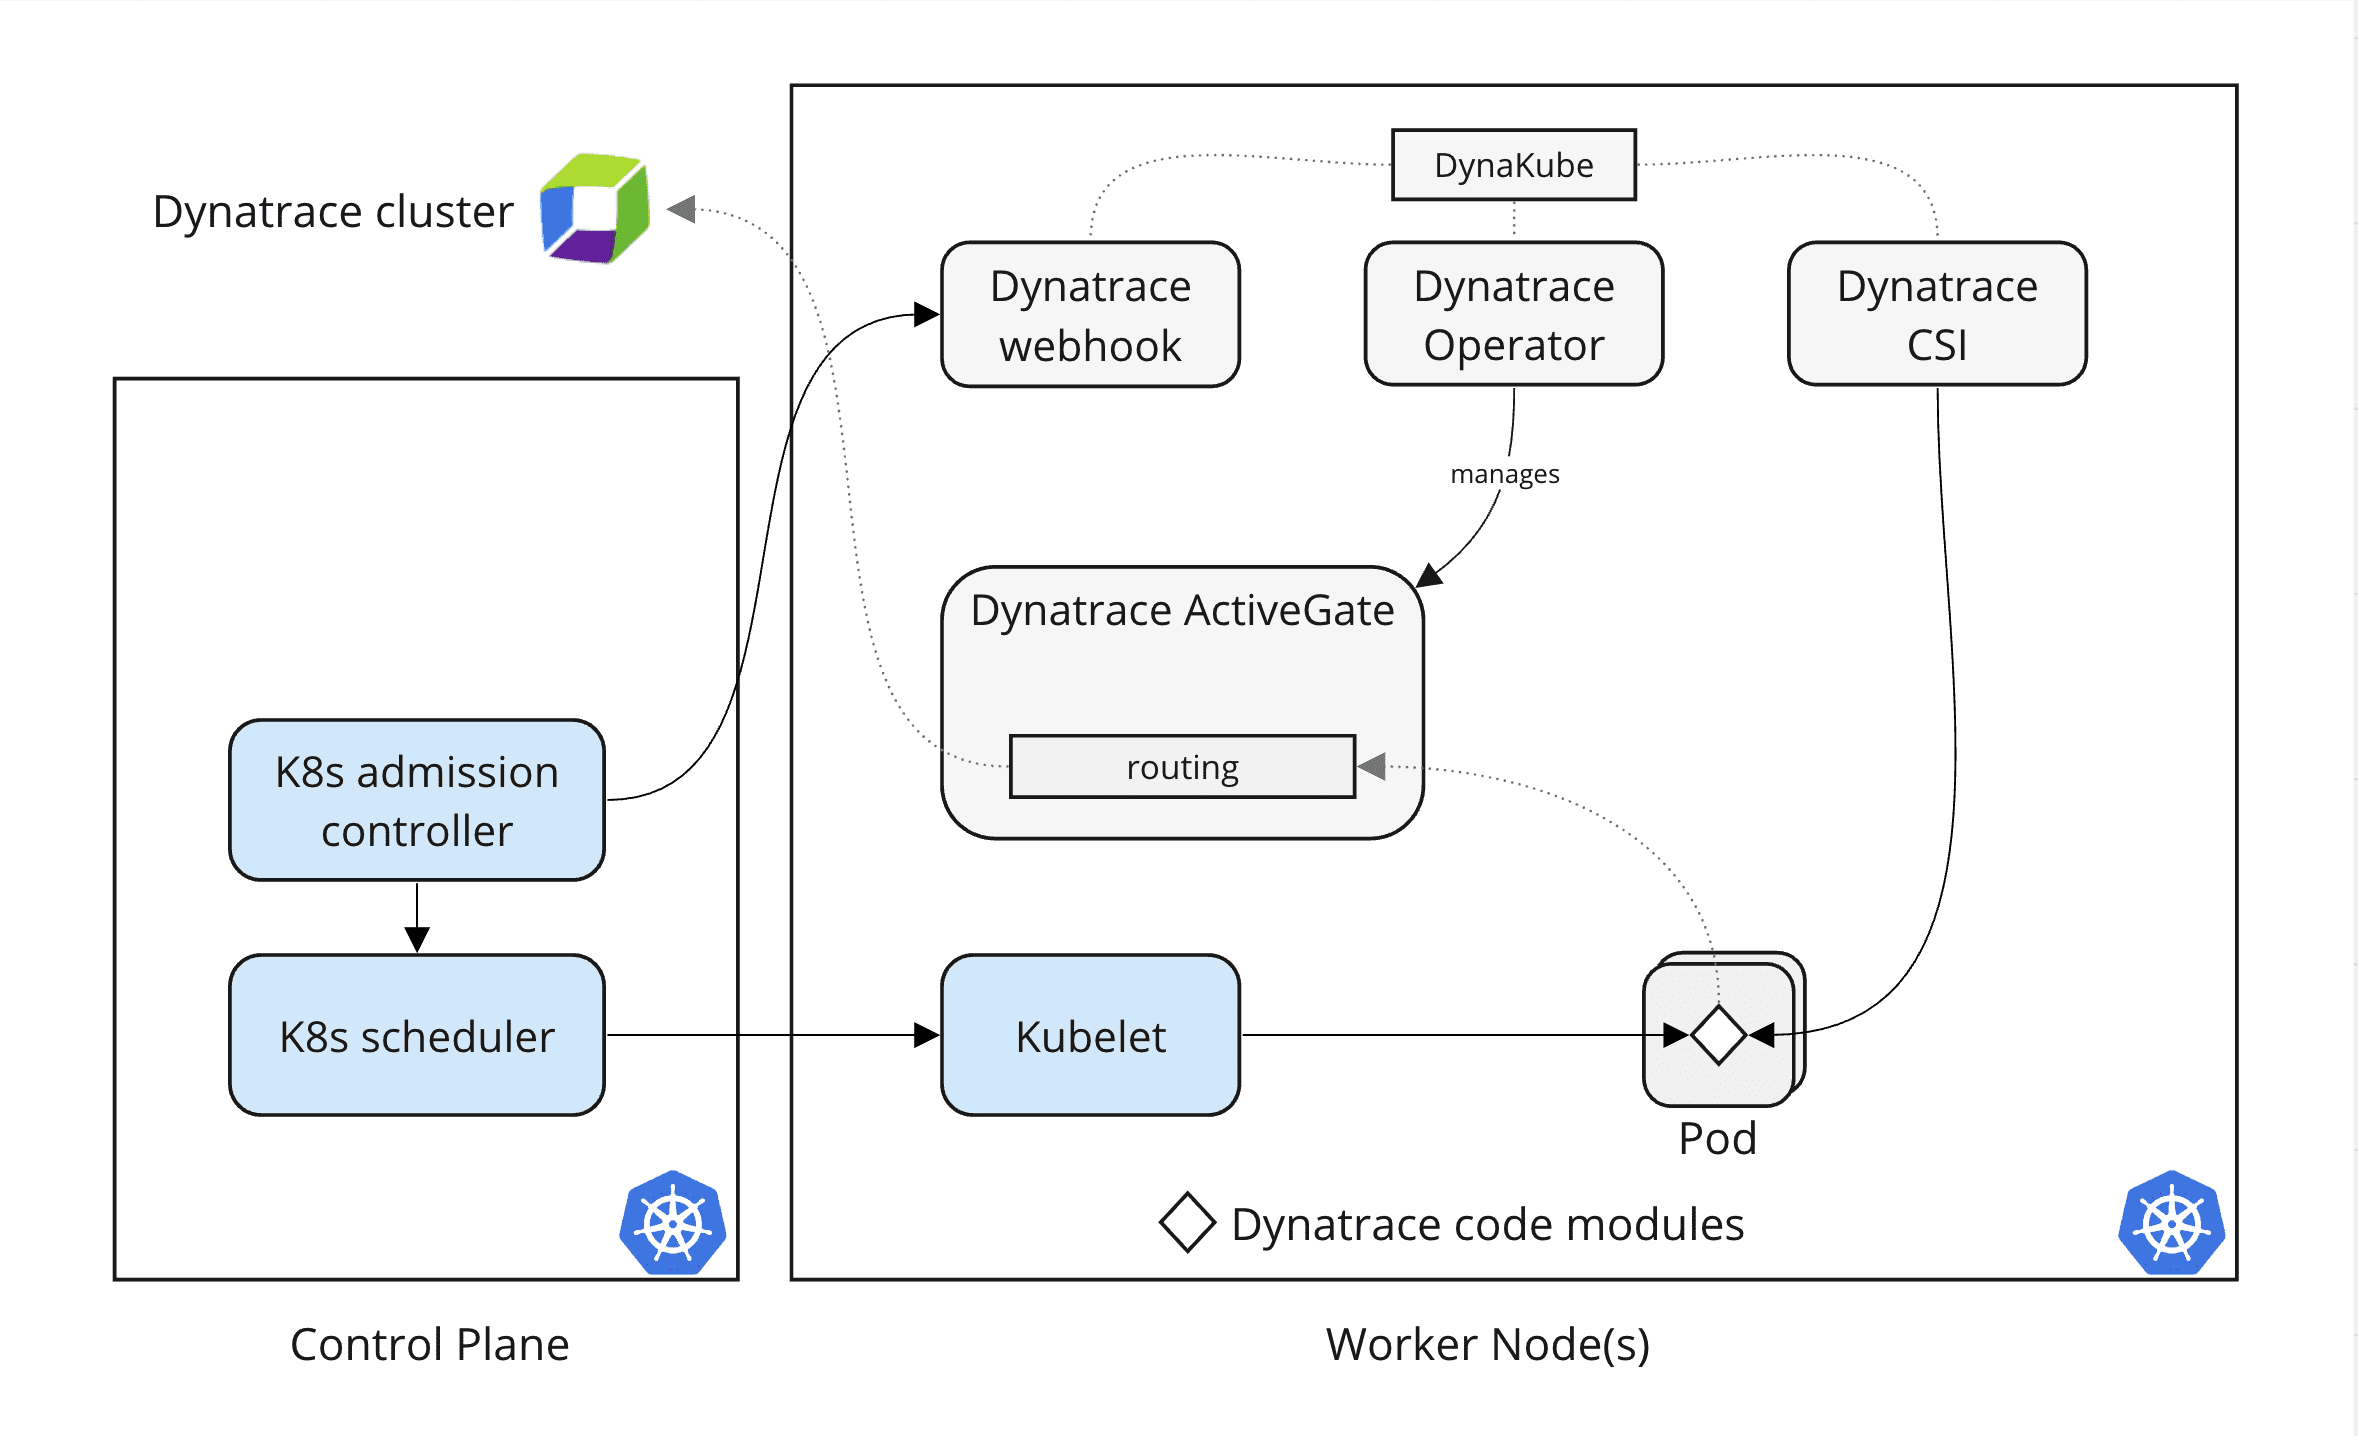
You can use the automatic injection strategy for application Pods. Dynatrace injects code modules into Pods using the Kubernetes admission controller. This approach allows you to collect application-specific metrics and monitor container-level metrics.
Capabilities
- Dynatrace injects code modules into Pods using the Kubernetes admission controller.
- Get granular control over the instrumented Pods using namespaces and annotations.
- Route Pod metrics to different Dynatrace environments within the same Kubernetes cluster.
- Enable data enrichment for Kubernetes environments.
Current limitations
- Diagnostic files (support archives) for application Pods aren't yet supported.
- Go static monitoring is partially supported.
- On AKS, the AKS admissions enforcer adds namespaceSelector expressions to every webhook that explicitly exclude AKS-managed namespaces (such as kube-system), causing code module injection to be skipped in those namespaces.
When deployed in application monitoring, Dynatrace code modules monitor processes within the container, including disk, CPU, and networking metrics. Host metrics are not monitored. Without Kubernetes Platform Monitoring, topology is limited to Pods and containers.
Deployed resources
The following components are deployed via Helm/Manifests as part of the core installation. For more information, go to their respective sections:
- Dynatrace Operator manages the automated rollout, configuration, and lifecycle of Dynatrace components in your Kubernetes environment.
- Dynatrace Operator webhook validates DynaKube definitions, converts definitions with older API versions, and injects configurations into Pods.
- Dynatrace Operator CSI Driver Optional, deployed as a DaemonSet, provides writable volume storage for OneAgent binaries to minimize network and storage usage.
The following component is deployed by applying a DynaKube with Application observability:
- Dynatrace ActiveGate routes observability data to the Dynatrace cluster.
- Dynatrace code modules are injected into your application to enable deep monitoring and observability.
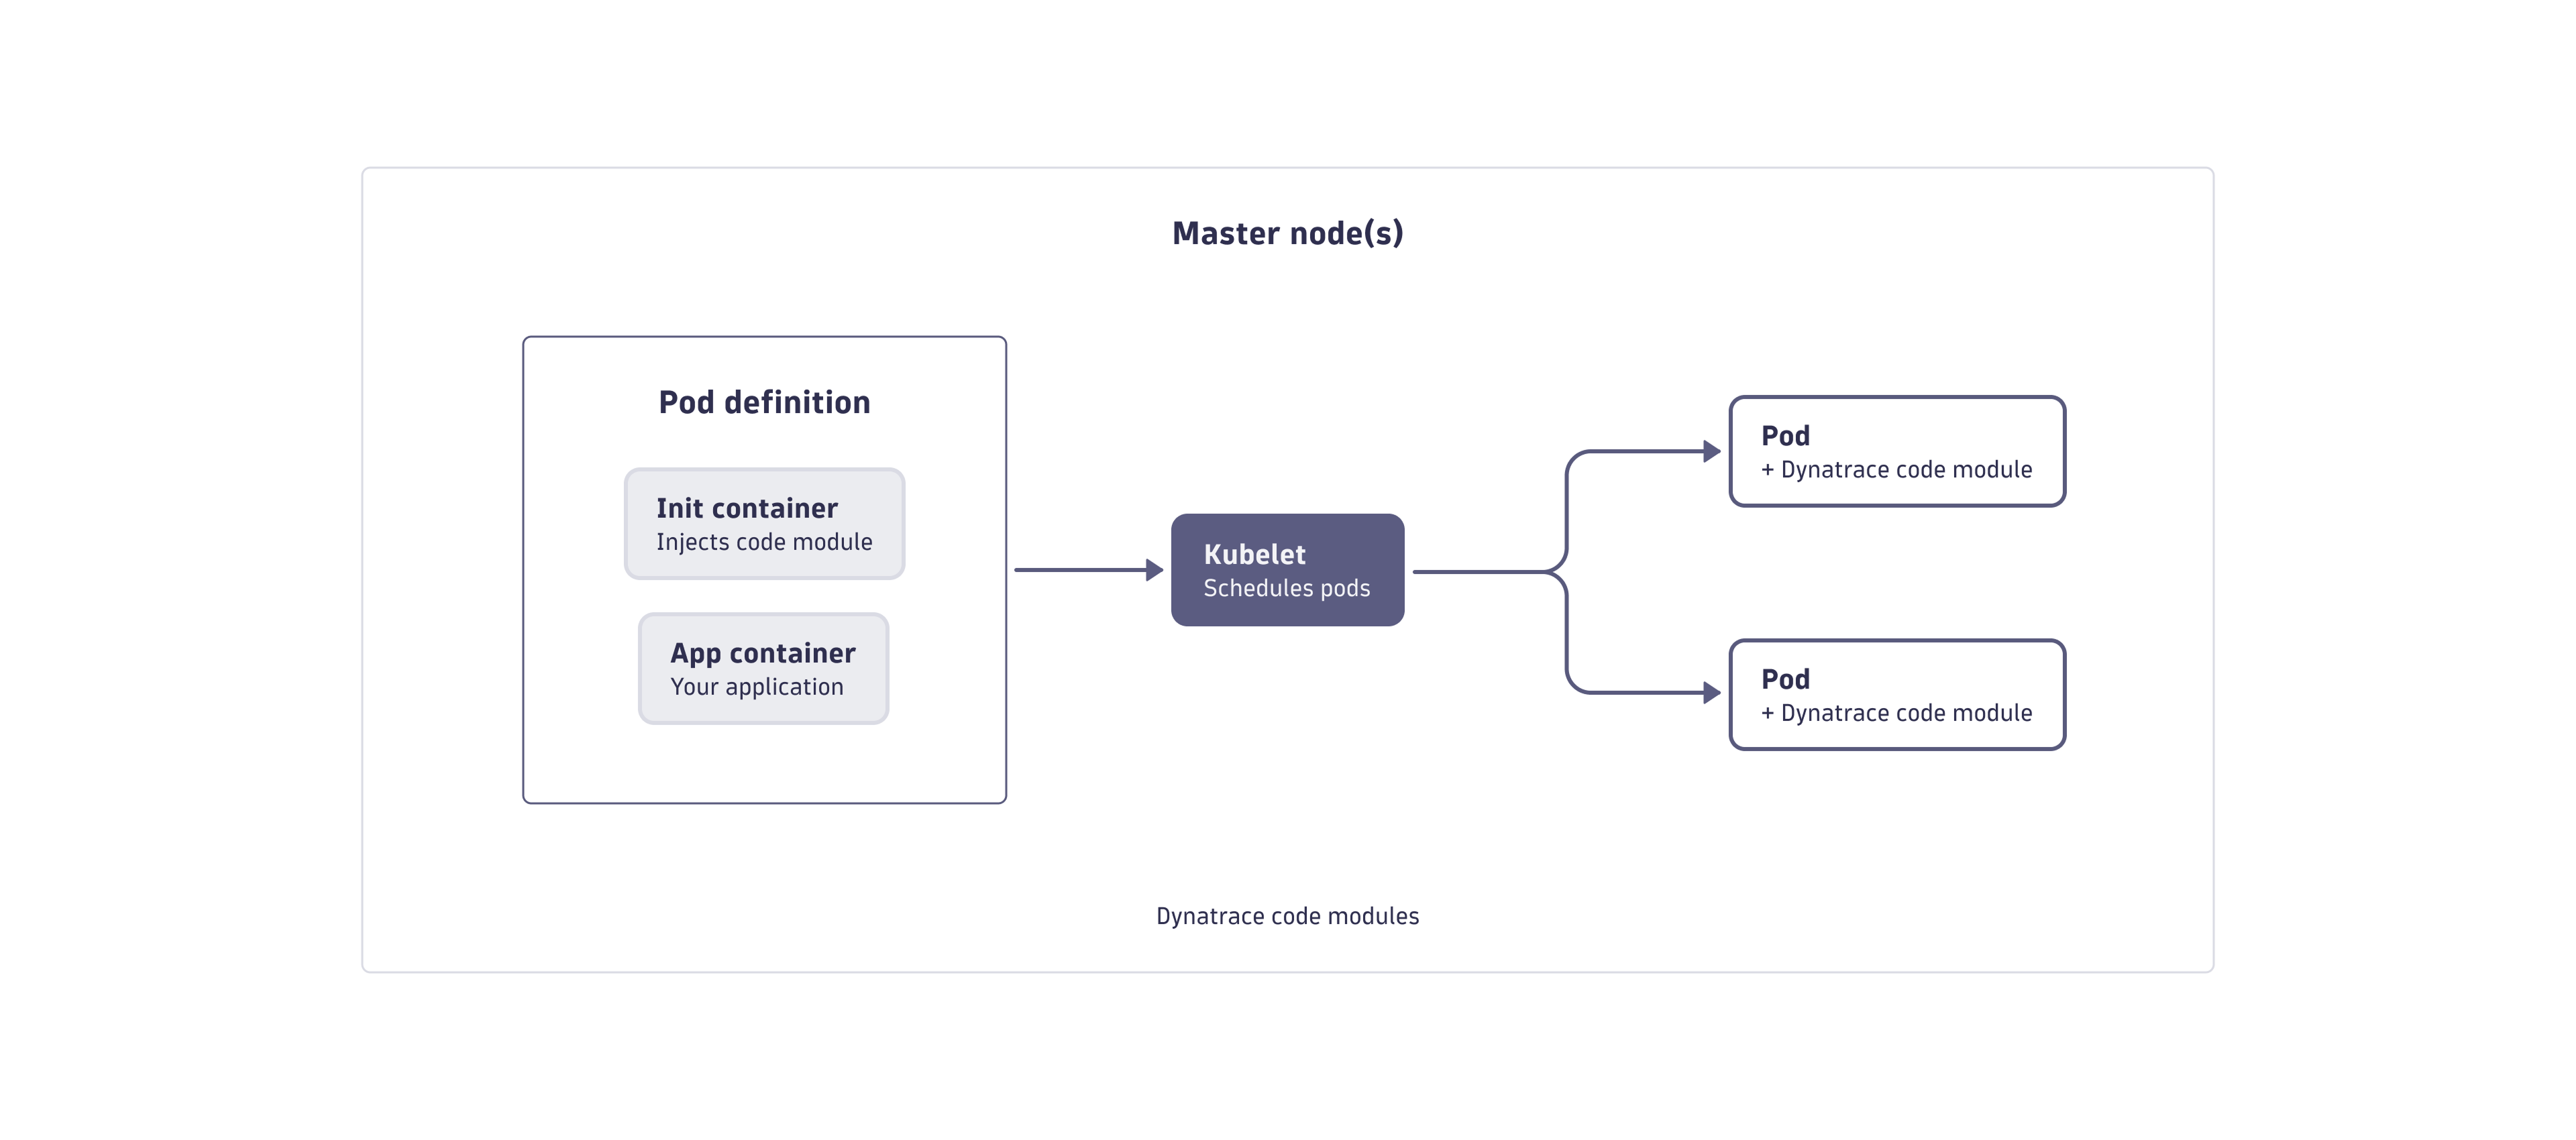
Pod runtime injection
You can use the application monitoring for application Pods. You don't install OneAgent Pods and can't collect host metrics from Kubernetes nodes.
Capabilities
- Dynatrace code modules are injected into Pods using Kubernetes init containers.
- Different container images can have separate configurations for different Dynatrace environments.
Limitations
Because Dynatrace Operator is not involved, no automatic injection, configuration, or enrichment occurs. You need to manually adjust your Kubernetes workloads.
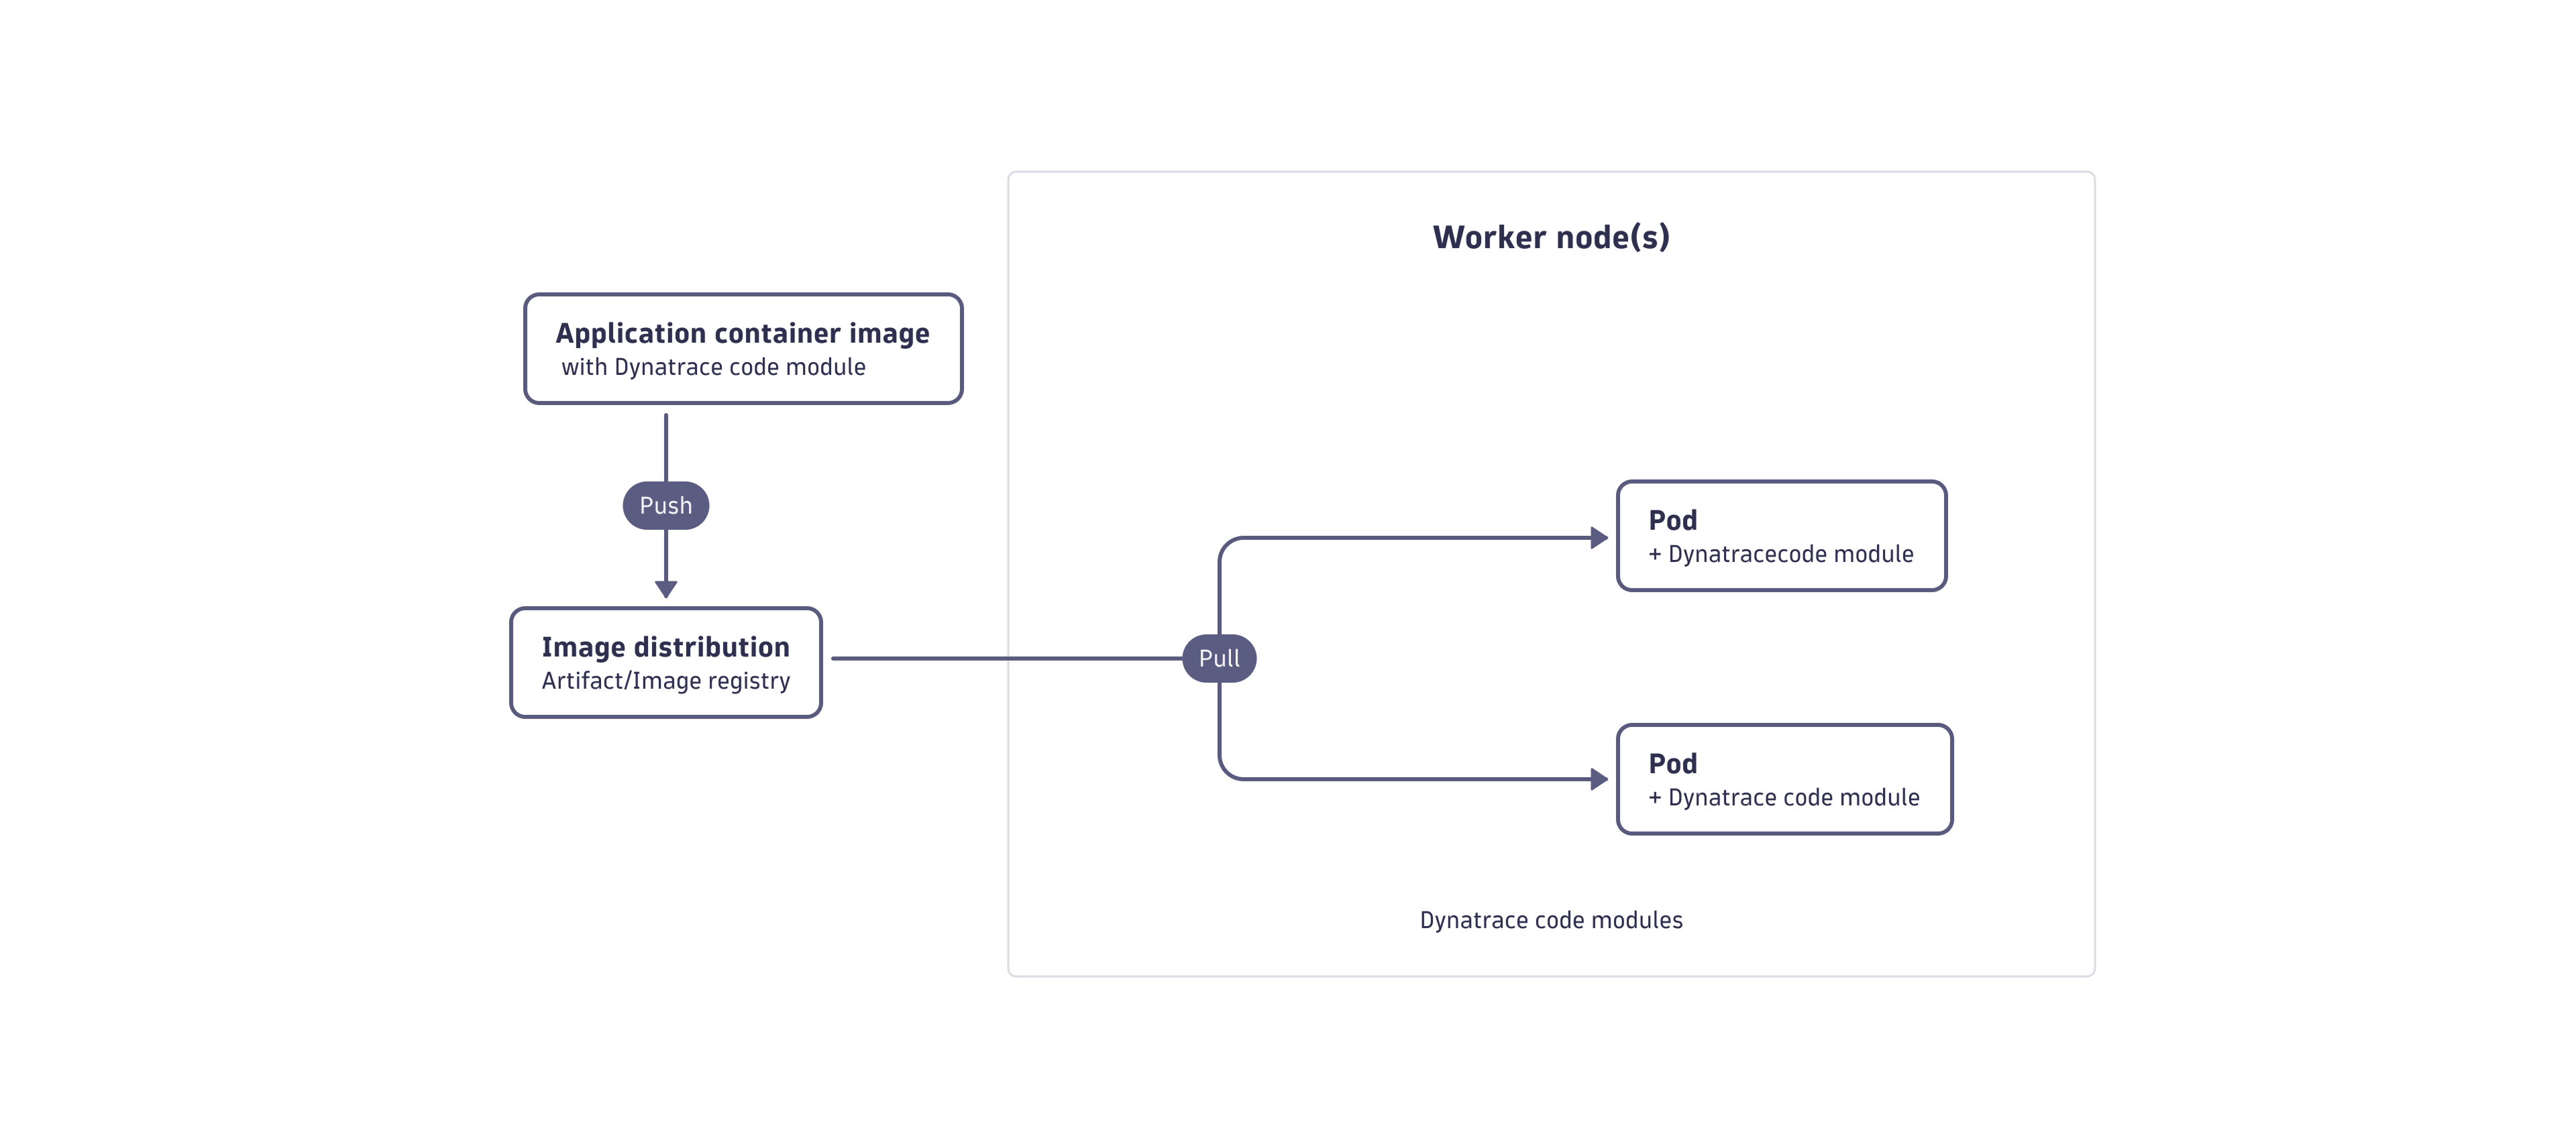
Container build-time injection
You can use the application monitoring for application Pods. You don't install OneAgent Pods and can't collect host metrics from Kubernetes nodes.
Capabilities
- Dynatrace code modules are embedded into container images during the build process.
- Different container images can be configured for different Dynatrace environments and used across any container platform or PaaS in addition to Kubernetes.
Limitations
Without Dynatrace Operator, there is no automatic injection, configuration, or enrichment. You need to manually adapt your build process.