Configure OpenTelemetry tracing with Istio
- Latest Dynatrace
- How-to guide
- 3-min read
This integration is based on open source code governed by the respective communities and is not covered under the Dynatrace support policy. While we strive to assist, issues and feature requests should be reported directly to the respective project. Dynatrace cannot ensure fixes/features due to the independent nature of OSS projects.
Always use the most recent release version to ensure you have the latest patches and fixes deployed.
This page describes how to use Istio version 1.22+ with the Istio OpenTelemetry extension provider, and how to configure it to export OpenTelemetry traces to Dynatrace.
System requirements
Istio version 1.22+ (i.e., Istio releases that ship with Envoy 1.30+) is required to configure Istio OpenTelemetry trace configuration, including Dynatrace resource detection and sampling.
Licensing impact
In certain deployment setups, tracing with Istio version 1.22+ results in consumption of the following rate card capabilities:
-
When using the Dynatrace resource detector and sampler:
- Classic Full-Stack or cloud-native Full-Stack deployments: Usage is included in Full-Stack Monitoring (DPS) and Host Units (Dynatrace Classic License).
- For Application-Observability-only deployments: Usage incurs consumption of Custom Traces Classic (DPS) or DDUs for custom traces (Dynatrace Classic License).
-
Without the Dynatrace resource detector and sampler: Usage incurs consumption of Custom Traces Classic (DPS) or DDUs for custom traces (Dynatrace Classic License).
Deployment considerations
It's possible to configure Istio OpenTelemetry tracing in a standalone deployment or in combination with Dynatrace Operator.
Deployment in combination with Dynatrace Operator Recommended
We recommend using the Istio OpenTelemetry integration in combination with a Dynatrace Operator deployment with metadata enrichment and telemetry ingest endpoints enabled. Other features like OneAgent or ActiveGate are not required.
This provides the following benefits compared to standalone usage:
- Resilient and more efficient delivery of traces by providing retry and batching capabilities.
- Optional routing through ActiveGate.
- No additional access token required.
- No additional
ServiceEntriesrequired. - Compatibility with Dynatrace Operator
enableIstio.
Standalone deployment
It's possible to ingest Istio traces without a Dynatrace Operator instance deployed, but this comes with major downsides and should only be used if it's not possible to deploy Dynatrace Operator.
Caveats when using standalone deployment:
- No Kubernetes metadata will be available for traces. This means traces will not be automatically correlated with Kubernetes workloads or services in Dynatrace.
- Potentially unreliable delivery of traces. The current implementation of the OTLP HTTP exporter in Envoy doesn't provide any means of retry or error handling in case of connectivity or other issues when sending traces to Dynatrace, which can lead to loss of traces.
- The required
ServiceEntryis not compatible with theenableIstiooption of Dynatrace Operator.
Other deployment considerations
Istio ambient mode
Istio ambient mode support
Istio in ambient mode doesn't rely on Envoy proxies to route traffic, so tracing Istio traffic using the OpenTelemetry integration is not possible. If waypoint proxies are used, those would still emit traces, but the metadata would be misleading or wrong. Currently, there is no solution for end-to-end tracing in Istio ambient mode.
Steps
1. Requirements
Check the following requirements before starting to deploy tracing for Istio.
- Dynatrace Operator is deployed.
- For optimal configuration, follow the guide for deployment alongside Istio.
- Telemetry ingest endpoints are enabled.
2. Get configuration entries
- In Dynatrace Hub, search for
Istio. - Filter by the category Technology.
- Select the Hub entry Istio Service Mesh.
- Select Set up.
- Use the provided and pre-configured snippets to deploy the following items in the next steps:
- Mesh configuration
- Telemetry API
3. Apply the mesh configuration to your Istio installation
To use the telemetry ingest endpoints provided by the Dynatrace OTel Collector, we need to change the snippet obtained in step 2 by removing the API token header and changing the target service.
The resulting configuration should look like this, assuming the default ingest service name:
apiVersion: install.istio.io/v1alpha1kind: IstioOperatorspec:meshConfig:extensionProviders:- name: dynatrace-otelopentelemetry:port: 4318service: "<dynakube-name>-telemetry-ingest.<dynatrace-operator-namespace>" # <-- Please fill in your ingest endpoint servicehttp:path: "/v1/traces"timeout: 10sresource_detectors:dynatrace: {}dynatrace_sampler:tenant: "<your-tenant-id>" # <-- This must not be changed from step 2cluster_id: <cluster-id> # <-- This must not be changed from step 2
Save the file as meshconfig.yaml and apply the configuration using the following command.
istioctl install -f meshconfig.yaml
If you already use your own, custom Mesh configuration, you need to merge its content with the provided snippet. Otherwise, you can use the snippet as-is.
4. Deploy the service entry
This step is only required for standalone deployment. No action required when using Dynatrace Operator.
5. Enable tracing provider
As last configuration step, use the Istio telemetry API to enable the tracing provider.
Save the telemetry API manifest you obtained in step 2 to dt-telemetry.yaml and use kubectl to apply the configuration to the desired namespace.
kubectl apply -n istio-system -f dt-telemetry.yaml
Do not deploy more than one telemetry resource within a given namespace, as doing so may lead to configuration conflicts and incomplete tracing information.
If you require different telemetry resources, deploy them to different namespaces or using different selectors.
Make sure to restart all applicable Kubernetes pods, to let the changes to the mesh configuration take effect.
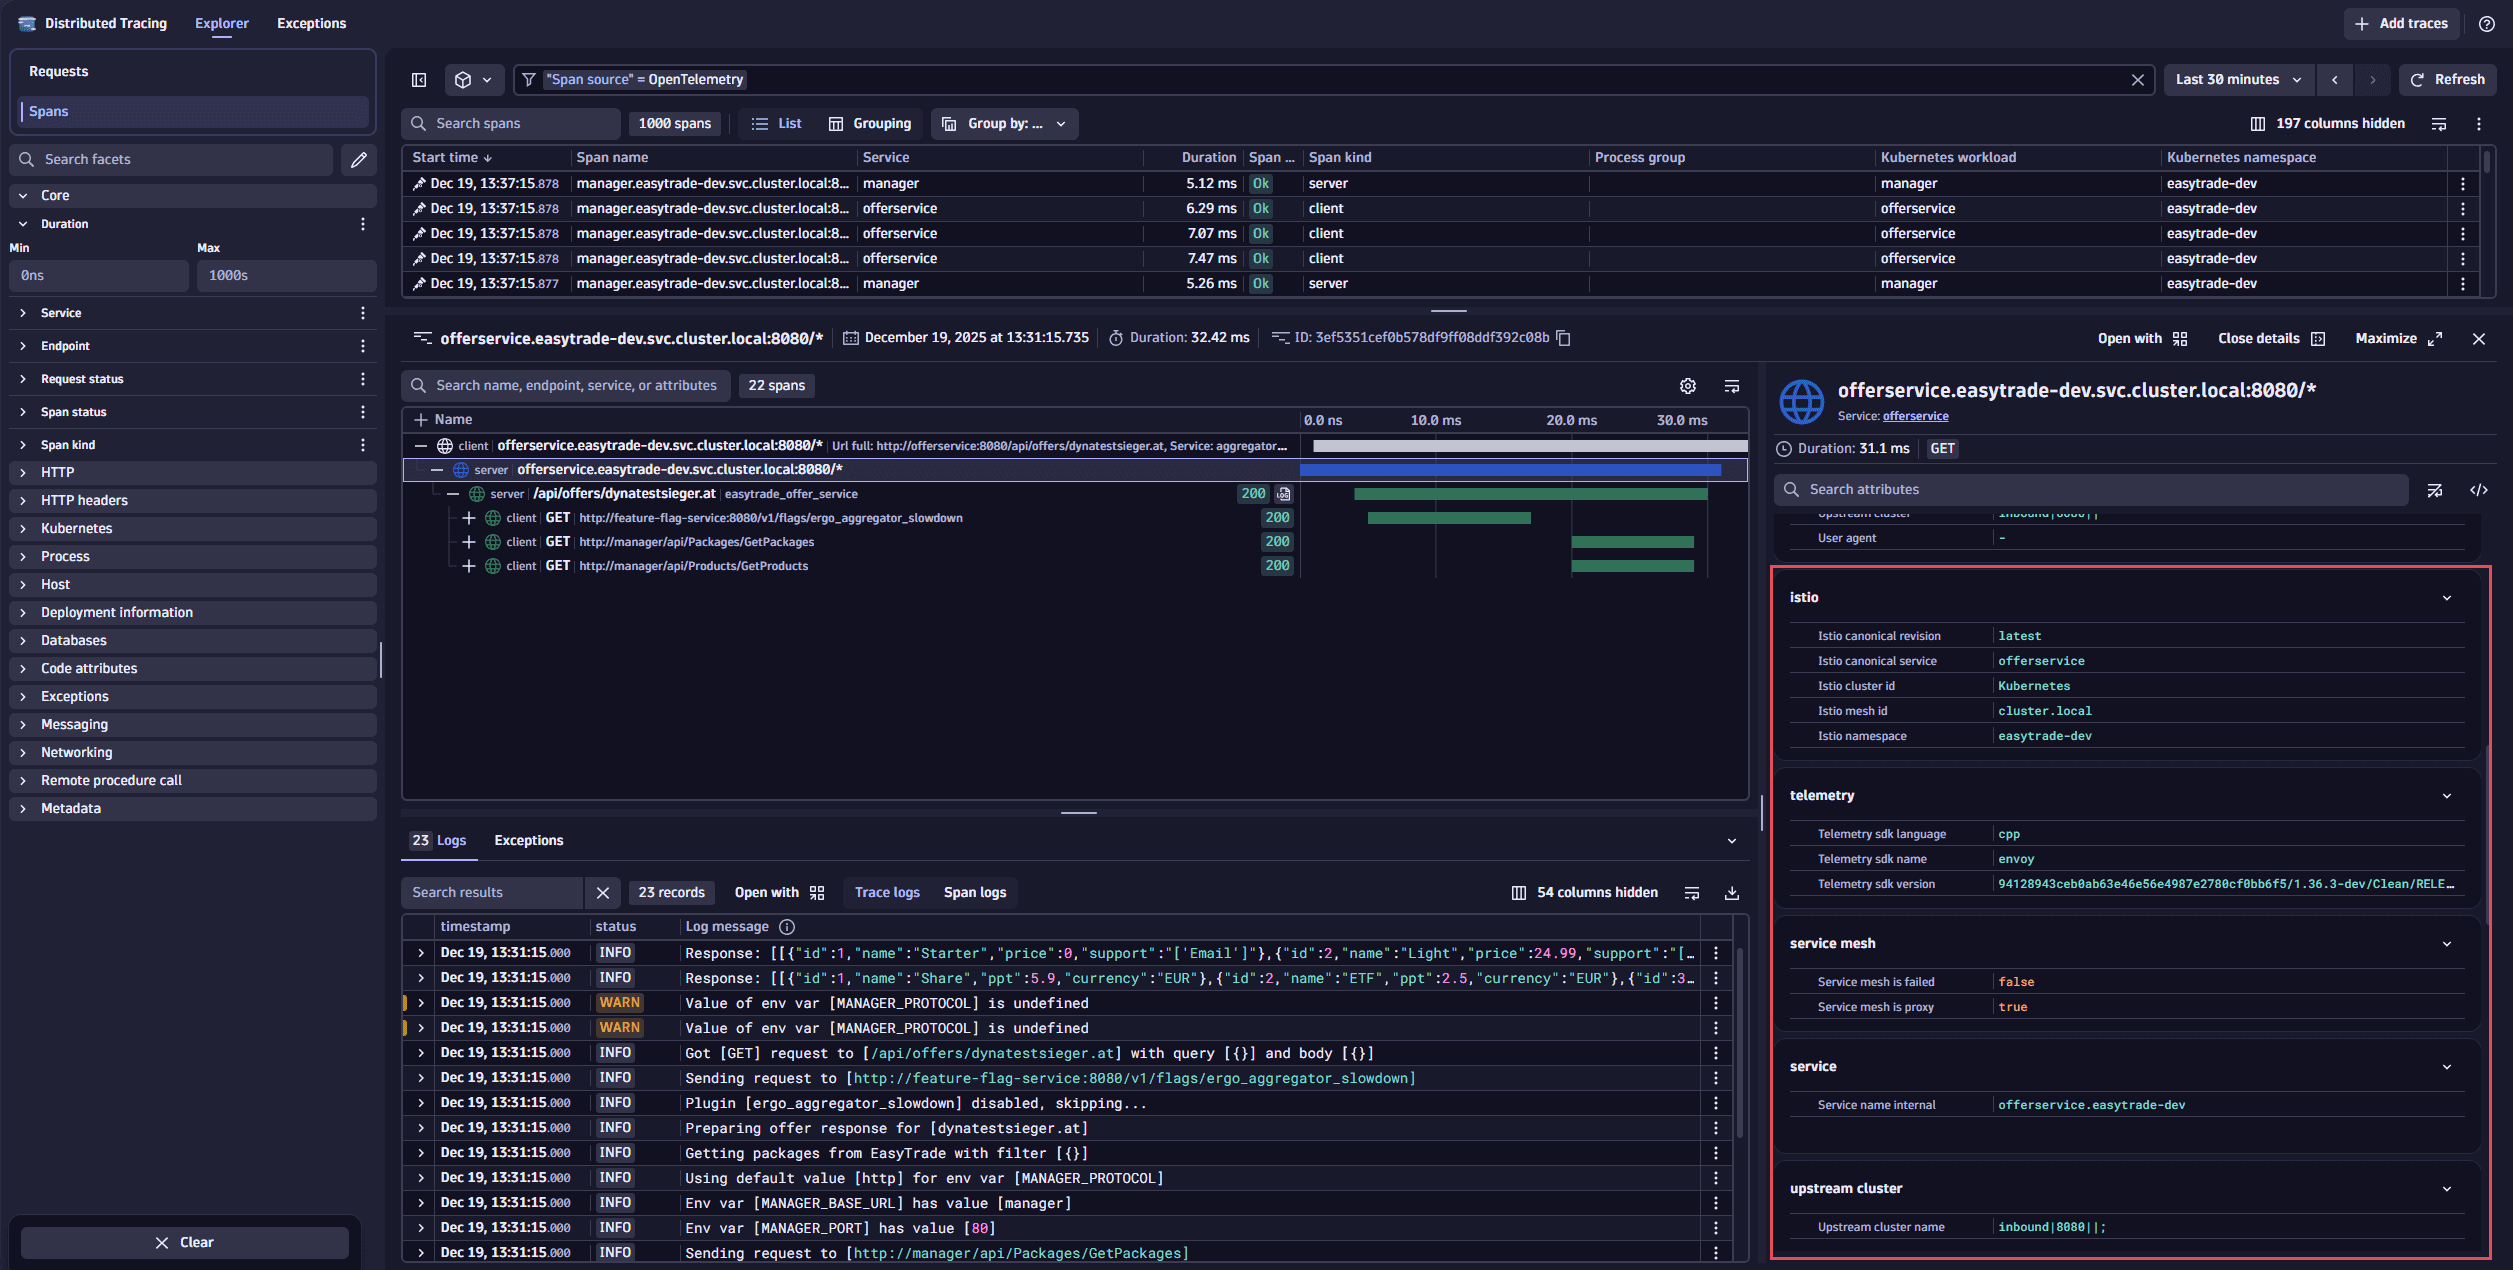
6. Verify the setup
Once the setup is complete and you have ingested your first data, you can verify if the traces show up in Dynatrace.