Fleet Management
- Latest Dynatrace
- App
- 8-min read
 Fleet Management is the central place to monitor, manage, and automate the components and integrations that collect telemetry for your Dynatrace environment. It gives deployment and infrastructure admins everything they need to keep their fleet healthy and up-to-date at scale.
With Fleet Management, you can:
- Get an instant inventory of all OneAgents and ActiveGates deployed in your environment.
- Detect health issues and follow contextual recommendations to resolve them.
- Plan and control updates with target versions and update windows.
- Install new OneAgents and ActiveGates directly from the app.
For details, see Concepts.
Prerequisites
Permissions
All permissions required to use Fleet Management are included in the default Admin User policy. For details, see Dynatrace default policies reference. If your account doesn't include the Admin User policy, contact your Dynatrace account administrator to have it assigned to your user group.
The following table describes the required permissions.
Get started
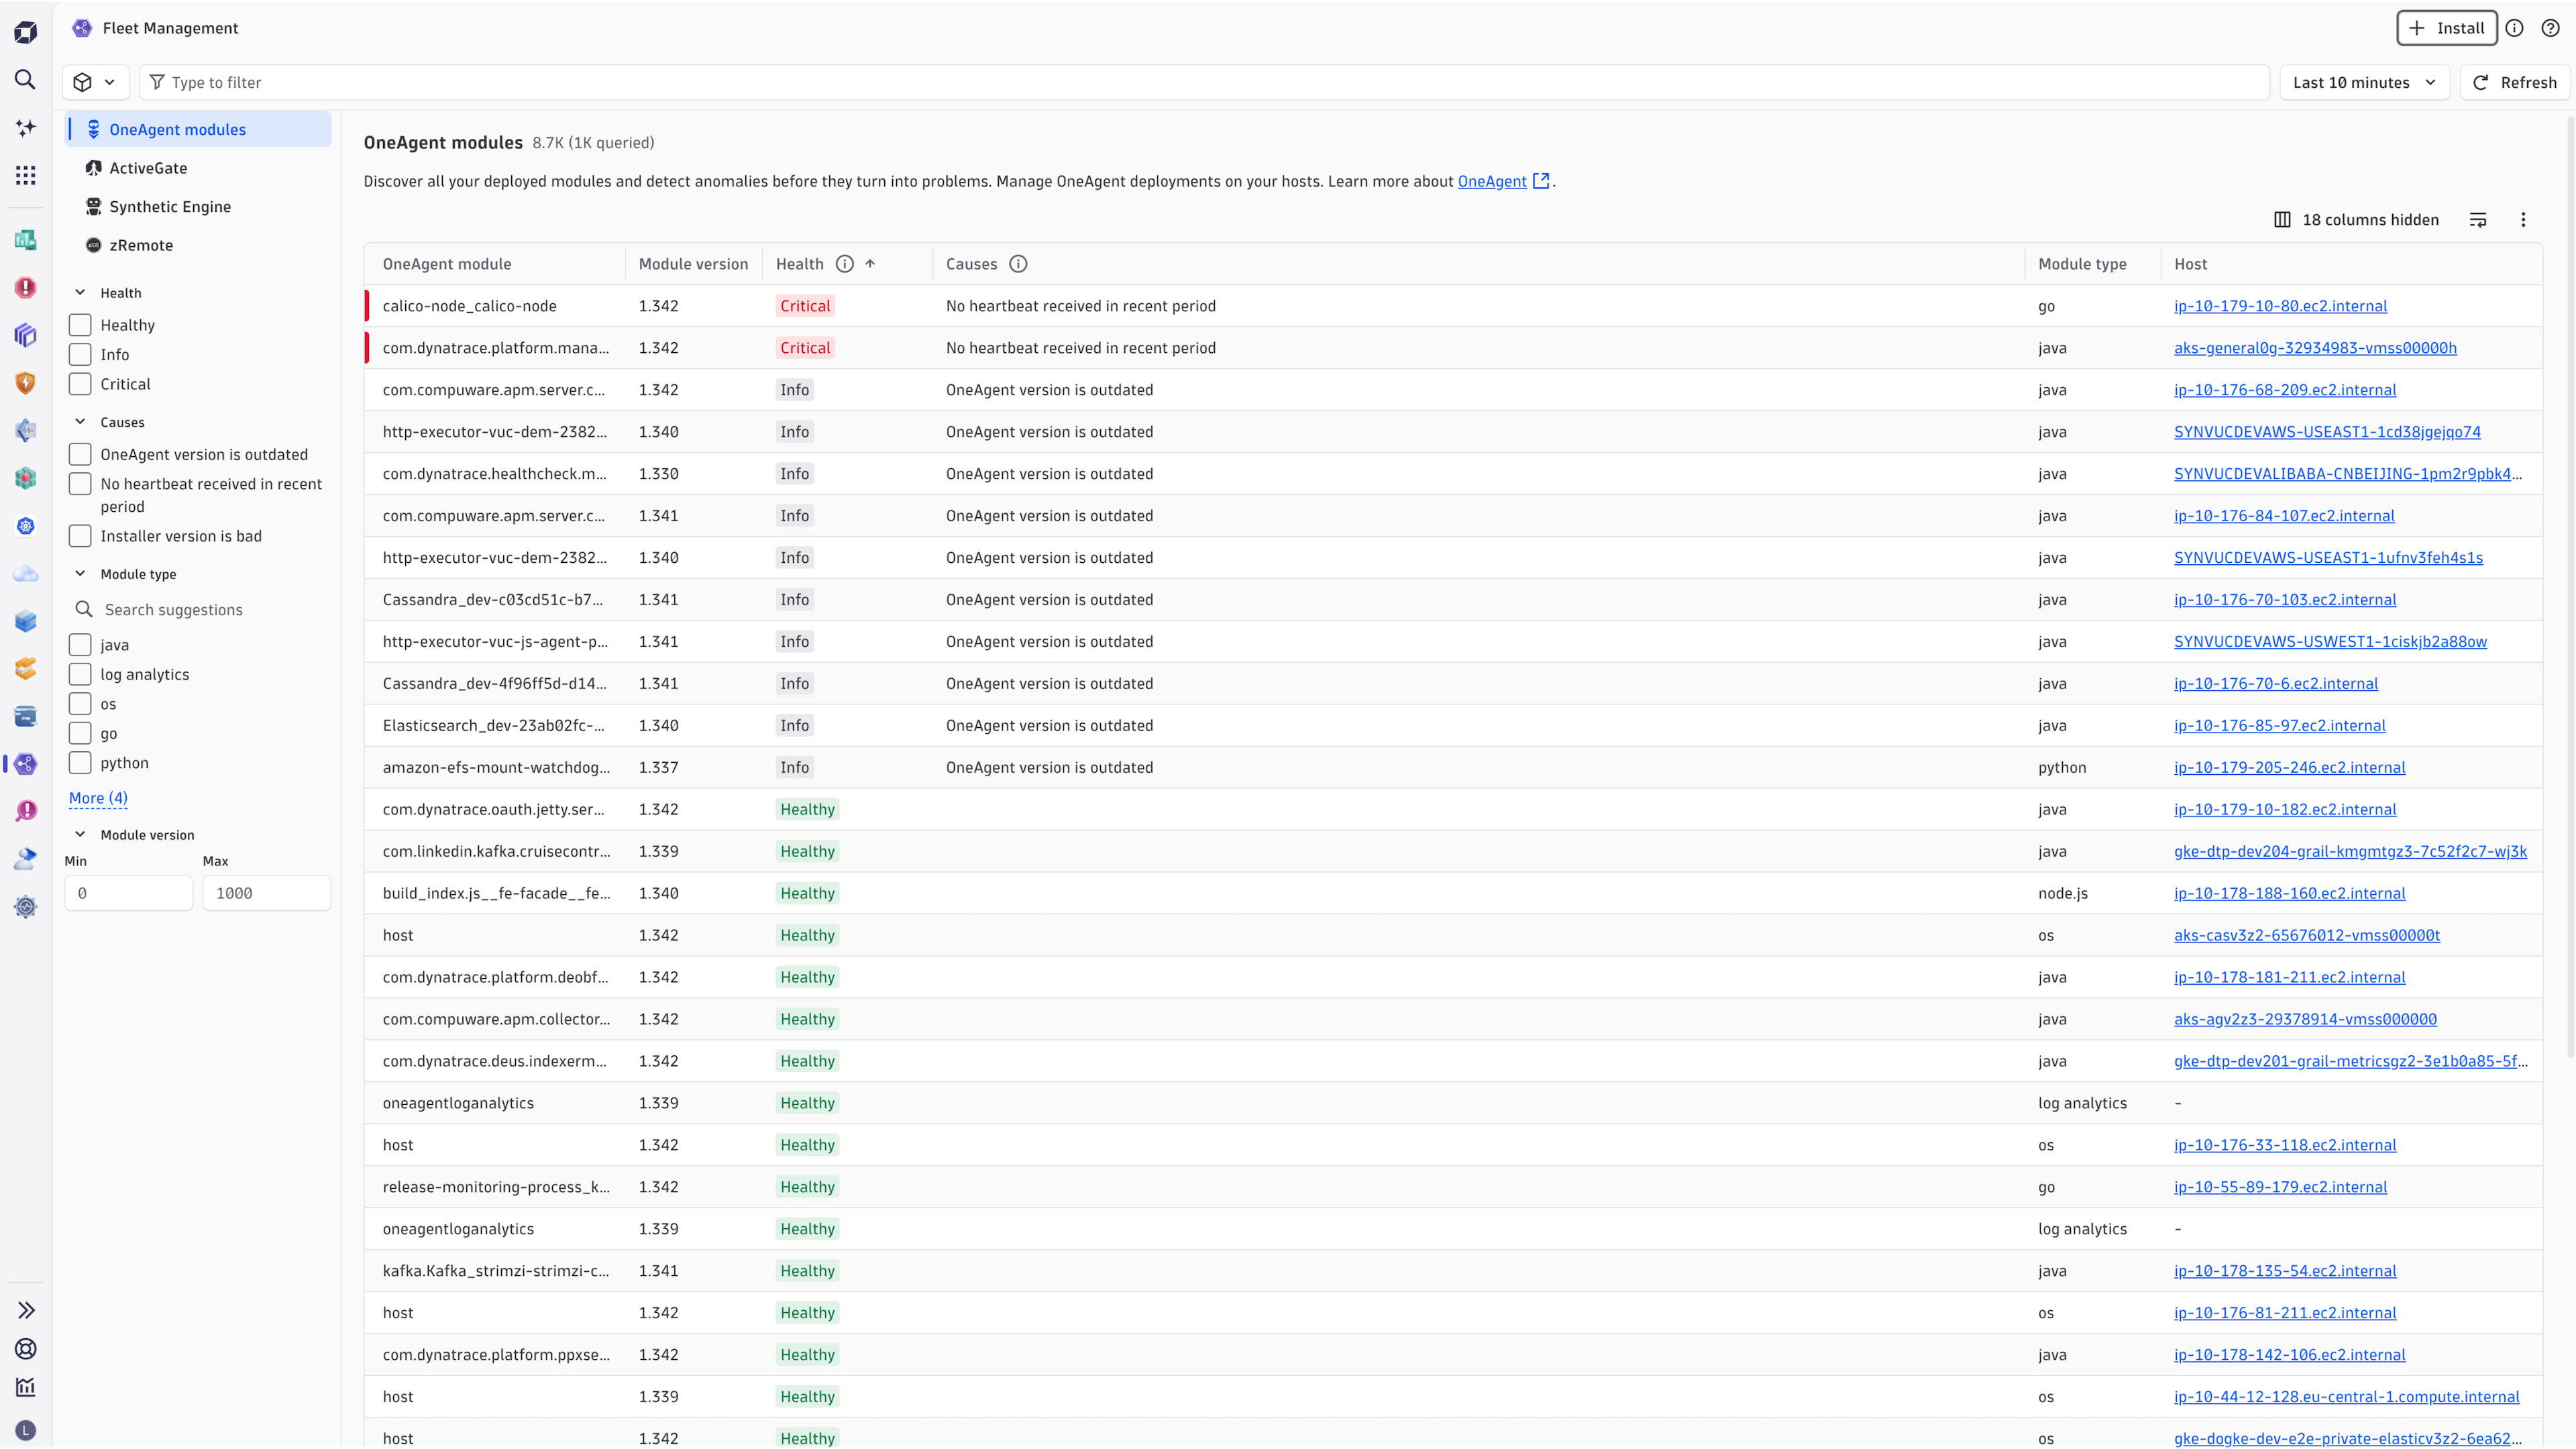
The following components are currently available:
- OneAgent modules: Code modules deployed with OneAgent. For details, see OneAgent platform and capability support matrix.
- ActiveGates: Gateways for routing monitoring traffic and extending Dynatrace capabilities. For details, see ActiveGate purposes and functionality.
Navigation
Fleet Management provides an overview of all fleet components deployed in your environment. You can switch between component types and drill down into individual entities.
View entity details
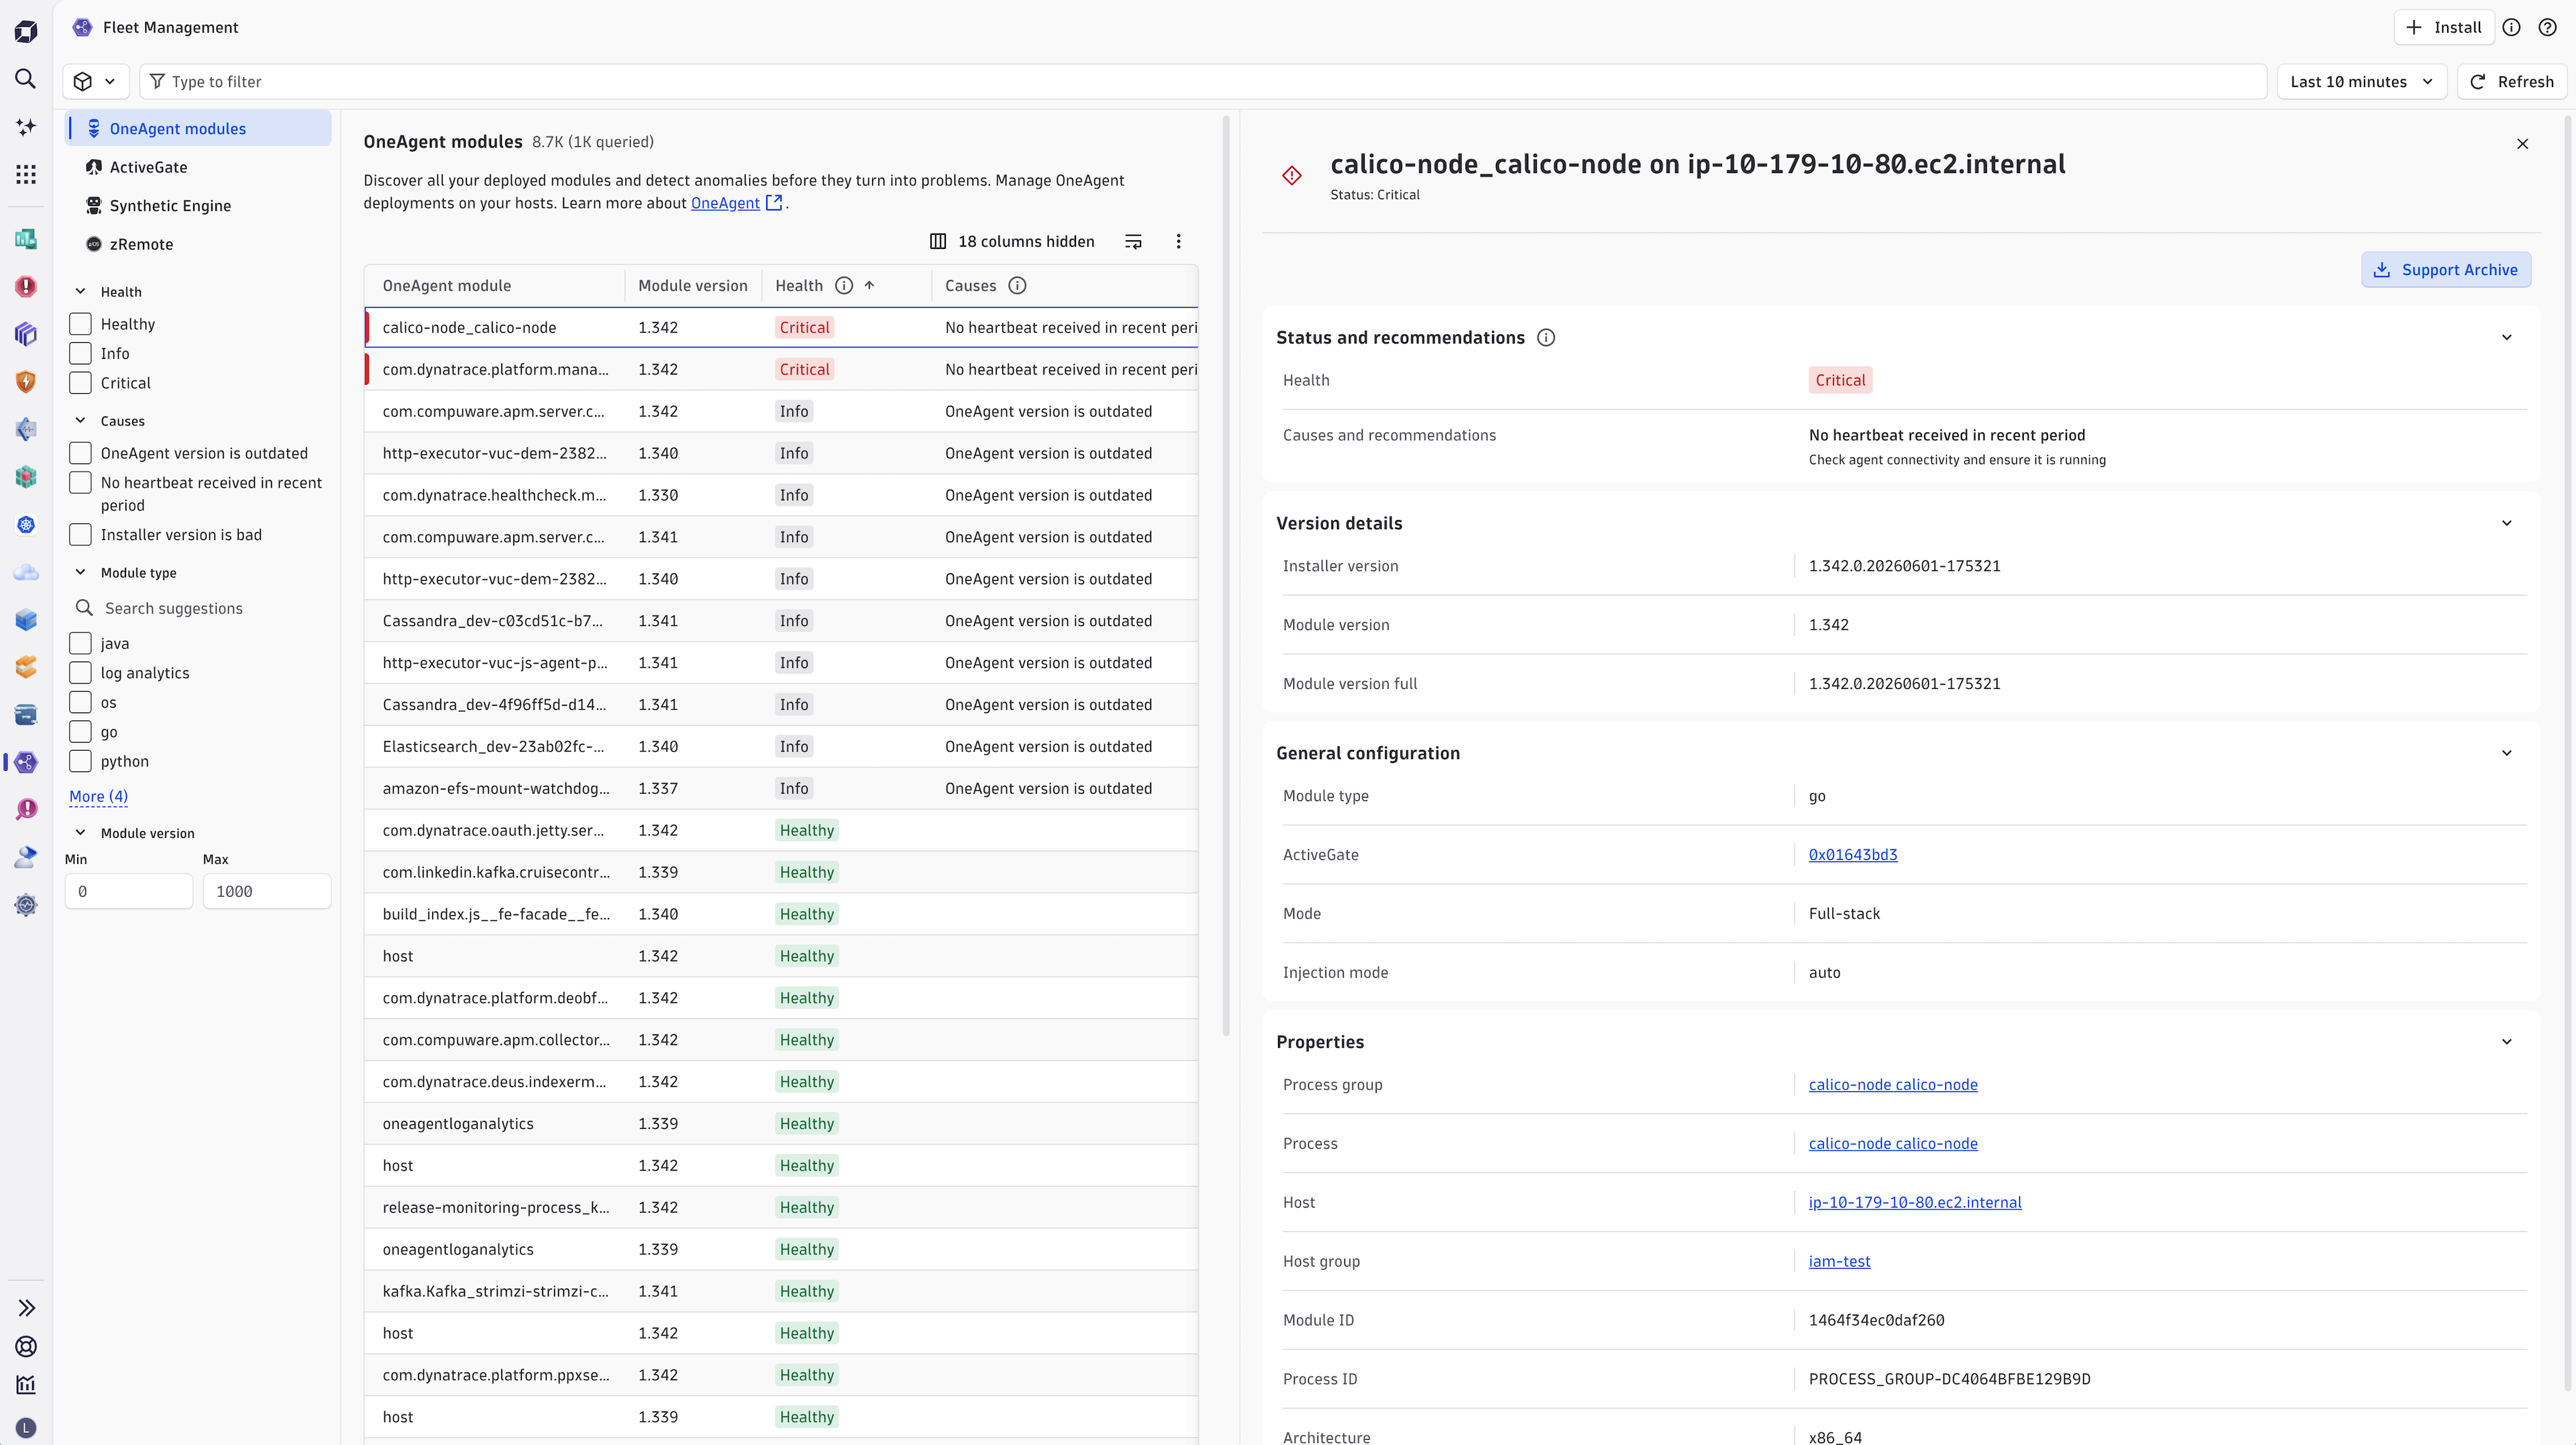
Selecting an entity opens entity details, which group attributes into sections such as Status and recommendations, Version details, and Properties. The exact sections depend on the entity type—for example, ActiveGates that handle synthetic traffic include a dedicated Synthetic monitoring section.
The top section shows the entity name, current status, and purpose, together with quick links:
- Dashboards: Open a ready-made dashboard scoped to the selected entity. For details, see Explore data.
- Settings: Open
 Settings scoped to the selected entity.
 - Support archive: Download a support archive for troubleshooting with Dynatrace Support. For details, see Download support archives.
View health and recommendations
Fleet Management groups your fleet by component type and health condition, so you can quickly see what needs attention. The view is scoped to what's present in your environment, and items with the highest impact appear first.
Select any entity to open its details. The Status and recommendations section shows the current health state.
Health states fall into four classes:
| Health state | Details |
|---|---|
Critical | Critical conditions are flagged in |
Warning | The component struggles with anomalies that might impact monitoring availability. Corrective action is recommended. |
Info | Health could be improved to ensure monitoring availability. Corrective action is not necessary. |
Healthy | The component is healthy without monitoring disturbances. No action is required. |
For details on health states and recommended actions, see the relevant page below.
OneAgent health overview
Monitor the health of OneAgent code modules in Fleet Management. Review health state conditions and recommended actions to resolve them.
- Reference
ActiveGate health overview
Monitor ActiveGate health alerts and warning signals in Fleet Management. Detect connectivity issues, expiring tokens, and unsupported versions that may impact monitoring.
- Reference
Manage updates
The Version details section shows the installed version, the configured target version, auto-update status, the update window (if defined), and the upcoming update.
Selecting Configure updates redirects you to Settings > Fleet management, where you can:
- Enable auto-update.
- Define update mode.
- Define a target version via rolling version policy (for example, N-1) to stay a fixed number of versions behind the latest release, or by pinning a version.
- Define an update window to control when updates are applied.
Target versions and update windows let you keep your components on a controlled version while still benefiting from automatic updates.
Explore data in  Notebooks and
  Dashboards
All Fleet Management data is stored in Grail and is DQL-queryable. From any entity list, you can:
- Open the current selection in Notebooks for ad-hoc analysis.
- Open a ready-made dashboard for the selected entity from the Dashboards quick link in entity details.
Browsing data within Fleet Management and the ready-made dashboards use zero-rated queries and don't generate billed query usage.
Download support archives
In Fleet Management, you can collect and download log files to use when resolving issues with entities.
Use this feature to:
- Collect diagnostic data for OneAgent or a specific ActiveGate at a specific point in time.
- Quickly resolve common issues on your own, reducing the amount of time spent on diagnosing.
- Directly provide Dynatrace Support all the details they need to diagnose the issue.
For an ActiveGate configured for multi-environment support, you can download a support archive only from the main environment.
To download a support archive
-
Go to OneAgent modules or ActiveGates, and select an entity to open its details.
-
Select Support Archive.
-
In the Download Support Archive dialog, enter the following details.
-
Issue (required)
Describe the issue you're experiencing.
-
Period of the data
Select the time range of data to include. Options are Last 24 hours, Last 2 days, Last 3 days, Last 4 days, Last 5 days, Last 6 days, and Last 7 days.
The default period is Last 24 hours for OneAgent and Last 7 days for ActiveGate.
-
-
Select Download.
Dynatrace automatically masks sensitive data in the archive.
After you select Download, a notification shows the collection status.
| Status | Description |
|---|---|
In progress | Log files are being collected. Stay on the page until the download is finished. Select Cancel in the notification to stop the collection. |
Timed out | The download timed out. Select Retry to try again. |
Failed | The download failed after multiple attempts. |
Success | The archive is ready. Select Download in the notification to save the file. |
You can share the downloaded archive with Dynatrace Support by attaching it to your support ticket.
Manage network zones
You have quick access to your network zones from Fleet Management. Select Network zones from the top of the screen to open the network zones list in Settings > Fleet management.
If you don't have the required permissions, network zones are read-only and you can't create or edit them. For details, see Permissions.
To add a network zone
-
In
Fleet Management, select Network zones.This redirects you to
Settings > Fleet management. -
Select Network zone and enter the details for the new network zone.
-
Network zone name
Define the network zone identifier, which can't be edited once created. Use alphanumeric characters, hyphens (
-), and underscores (_) only. -
Description
Add a short, meaningful description for the network zone.
-
Fallback mode
Configure fallback mode to define behavior when no ActiveGates are available in this network zone or any alternative network zone.
- Any ActiveGate: Routes traffic to any available ActiveGate.
- Only default zone: Routes traffic only to the default network zone.
- None: Drops traffic if the primary zone is unavailable.
-
Alternative network zones
Alternative network zones specify how routing is handled when this network zone becomes unavailable.
-
-
Select Save.
When viewing or editing a network zone, Used as alternative by shows which zones have configured this zone as an alternative network zone.
To edit a network zone, select it from the list, update the details, and select Save.
Install OneAgent/ActiveGate
To install new components, select Install OneAgent or Install ActiveGate in the upper-right corner.
For step-by-step instructions, expand the relevant section below.
Install OneAgent
To download and install OneAgent on a host
-
In
Fleet Management, select Install OneAgent in the upper-right corner. -
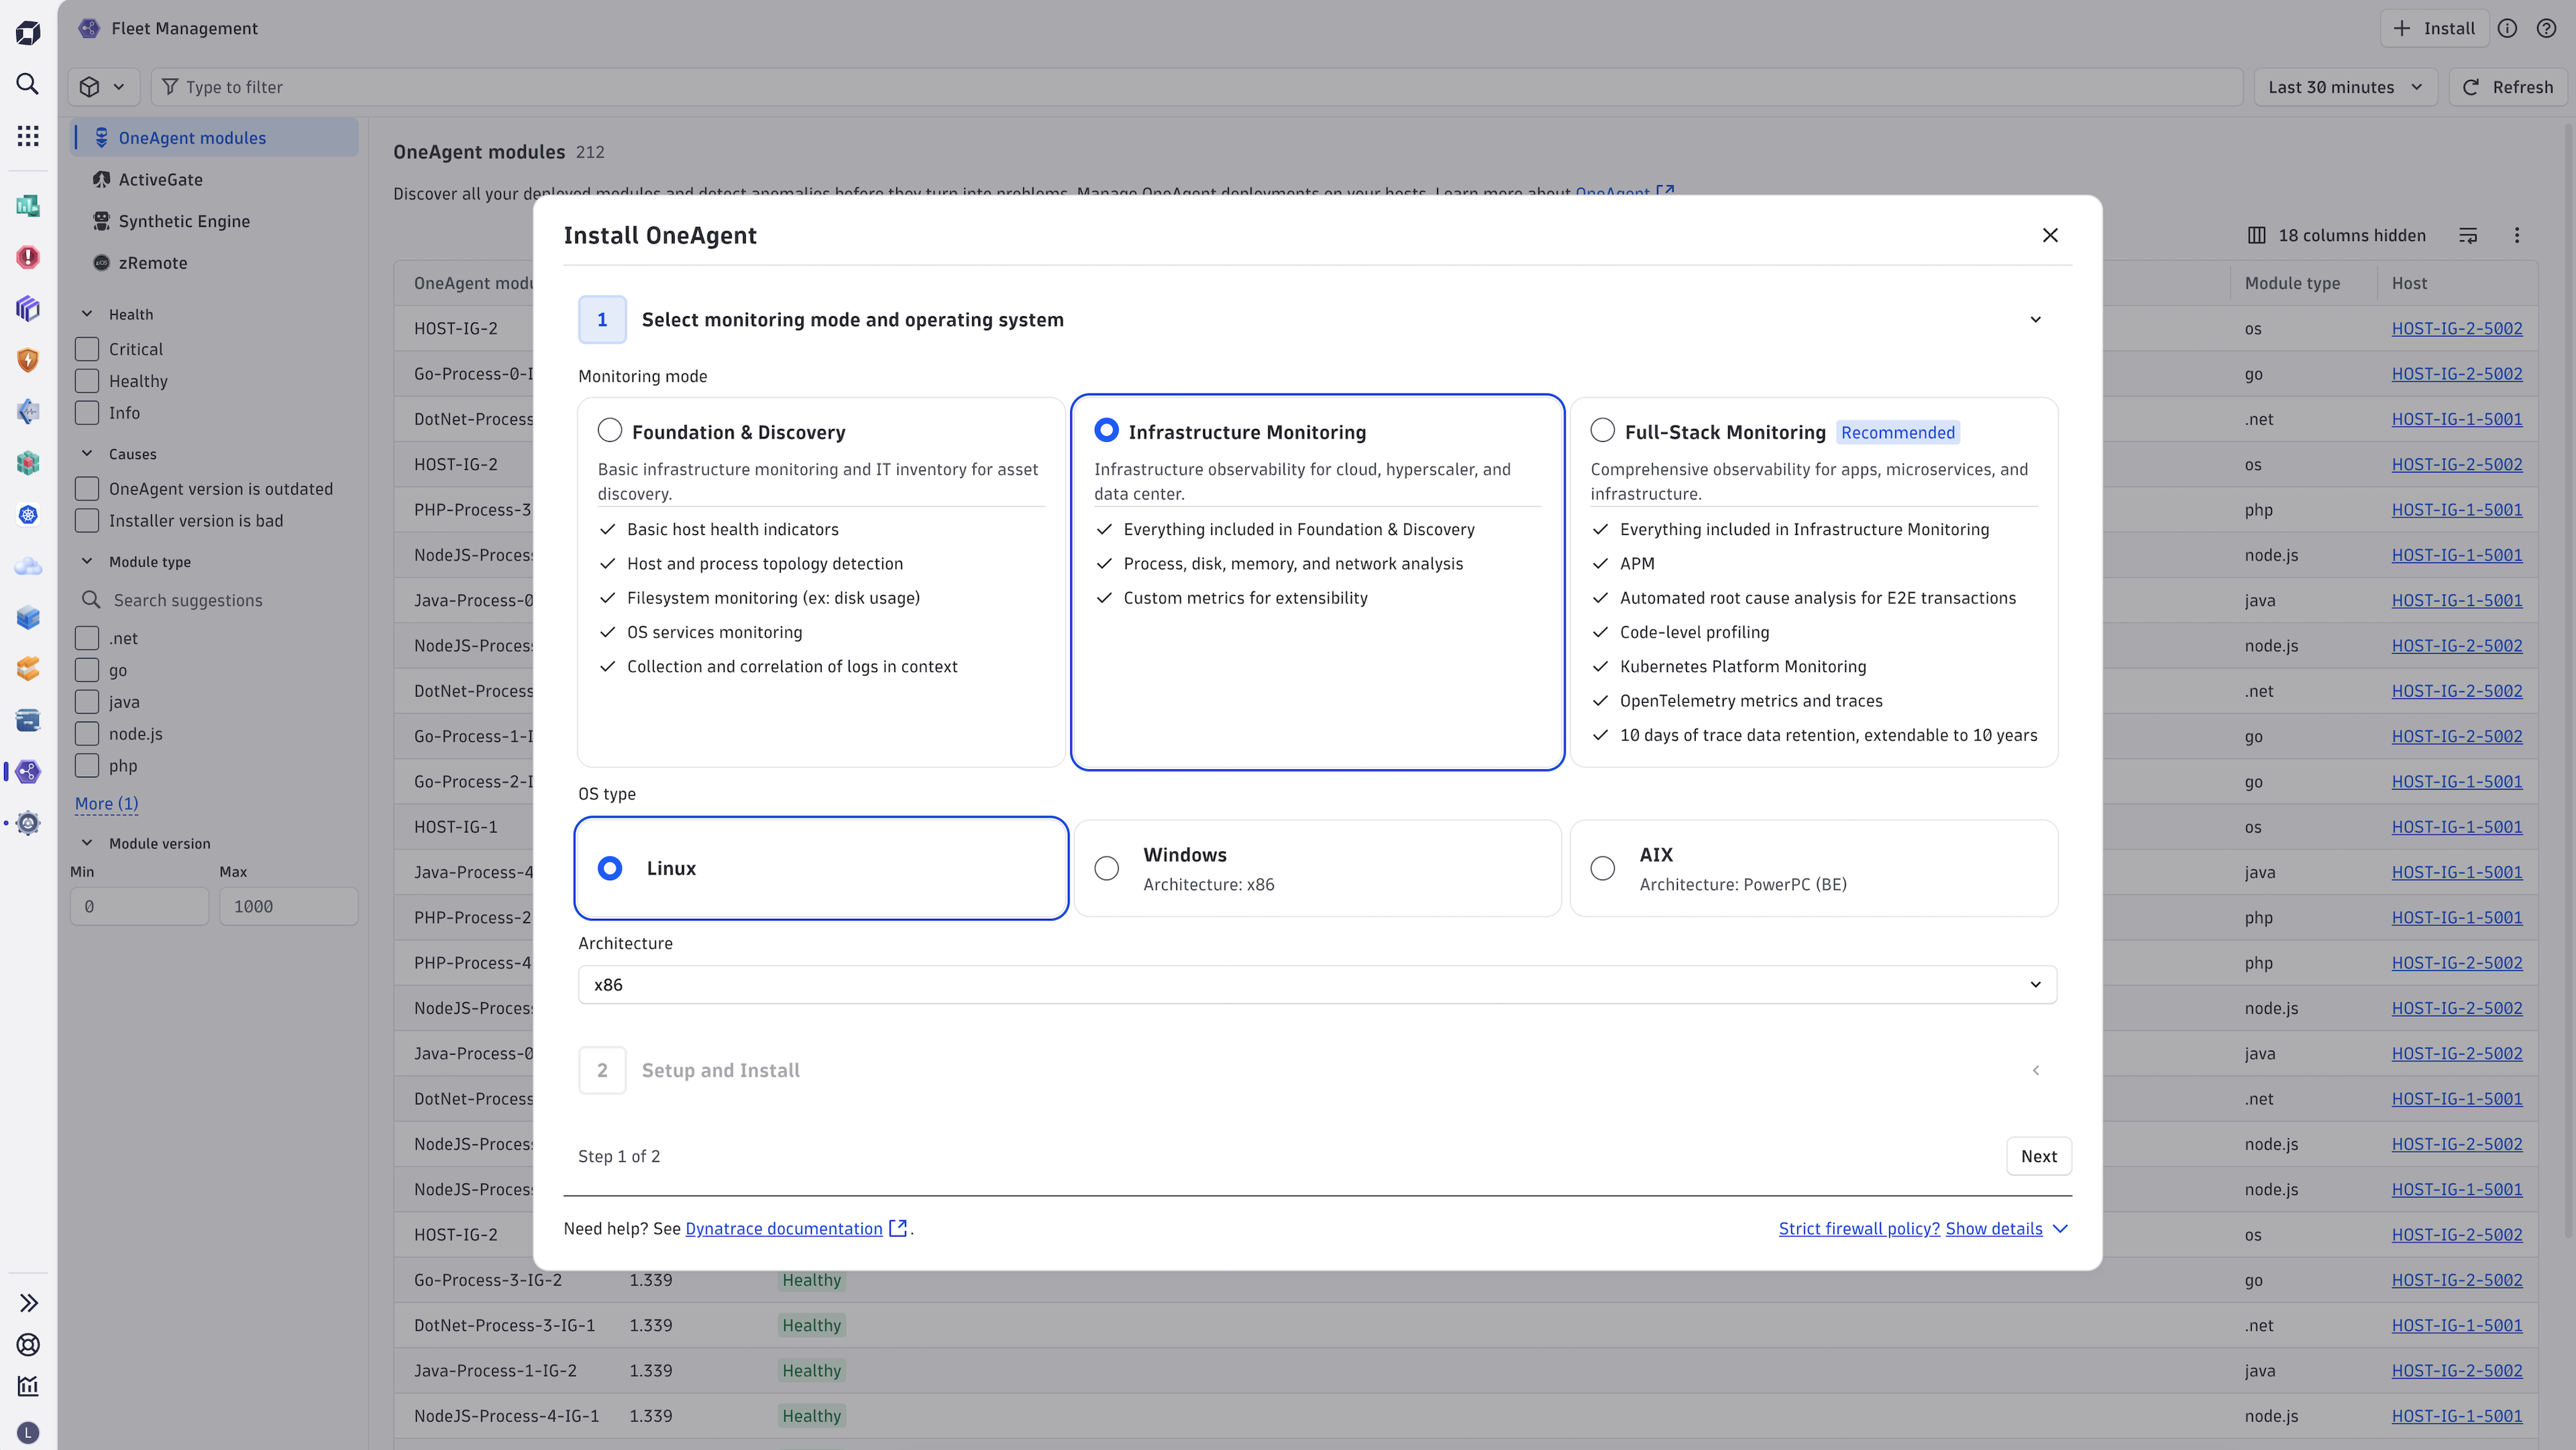
Select a Monitoring mode and Operating system.
-
Monitoring mode
Options are Full-Stack Monitoring (recommended), Infrastructure Monitoring, or Foundation & Discovery. The default monitoring mode configured for your environment is pre-selected. You can always change the monitoring mode after installation.
-
Operating system
Choose Linux, Windows, or AIX according to your host's operating system.
-
Architecture
Linux only Select one of the available options from the list.
-
-
Select Next.
-
Select Generate token to create an installer download token. Generated platform tokens are valid for 24 hours.
-
Optionally, configure Network zone, Custom host name, Host group, Tags, and Properties.
-
Use the provided CLI commands to download and install OneAgent.
-
Select Show Fleet Management to monitor the newly installed OneAgent.
Install ActiveGate
To download and install ActiveGate on a host
-
In
Fleet Management, select Install ActiveGate in the upper-right corner. -
Select a Purpose and Deployment type.
-
Purpose
Choose Routing-Monitoring, Synthetic, z/Remote, or Kubernetes. For details, see ActiveGate purposes and functionality.
-
Deployment type
Choose Linux, Container, or Windows according to your host's operating system.
-
Architecture
Linux only Select one of the available options from the list.
-
-
Select Next.
-
Select Generate token to create an installer download token. Generated platform tokens are valid for 24 hours.
-
Optionally, configure Network zone and ActiveGate group.
-
Use the provided CLI commands to download, verify the signature, and install ActiveGate.
-
Select Show Fleet Management to monitor the newly installed ActiveGate.
Configure Fleet management settings
You can now find all the settings that help you manage your fleet at scale in one place, in Settings under Fleet management:
- ActiveGate version and updates: Target version and update mode for all ActiveGates, and update windows.
- OneAgent version and updates: Target version and update mode for all OneAgents, and update windows.
- Default mode: Default monitoring mode for new OneAgent installations.
- Network zones: Network zone definitions and fallback behavior.
- Extension Execution Controller: EEC performance profile at the environment level.
Concepts
What is fleet management?
Fleet management is the centralized overview, management, and automation of all monitoring components and integrations deployed across your infrastructure. These components and integrations collect telemetry data (metrics, logs, traces, and events) from hosts, containers, VMs, and applications running on-premises, in the cloud, or in hybrid environments.
Fleet Management helps you keep these components consistently configured, up-to-date, healthy, and compliant across environments, so your teams can focus on the insights derived from observability data instead of managing the tools that collect it.
What is my fleet?
Your fleet is the set of Dynatrace components and integrations responsible for collecting observability data or connecting Dynatrace to your systems. Fleet Management currently covers OneAgents and ActiveGates. Over time, more components and integrations will be added to give you a single place to centrally manage them all as your fleet grows.
Relation between OneAgent and ActiveGate
OneAgent collects telemetry directly from your hosts and the workloads running on them. ActiveGate sits between OneAgent (or other data sources) and the Dynatrace platform, providing routing, traffic offloading, and additional purpose-specific capabilities such as synthetic monitoring or extension execution.
Because ActiveGate can serve different purposes, Fleet Management makes it easy to identify each ActiveGate's role and see the health states and properties relevant to it.
Use cases
-
Instant overview of the entire fleet
Review your fleet inventory, health alerts and warning signals, and version distribution at a glance. Recommended actions are prioritized by impact, so you know what to address first.
-
Easier lifecycle management of fleet components
Manage updates centrally, reduce the friction of upgrading, and stay on a controlled version. Release notes are surfaced for the versions relevant to your fleet.
-
Quick monitoring configuration overview
See the configurations applied to each component, including those inherited from environment or group level. Review their impact on monitoring and identify deviations.
-
Onboarding improvements
Faster time to value when installing new OneAgents and ActiveGates, directly from the app.
Fleet ManagementInfrastructure Observability