OpenTelemetry and Dynatrace
- Latest Dynatrace
- Overview
- 2-min read
OpenTelemetry (OTel) provides a standardized way of collecting and exporting telemetry data. It allows applications and infrastructure to transmit telemetry to backends (such as Dynatrace) using vendor-agnostic formats. These backends can then aggregate and analyze the data.
You can implement this service by service, adopting the open standards of OpenTelemetry where openness matters most, while leveraging enhanced OneAgent features available where you need them. Dynatrace supports this flexible approach, ensuring you experience industry-leading analytics regardless of how you mix your instrumentation choices.
Ingest methods
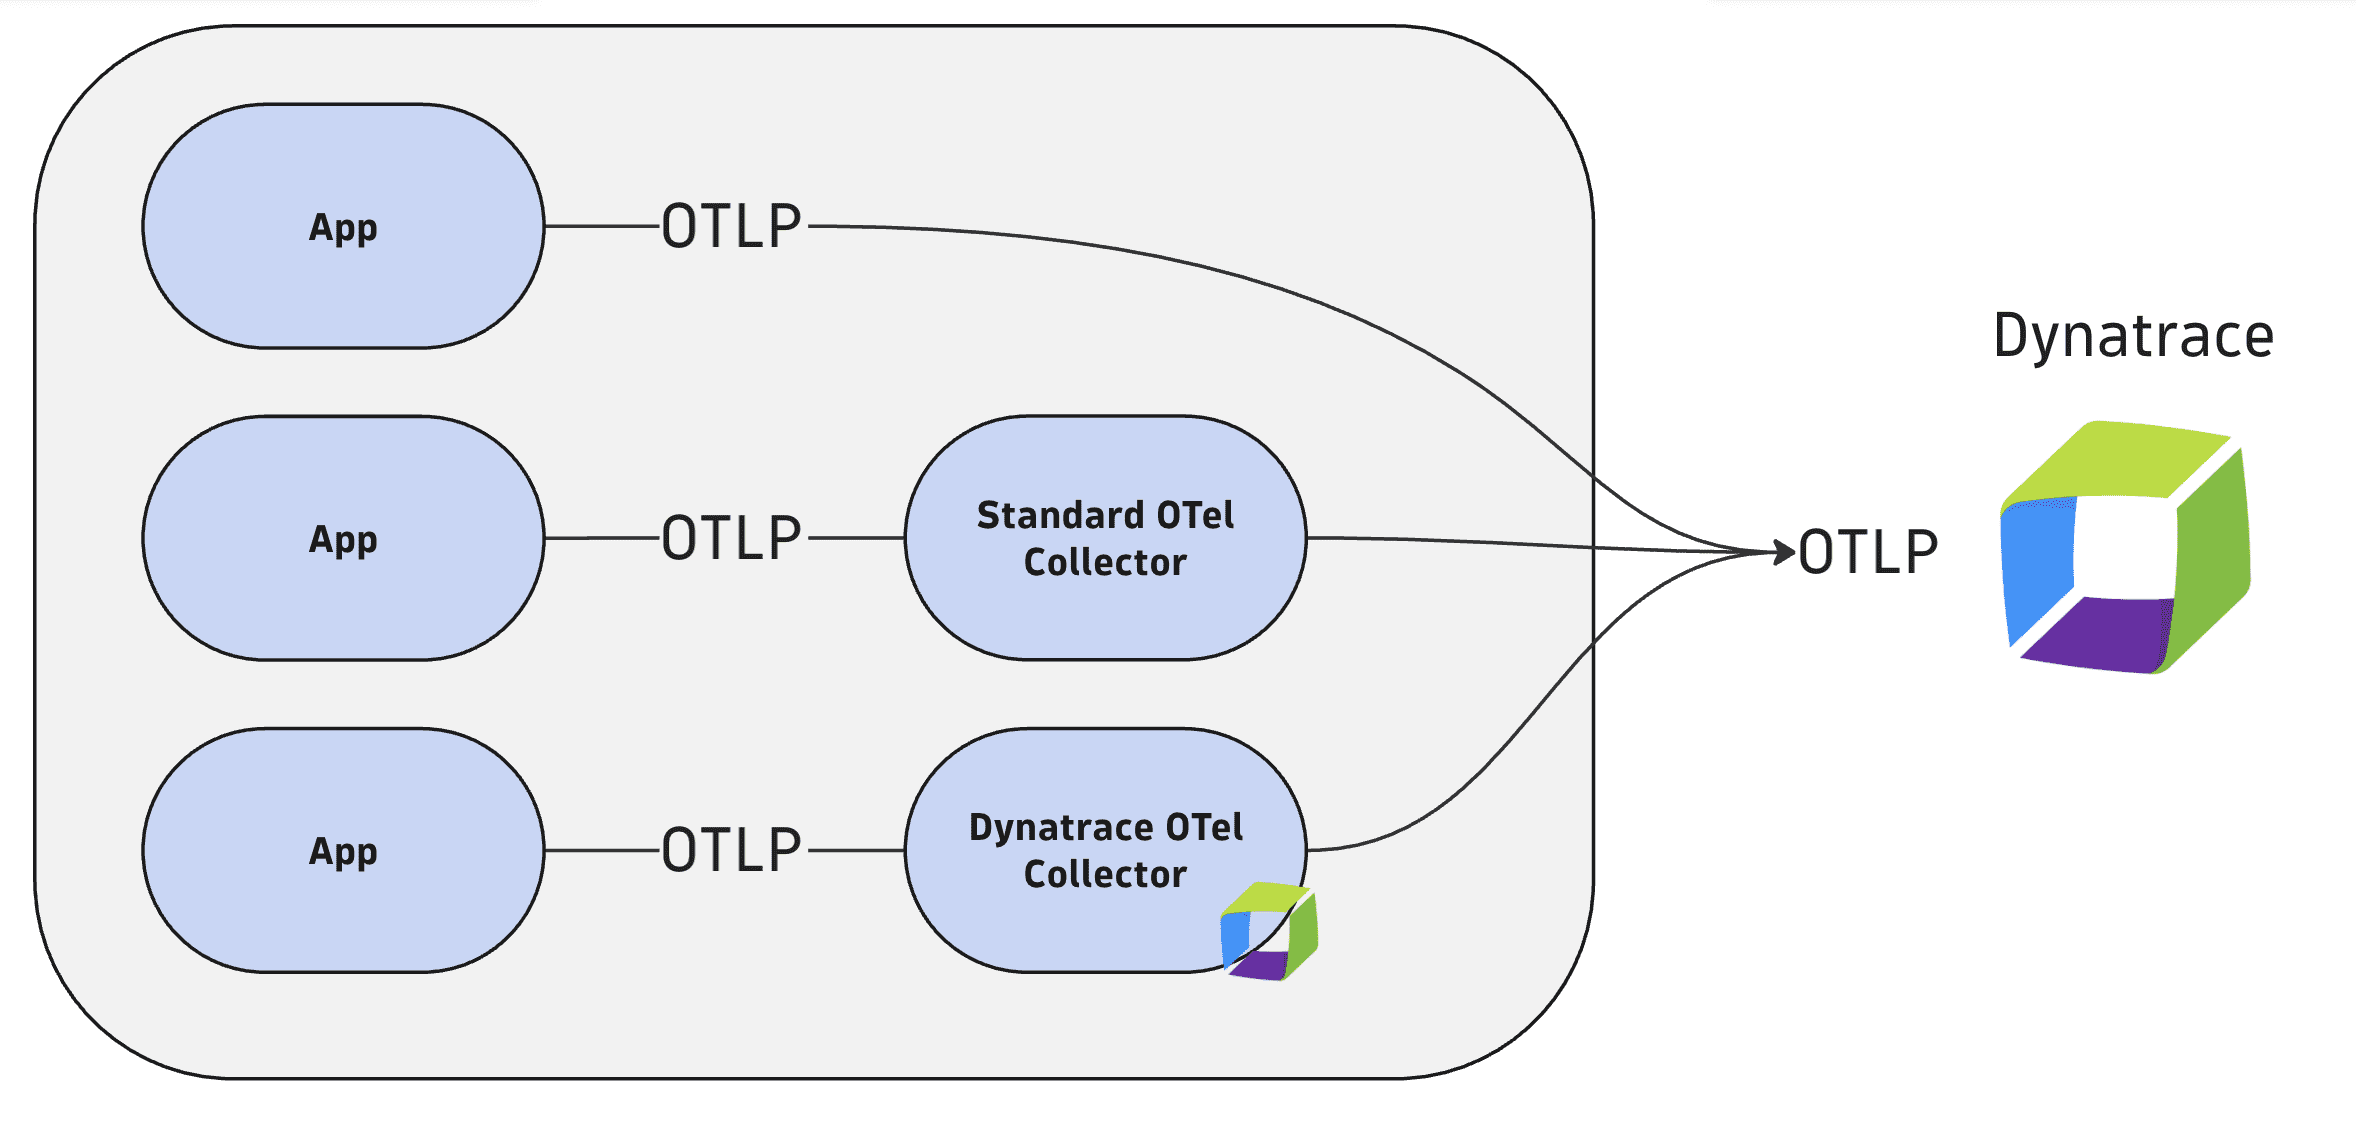
There are three different ways you can export your OTLP data to Dynatrace. Choose the deployment option that best aligns with your observability strategy.

| Method | Best when… | Good for… | Ideal for… |
|---|---|---|---|
Direct export to Dynatrace API endpoints | You want minimal complexity and infrastructure overhead. | Simple deployments with straightforward telemetry requirements. | If you don't need data processing, enrichment, or transformation capabilities. |
Standard OTel Collector | Your organization has already standardized on OTel Collectors. | Teams with existing OpenTelemetry expertise and tooling. | Ideal if you need compatibility with existing collector configurations or custom versions. |
Dynatrace OTel Collector Recommended | Most Dynatrace deployments requiring data processing capabilities. | Teams who need a fully supported OTel Collector distribution with verified configurations. | When you want automated management through the Dynatrace Operator. |
Why use OpenTelemetry with Dynatrace?
Dynatrace provides end-to-end observability for all your application telemetry while embracing OpenTelemetry standards. With its unified observability approach, Dynatrace offers a comprehensive platform for viewing, storing, and correlating all OpenTelemetry signals in one place. This solution empowers you to simplify complexity and innovate faster by extracting maximum value from your data, regardless of origin.
Dynatrace provides you with:
- Powerful analytics at scale. Execute massive queries at lightning speed by leveraging the power of Grail with your OpenTelemetry data, turning telemetry data into actionable and intelligent insights for faster problem resolution.
- Intelligence beyond instrumentation. Dynatrace enriches OpenTelemetry data with business context and advanced analytics to deliver actionable intelligence, rather than just data collection.
- Accelerated innovation. Navigate OpenTelemetry data with out-of-the-box analysis, dynamic visualizations, and instant performance insights that foster collaboration between development and operations teams.
- Seamless integration. Enable easier integration of data into the Dynatrace Platform.
How is Dynatrace involved with OpenTelemetry?
Dynatrace is deeply committed to the OpenTelemetry ecosystem through multiple avenues of involvement:
- Dynatrace is one of the top contributors to the OpenTelemetry project with key maintainer roles, helping shape its core functionality and direction.
- Dynatrace is actively involved through leadership positions on multiple OpenTelemetry special interest groups (SIGs) and on the OpenTelemetry Technical Committee. This helps to shape the future direction of OpenTelemetry standards and practices.
- Dynatrace supports over 30 open-source projects and contributes to multiple open-source offerings, reflecting its deep commitment to community-driven innovation.
Multiple pathways to leverage your OpenTelemetry data
Dynatrace meets customers where they are in their observability journey, offering multiple ingestion options for getting OpenTelemetry signals into the platform including:
- OTLP API
- OTel Collector
- Dynatrace OTel Collector
Licensing
Licensing for OpenTelemetry data is fully integrated into the Dynatrace Platform Subscription model, ensuring that all telemetry types (traces and spans, metrics, logs) are billed transparently and consistently.
Dynatrace Semantic Dictionary
The Dynatrace Semantic Dictionary provides standardized naming conventions for metrics, logs, and spans. Using these conventions ensures optimal integration with Dynatrace analytics capabilities.
Learn more about the Semantic Dictionary at Semantic Dictionary.