Dynatrace Intelligence for Notebooks
- Latest Dynatrace
- How-to guide
- 2-min read
Dynatrace Intelligence for Notebooks runs a range of analyzers directly in Notebooks, providing on-spot results and enabling you to fine-tune your custom alert configurations.
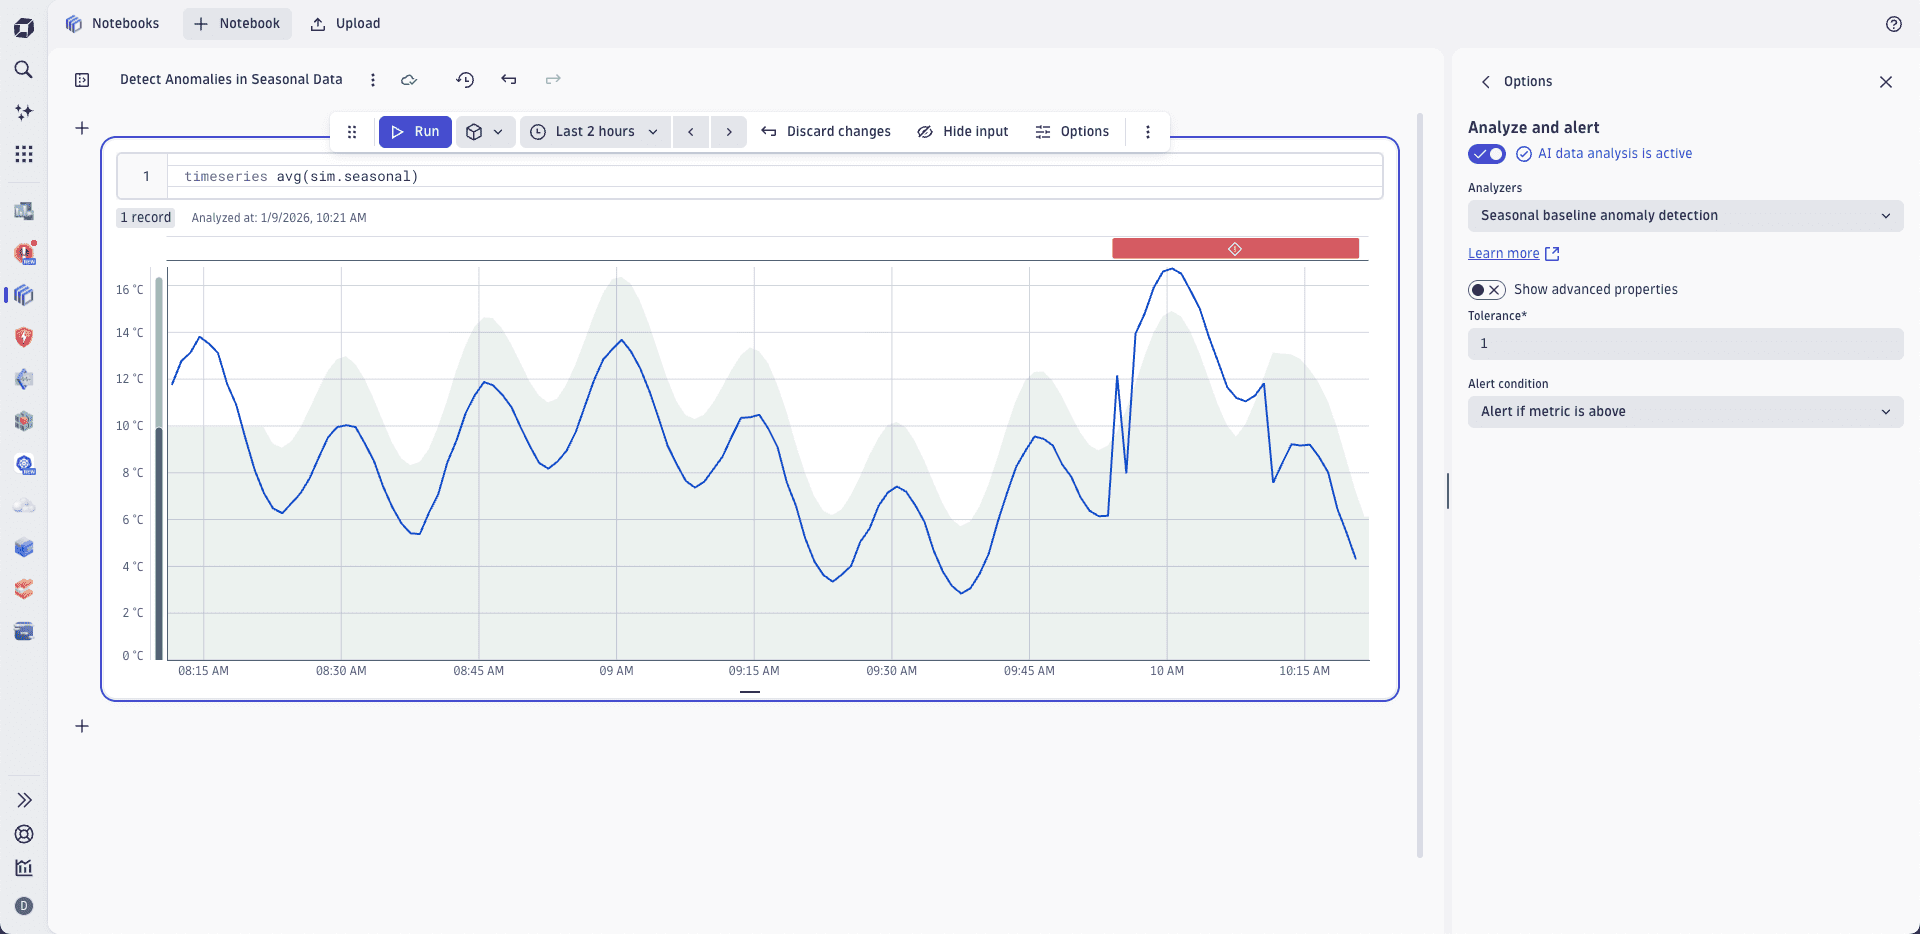
Anomaly Detection
With  Anomaly Detection combined with the power of DQL, you can custom-build powerful configurations to detect anomalies in metrics, logs, business data, or a combination of them. To preview and fine-tune your Anomaly Detection configuration before deploying it to action, use a Dynatrace Intelligence for Notebooks analysis option:
- Auto-adaptive threshold—Dynatrace calculates the threshold automatically and adapts it dynamically to your data's behavior.
- Seasonal baseline—Dynatrace creates a confidence band for data with seasonal patterns
- Static threshold—the threshold that doesn't change over time.
For each of these options, you can configure a missing data alert. Missing data and threshold conditions are combined by the OR logic.
To run an anomaly detection analysis in Notebooks
- Go to Notebooks
 .
. - Open your notebook or create a new one.
- Add a Query Grail section and query the data you're interested in, or add a Metrics section and select the required metric.
For a DQL query, use the
interval: 1mparameter to ensure proper data resolution for the analysis. - Select Options.
- In the Options panel, select Analyze and alert and activate the analyzer.
- Select the required anomaly detection analyzer and configure its parameters.
- Select Run analysis.
Dynatrace Intelligence analyses the data and shows potential alerts. Note that these are just indicative simulations—no real alerts are triggered based on this analysis.
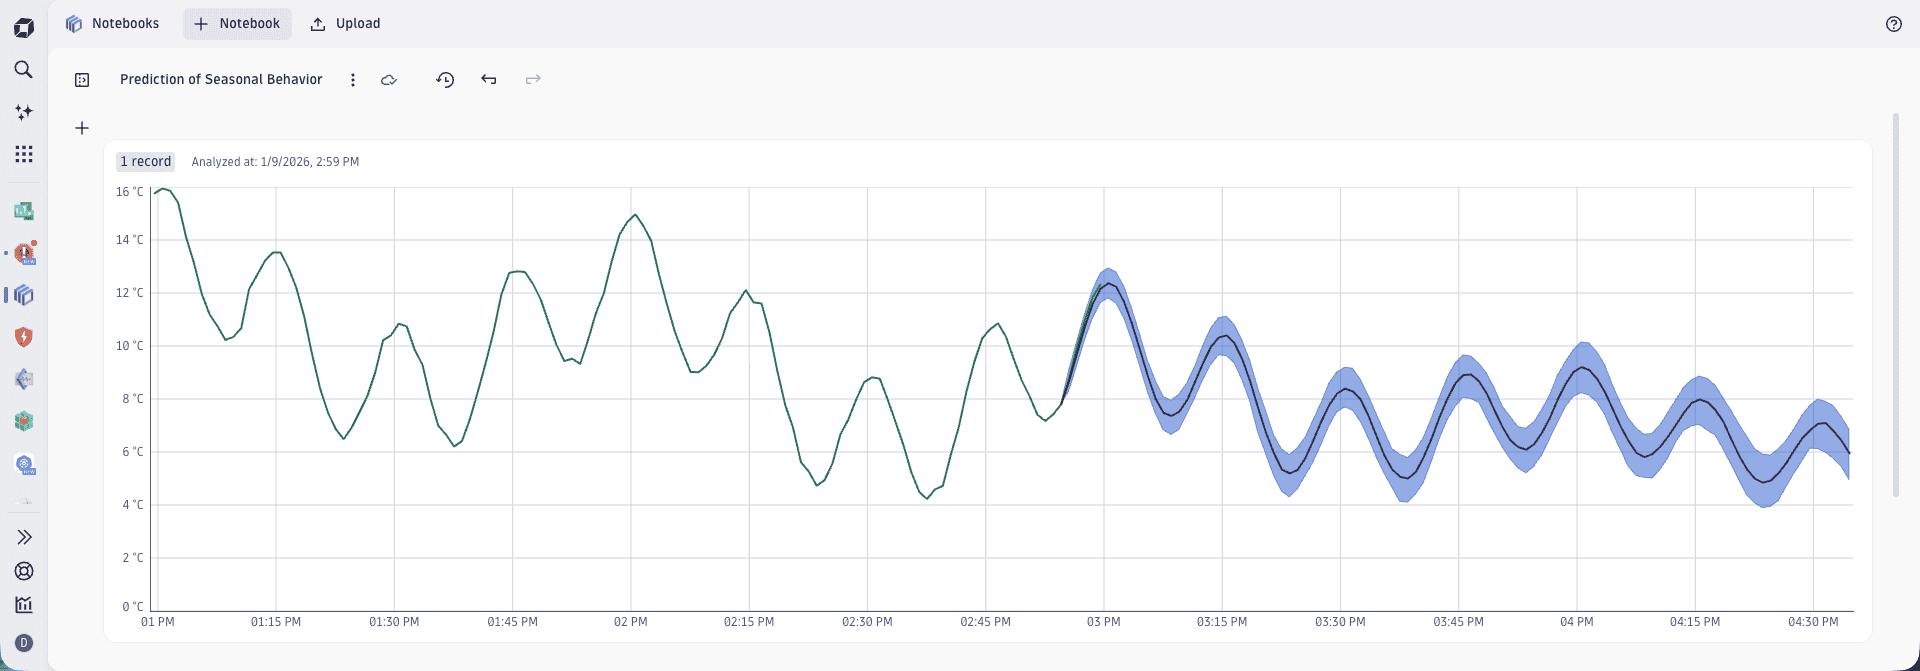
Forecast analysis
Dynatrace Intelligence predictive AI analysis foresees future values of any time series of numeric values based on the accumulated data. To trigger a forecast analysis
- Go to Notebooks .
- Open your notebook or create a new one.
- Add a Query Grail section and query the data you're interested in, or add a Metrics section and select the required metric.
- Select Options.
- In the Options panel, select Analyze and alert and activate the analyzer.
- Select the Forecast analyzer and configure its parameters.
- Select Run analysis.
Dynatrace Intelligence calculates the forecast and shows it, extending your visualization.
Notebooks