Optimize performance and costs of dashboards running log queries
- Latest Dynatrace
- Tutorial
- 8-min read
- Published Jun 11, 2025
Logs are an essential monitoring signal. Many teams build their own dashboards that rely on logs.
Let’s look at the following dashboard that analyzes error logs generated by Kubernetes workloads running in a namespace.
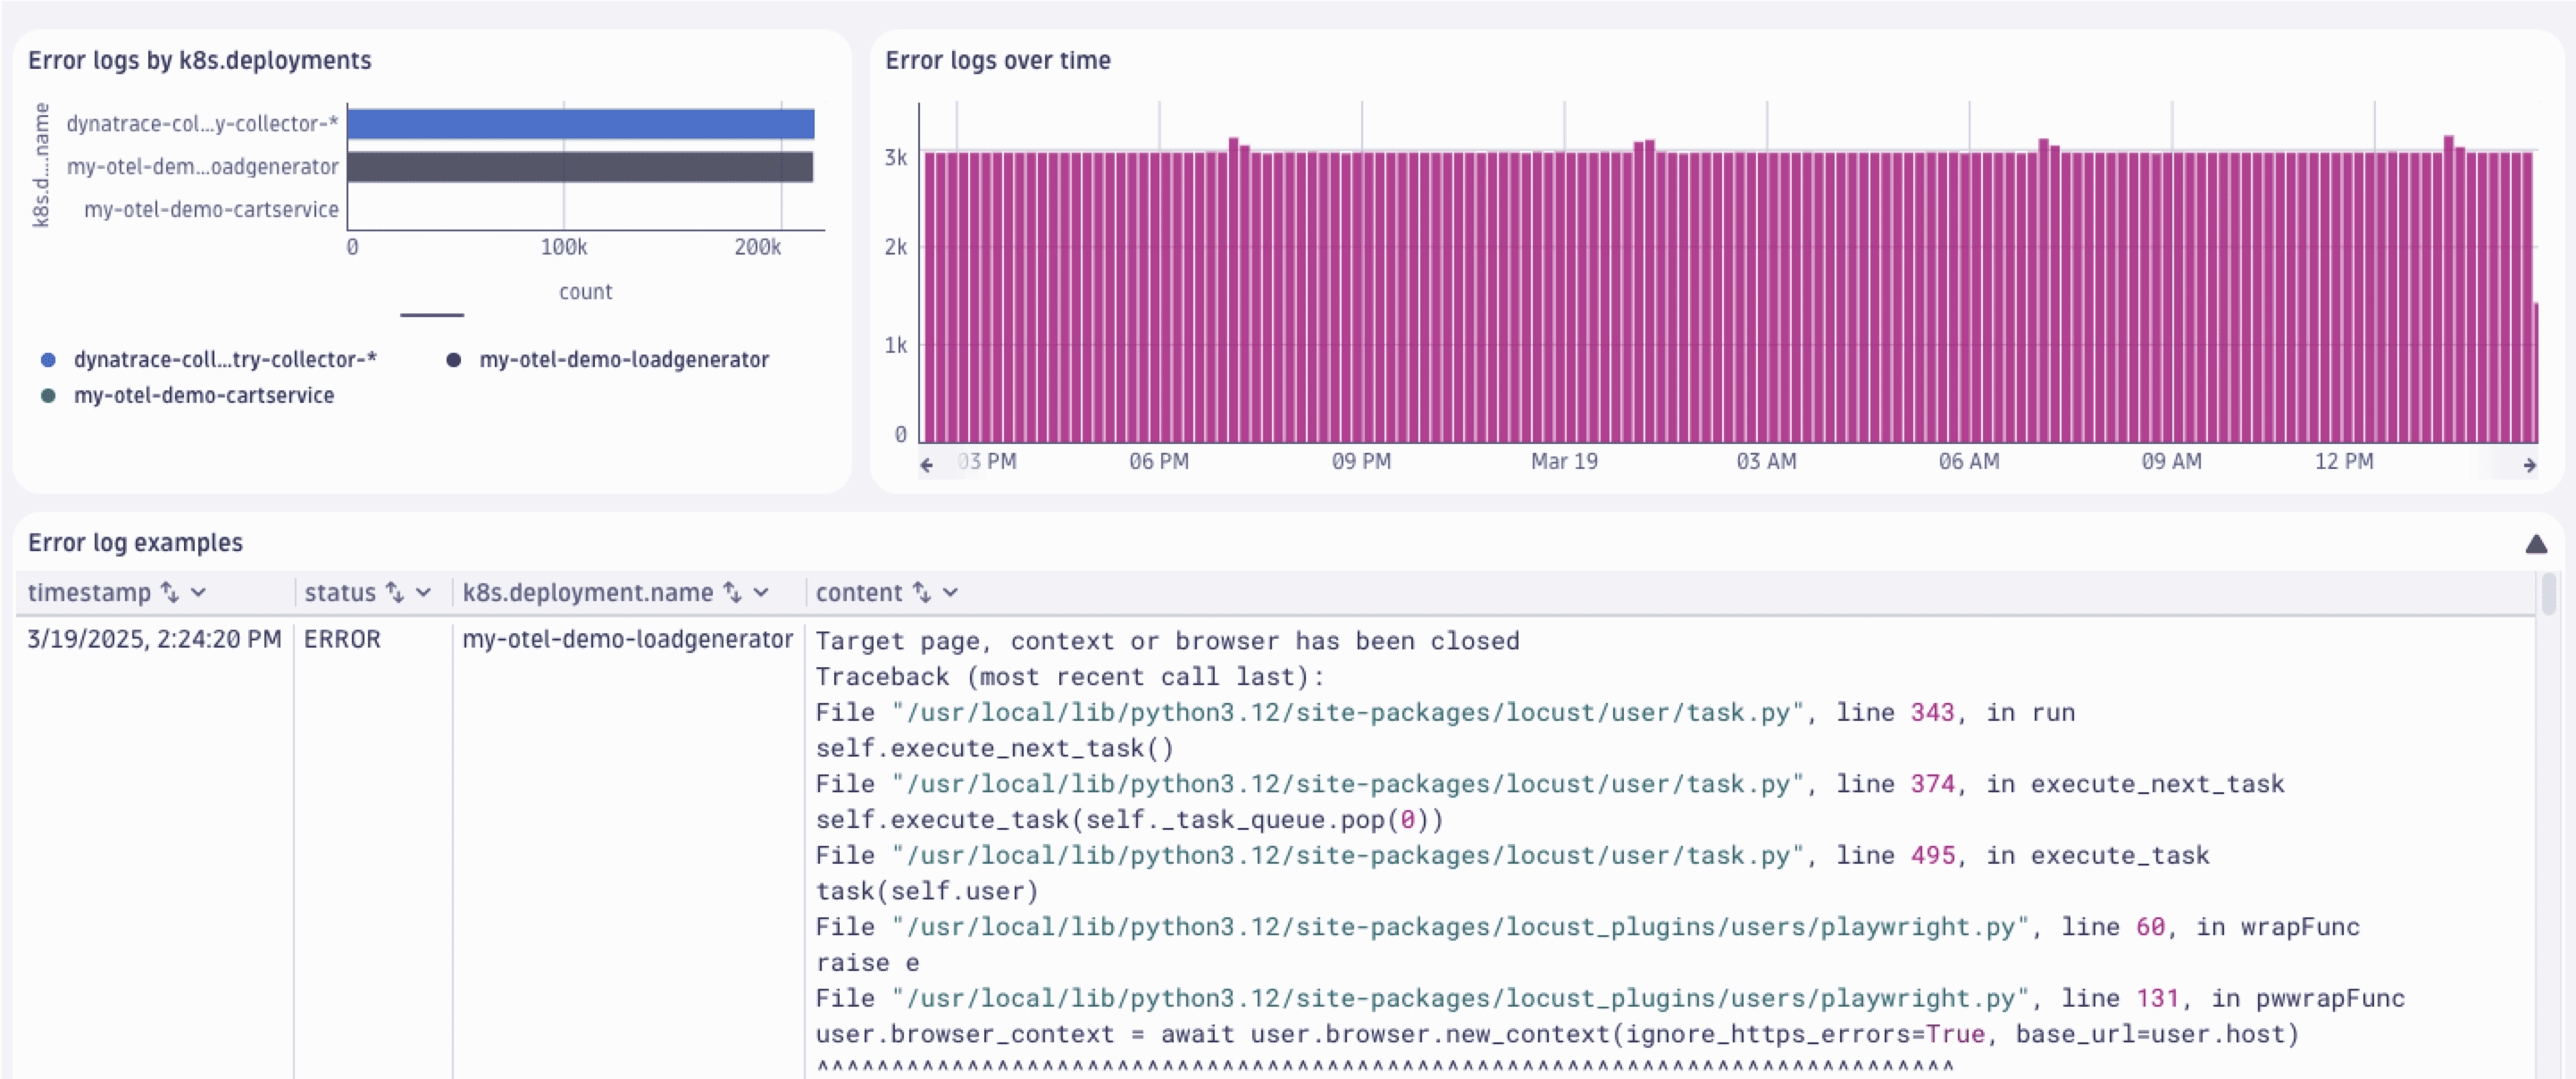
This dashboard uses two types of log queries:
-
Queries that aggregate log records
-
using the
makeTimeseriescommand.fetch logs| filter k8s.namespace.name == "obslab-log-problem-detection"| filter status == "ERROR"| makeTimeseries count = count() -
using the
summarizecommand.fetch logs| filter k8s.namespace.name == "obslab-log-problem-detection"| filter status == "ERROR"| summarize count = count(), by: { k8s.deployment.name } | sort count desc
-
-
A query that fetches logs to get log records in raw form.
fetch logs| filter k8s.namespace.name == "obslab-log-problem-detection"| filter status == "ERROR"
Team wants to know
- Which components generate the most errors.
- How the errors are distributed over time.
- What are the sample records.
In this guide you will learn different techniques to get this information while optimizing your dashboard for performance and costs.
How to optimize queries
Let’s look what you can do to optimize different types of queries.
Convert queries to metrics based on logs
When you are interested in aggregated values like sums, or counts spitted by a low cardinality dimension, follow the guide to Parse log lines and extract a metric.
In our example this is the required configuration for your metric extraction:
- Name:
errors in obslab-log-problem-detection - Matching condition:
k8s.namespace.name == "obslab-log-problem-detection" AND status == "ERROR" - Metric key:
log.k8s.obslab.errors - Dimensions:
k8s.workload.name
Then you have to adjust the DQL statement on the dashboard tile.
timeseries count = count(log.obslab.errors)
Once you have adjusted the two tiles, there will be no query cost generated on rendering the two tiles. Log-based metrics are licensed like any other Custom Metric powered by Grail.
It’s not always possible to extract metrics from any DQL query.
Be aware of dimensional cardinality, and specific commands like dedup or join.
If you can't extract metrics, you will need to optimize your DQL query and dashboard configuration.
Optimize DQL queries that can't be converted to metrics
Our dashboard example presents a log records content field. This is a high-cardinality field and as such it's not suitable for metric dimension.
The first thing you can do is to set the timeframe, segment, or bucket–if possible. This will increase the performance and decrease costs right away. To do so, simply edit the dashboard tile.
-
Set timeframe: Select the Custom timeframe toggle and choose the timeframe via the drop-down menu.
-
Set segment: Select the Custom segments toggle and choose the segment via the drop-down menu.
-
Set bucket: Add the following line to the DQL query.
| filter dt.system.bucket == "default_logs"
More DQL best practices for queries optimization are at DQL best practices.
Optimize the order of query commands
Looking at our query we can also filter early and set fields.
fetch logs| filter dt.system.bucket == "default_logs"| filter k8s.namespace.name == "obslab-log-problem-detection"| filter status == "ERROR"| fields timestamp, content, k8s.workload.name
If your use case allows, you can also set query limits. Scroll to Edit tile > Query limits. You can then configure
- Read data limit (GB).
- Record limit.
- Result size limit (MB).
- Sampling.
When you change the read data limit and record limit, users who need more results should use the Open with functionality and analyze logs in ![]() Logs.
Logs.
Reducing the sampling size reduces the amount of data that is scanned, and returns more diverse samples in large data sets. Sampling is useful for:
- Performance Optimization: Use sampling to analyze large datasets efficiently without processing all the data.
- Anomaly Detection: Use sampling to quickly identify unusual patterns or outliers in real-time.
- Trend Analysis: Use sampling to understand overall trends without examining every data point.
In situations when you count records (like using the summarize command), remember to multiply the result by sampling rate to get a better approximation of the result.
Sampling isn’t a good idea when you care about accuracy or scan small datasets.
Configure bucket to use Retain with Included Queries
If many users frequently open a dashboard and they query shorter time ranges (data that is less than 35 days old), consider using the Retain with Included Queries pricing model and set the appropriate IAM permissions.
For the detailed instructions on the bucket configuration, see Take control of log query costs using Retain with Included Queries.
Turn off auto-refresh
When your dashboard is automatically refreshed every minute, all your queries will be executed. If you are using log queries, you are charged per execution.
Consider switching off the auto-refresh functionality via the drop-down menu and selecting Off.
Conclusion
By using the techniques mentioned above, we reduced the size of the scanned data for a 24-hour timeframe from 12.3 GB to 147 MB. Your results may vary.
Best practices:
-
If possible, use metrics based on logs as described in Set up custom alerts based on metrics extracted from logs. Metrics are faster, have longer and cheaper retention, queries for metrics are not charged, you can drop the log records contributing to a metric and save on retention costs, can metrics be used for alerting.
To extract metrics, Parse log lines and extract a metric with OpenPipeline.
-
If your use case requires that log content (or other high-cardinality data) is presented via dashboards, optimize your DQL queries by setting timeframe, segments, buckets, query limits, and disable auto-refresh.
Learn more
 OpenPipeline