Log events (Logs Classic)
- Dynatrace Classic
- Tutorial
- 5-min read
Log Monitoring Classic
Dynatrace Log Monitoring gives you the ability to create log events based on log data and use them in problem detection.
Log event pricing is based on the Davis data units (DDUs) model. Check DDUs for custom Davis events to find out how you can estimate and track DDU consumption for log events.
When Dynatrace ingests log data, it applies the query specified in the log event definition. Every matched occurrence triggers a log event that can be configured to individually create a problem for each triggered log event or can be merged into one problem.
Create a log event
-
Go to Settings > Log Monitoring > Events extraction and select Add log event.
-
Enter the Summary.
The summary acts as the display name of the log event configuration. The summary must be unique for all configurations. -
Enter the Matcher.
Enter the Log Monitoring query to filter the log data for your log event. For details, see Log viewer.I switched to GrailIf you switched to Dynatrace Grail, you may begin using the DQL functions in your Log Monitoring queries. For details, see Log processing with classic pipeline.
-
Configure the Event template.
-
Provide the Title of the event to trigger. If this log event triggers a problem, this title will also be the title of the problem.
-
Provide the Description of the event. Note that you can have one or more placeholders in the description (see Placeholders below for details).
-
Select the Event Type. Event types indicate the severity of the event. See Settings API - Log events schema table.
-
-
Choose whether to Allow merge.
If two or more events are triggered, Dynatrace could merge these events into a single problem. This option lets you choose to disable this behavior, which can result in more reported problems.The
dt.event.allow_davis_mergeproperty does not split problems for the same log event configuration. It only prevents merging with problems from other log event configurations or other problem domains (such as custom alerts).
If you want to split problems for the same log event configuration, theevent.unique_identifierproperty must be present in the actual log data. You can then use a placeholder in your log event configuration to reference this property.
For example, to create a separate problem for each log line message, useevent.unique_identifier={content}. -
Add Properties. A property is a key/value pair that is set on every triggered event. You can have one or more placeholders as a value that will be extracted from the log data. For example, a property with Key set to
PGIand a Value of placeholder{dt.entity.process_group_instance}will extract the process group instance value from log data once the event is triggered. If the placeholder substitution fails, both the key and the value will not be available.
To see how to get the full list of properties, go to Events API v2 - GET all event properties. Thedescriptionfield in the API response body explains how each property works. For example: In thedt.event.allow_davis_merge, the description says :"Allow Davis AI to merge this event into existing problems (true) or force creating a new problem (false)".
Set a timeout for a log event
Log events have a default timeout of 15 minutes. The timeout defines how frequently the event source must refresh the log event to keep it active. The maximum time allowed for a log event is six hours.
- A log event is kept active if the event source sends a refresh before the event times out (default:
15minutes). - An event automatically closes if no refresh is sent within the timeout period.
- You can customize the timeout.
To set a custom timeout
- When you create or edit a log event, select Add property.
- Set Key to
dt.event.timeout. - Set Value to the number of minutes (for example,
12).
To verify that a custom timeout was added for an event triggered on the host level
- Go to
 Hosts Classic and select the host name.
 - Scroll down to Events and expand Details for the event.
Placeholders
Placeholders are log entry attributes that can be used to extract the actual value from the log data.
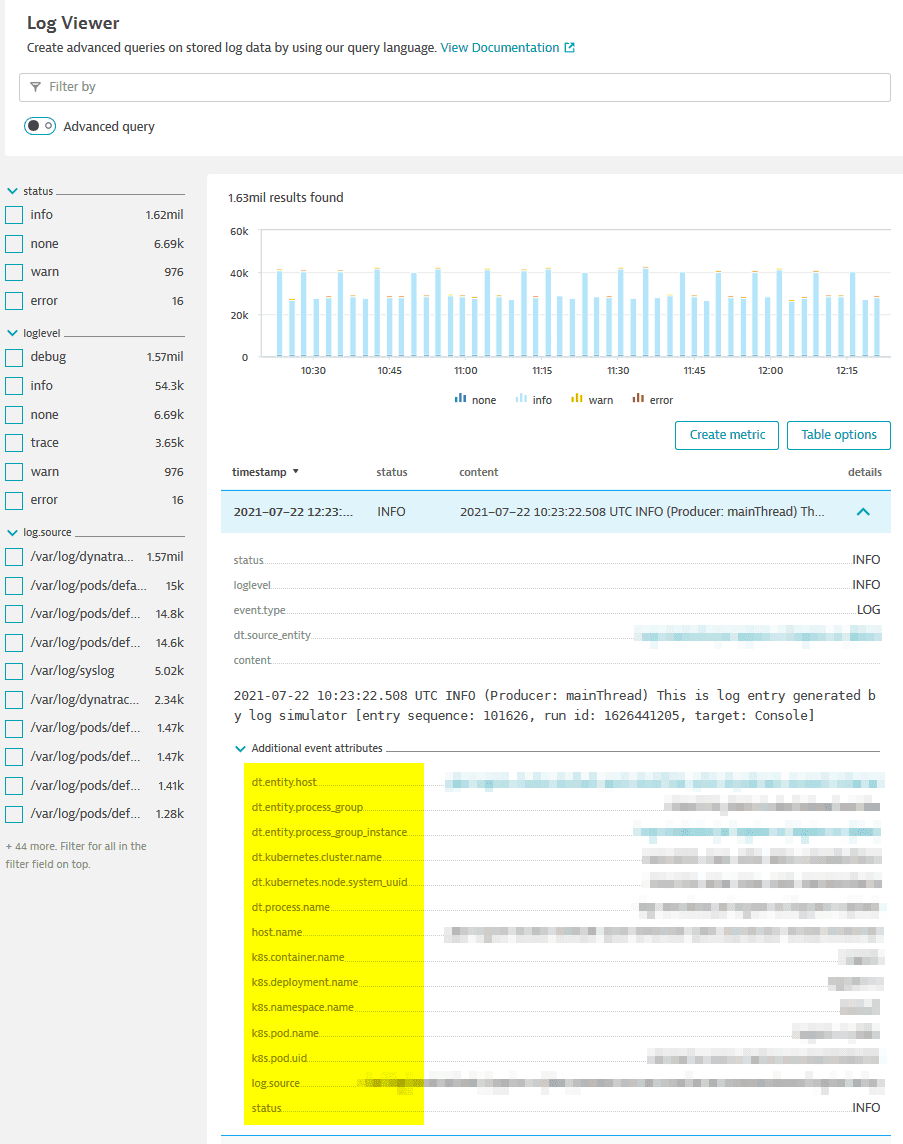
- You can use any attribute listed in the log viewer for a given log entry as a placeholder to extract that attribute value.
- You can use additional log entry attributes in the log viewer as placeholders for the values they represent in the log data. Enclose placeholder values in brackets (for example,
{dt.process.name}).
Log viewer showing additional log entry attributes

Example
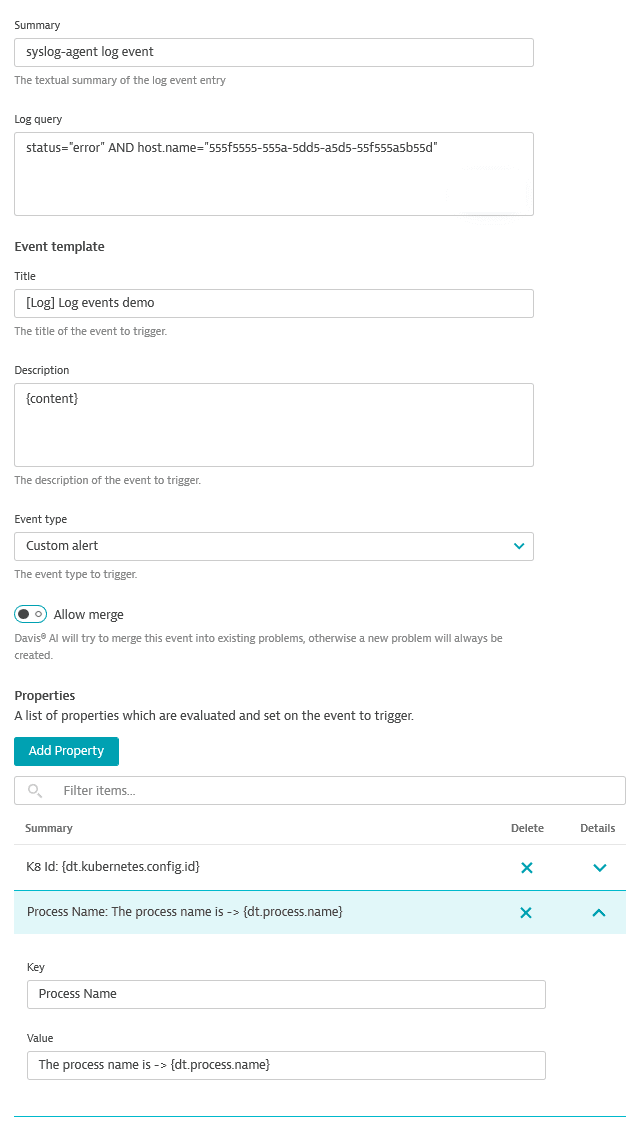
In this example, we create a log event based on ingested log data. This log event will be triggered when the ingested log entry matches the input from the Matcher field. The matcher will search for status error on the 555f5555-555a-5dd5-55f555a5b55d host. We add log event properties (attributes) that will extract values from the log data and include it in the problem summary.
- Go to Settings > Log Monitoring > Events extraction and select Add log event.
- Set the following:
- Summary:
syslog-agent log event - Matcher:
status="error" AND host.name="555f5555-555a-5dd5-55f555a5b55d" - Event template - Title:
[Log] log events demo - Event template - Description:
{content} - Event template - Event type:
Custom alert
- Summary:
- Turn off Allow merge.
- For Properties, add the following two properties:
- Key
K8 Idwith value{dt.kubernetes.config.id} - Key
Process Namewith valueThe process name is -> {dt.process.name}
- Key
- Save your changes and wait for log data to be ingested.
Log events example page

Logs can have attributes with long values, up to 32kB. Such attribute can be added as part of the Event template section. In such case, the events are created, but those values are trimmed to 4096.
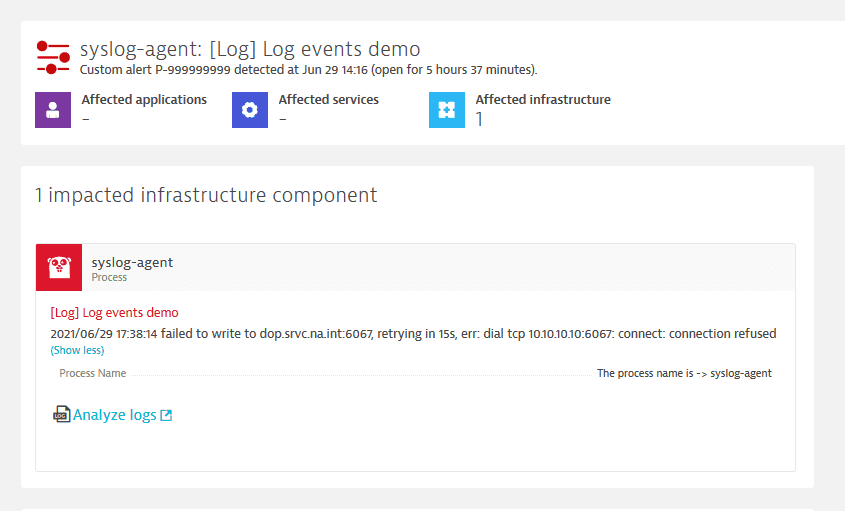
If a match is found, this log event will create a problem with each triggered log event.

The problem created as a result of a triggered log event will contain the information mapped from your log event configuration. The problem title is the Event title and the impact section reflects your Event type settings and additional information you configured in the description and properties of the log event.
Note that, in this example, while we have configured two properties (K8 Id and Process Name), only one appears on the problem page. This is because only the {dt.process.name} placeholder had a value in the ingested log data. The {dt.kubernetes.config.id} value was not found in that particular log entry and the defined property was ignored.