Ingest Kubernetes logs with OneAgent
- Latest Dynatrace
- Tutorial
- 6-min read
- Published Mar 20, 2026
In this tutorial, we'll cover how to enable Kubernetes log ingest with OneAgent via the Log module, create log ingest rules, mask sensitive data, and fine-tune the configuration to upload only relevant logs.
Who is this for?
Kubernetes owner, practitioner, or Dynatrace admin setting up Kubernetes log monitoring with the OneAgent Log module.
What will you learn?
As a Dynatrace admin, you want to track whether there are Kubernetes cluster node issues and set up log observability for running Workloads.
In this tutorial, you'll learn how to:
- Review and adjust automatically created log ingest rules for your cluster scope.
- Create custom log ingest rules to include only relevant Kubernetes logs.
Before you begin
Before you begin, start monitoring your Kubernetes cluster.
-
Review supported Kubernetes distributions in Technology support.
-
The OneAgent Log module automatically discovers logs written to the
stdoutandstderrstreams by containerized applications running in pods. Details and alternatives for logs written to the container filesystem are available under Stream Kubernetes logs with Dynatrace Log Module. -
Deploy Dynatrace Operator based on the Kubernetes quickstart guide.
- Use the Kubernetes platform monitoring + Full-Stack observability option.
- Make sure you turn on Log Management and Analytics.
- If you want to deploy Log Management and Analytics to certain resources only, expand Analyze logs of your workloads and nodes in context, select Restrict Log monitoring to certain resources, and provide the Namespaces and Pod Annotation to select the pods you want to monitor.
If you already monitor your Kubernetes cluster, you might need to modify the DynaKube custom resource YAML file. Check the configuration and, if necessary, update or add the logMonitoring: {} section. See Kubernetes log monitoring for details.
Ingest Kubernetes logs with OneAgent
Start by reviewing the built-in log ingest rules to understand what is already collected for your Kubernetes cluster.
1. Review built-in log ingest rules
Let's review the log ingest rules that were automatically created during Dynatrace Operator deployment.
These rules define which autodiscovered log sources are ingested and stored in Grail.
As you've completed the Kubernetes quickstart guide, the related log ingest rules are already in place, and your Kubernetes logs are already ingested.
To access these logs, go to ") Kubernetes, select the required Kubernetes object, and go to the Logs tab. Alternatively, go to
Kubernetes, select the required Kubernetes object, and go to the Logs tab. Alternatively, go to ![]() Logs.
Logs.
If you've decided to restrict log monitoring to certain resources when deploying Dynatrace Operator based on the Kubernetes quickstart guide (Restrict Log monitoring to certain resources option), follow the steps below.
- Go to
 Settings > Collect and capture > Log monitoring > Log ingest rules.
 - Review the log ingest rules for the environment configuration scope and modify them properly if needed. Make sure that there are no inherited rules from the environment scope that would ingest additional logs.
- Optional Switch to the Kubernetes cluster scope and add an exclusion log ingest rule.
-
In the upper-left corner of
Settings, select Go to entity >, and choose the required Kubernetes cluster. -
Add an Exclude all log ingest rule and move it to the bottom of the rule list for this Kubernetes cluster. This prevents any inherited rules from being evaluated.
You can also add such an exclusion rule on the Kubernetes cluster scope by using the Settings API.
-
Congratulations! You can now inspect errors in the Kubernetes cluster node view.
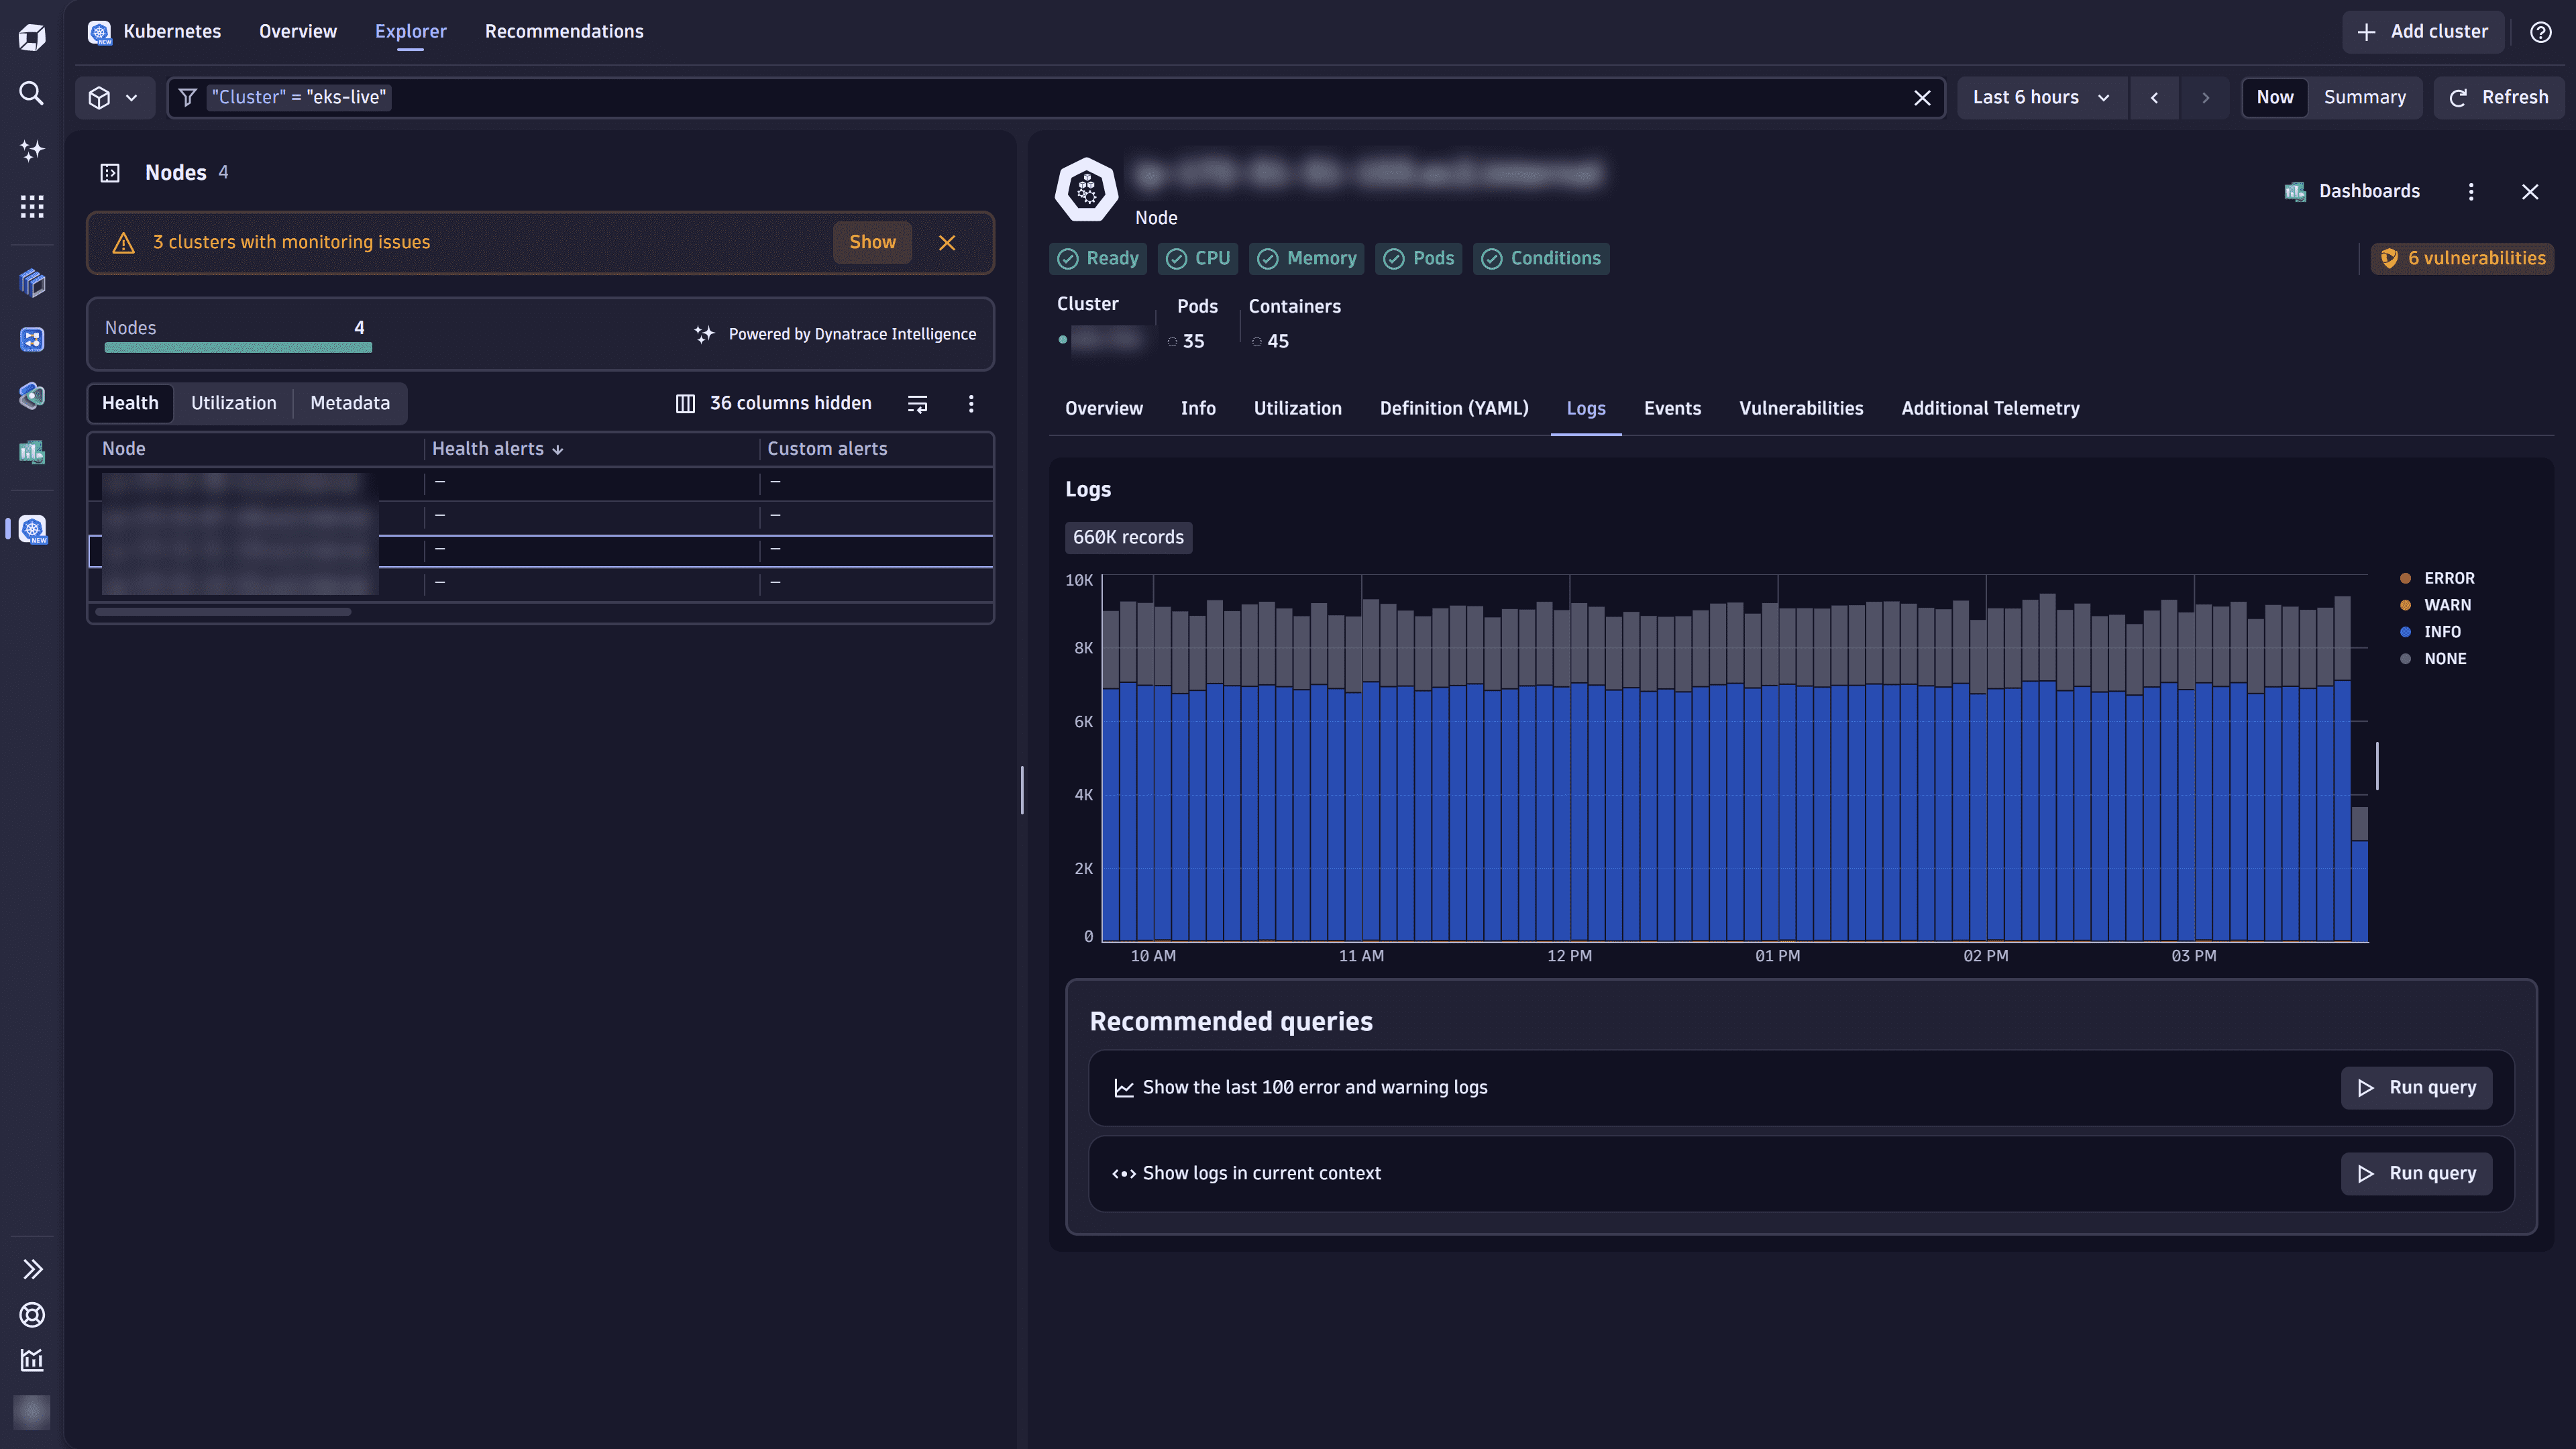
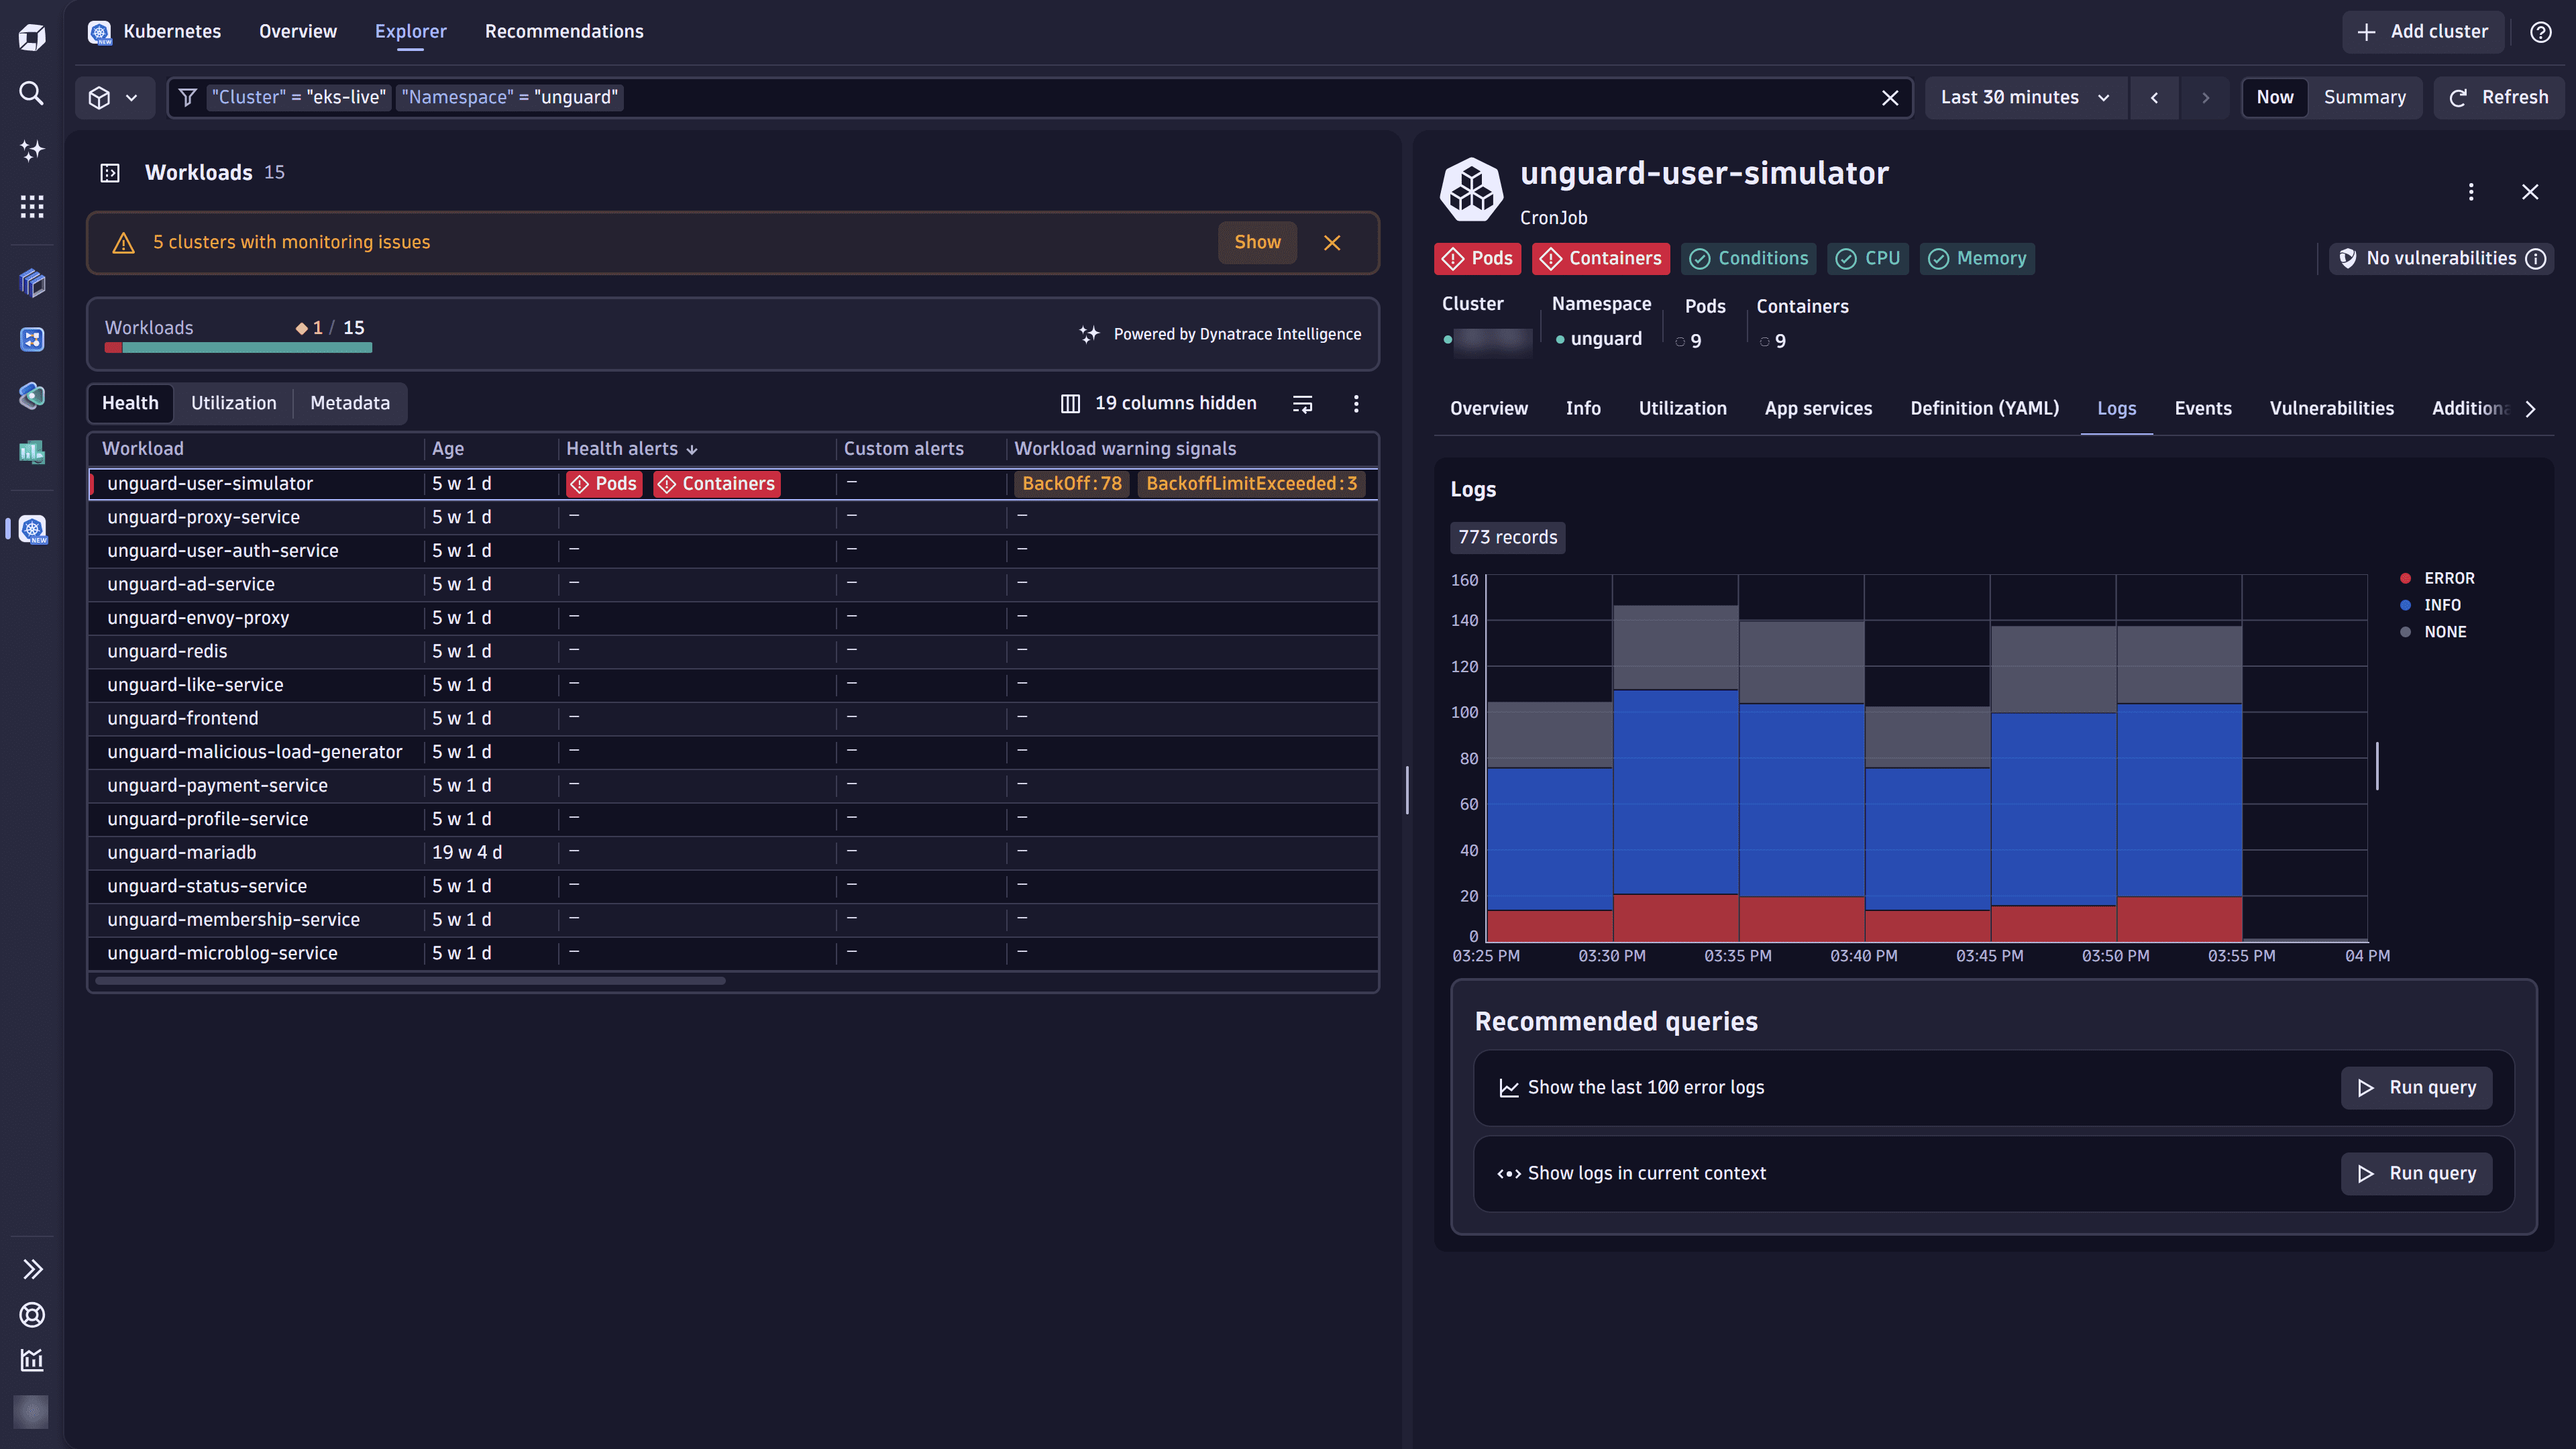
Moreover, you can analyze logs of your workloads in the Kubernetes workload view.
You can end this tutorial here. Optionally, you can fine-tune log ingestion with custom rules and sensitive data masking by following the steps in the next sections.
2. Configure a custom log ingest ruleOptional
The DynaKube log configuration from the previous steps is immutable and used only during onboarding. You should manage additional log ingest rules via the Dynatrace web UI or Settings API.
To configure a log ingest rule for a specific Kubernetes cluster scope
- Go to Settings, select Go to entity > in the upper-left corner of the page, and find your cluster.
- Go to Collect and capture > Log monitoring > Log ingest rules.
Alternatively, open the required Kubernetes cluster in
Kubernetes, and select (Actions menu) > Log ingest rules in the cluster details pane. - Select Add rule to create a log ingest rule.
- Provide a descriptive name for the rule in Rule name.
- Set Rule type to Include in storage.
- Select Add condition, and specify the following condition:
- Matcher attribute: Kubernetes namespace name
- Value: The required namespace name.
- Select Save and close at the bottom of the page.
See Stream Kubernetes logs with Dynatrace Log module for more examples.
If you want all Kubernetes clusters in your environment to be configured the same way, you need to define log ingest rules at the environment scope.
To configure a log ingest rule for the environment configuration scope
- Go to the Settings > Collect and capture > Log monitoring > Log ingest rules.
- Complete steps 3–7 from the instructions above.
Note that any rules on the Kubernetes cluster scope override the rules set on the environment scope when the same Conditions are used.
If you want to manage log ingest rules only on the environment scope, disable the rule created by Dynatrace Operator at the Kubernetes cluster scope. Do not remove rules created by Dynatrace Operator as they can be recreated.
3. Mask sensitive data at edgeOptional
Let's use an email address example from Sensitive data masking in OneAgent.
Follow these instructions to create a custom sensitive data masking rule.
- Go to Settings.
- In the upper-left corner of the page, select Go to entity > and find your cluster.
- Go to Collect and capture > Log monitoring > Sensitive data masking.
- Select Add rule, specify the Rule name, and enter
\b[\w\-\._]+?@[\w\-\._]+?\.\w{2,10}?\bin Search expression. - Optional Use the Condition section to target a specific namespace, workload, or container with your masking rule.
- Select Save and close.
After you're created this masking rule, the rule is propagated to all log modules in the selected Kubernetes cluster, and sensitive data is masked before leaving your environment.
Best practices for ingesting and configuring log sources at scale
- To avoid maintenance overhead, keep log rules at the highest scope possible using matchers to target process technologies or Kubernetes objects.
- The built-in Log ingestion overview dashboard helps keep track of log volumes and health status. See Ready-made dashboards to learn more.
Troubleshooting
The following is a solution to a problem some people have.
Why are logs still missing after enabling Log monitoring?
Congratulations!
You've completed the tutorial!
Now that you've turned on Kubernetes log ingestion and set up your log ingest rules, you can track whether there are Kubernetes cluster node issues for effective troubleshooting of your workloads.