End-to-end observability of AI applications running on Kubernetes
- Latest Dynatrace
- How-to guide
- 5-min read
Modern applications are increasingly built using microservices architectures, often deployed on Kubernetes. AI agents and applications are usually bundle into one or more of these microservices. This distributed nature introduces complexity in monitoring, troubleshooting, and optimizing performance across multiple interconnected services. Dynatrace simplifies this challenge by providing comprehensive end-to-end observability for applications running on Kubernetes.
What you will learn
In this tutorial, we will
- Configure your environment.
- Explore how the Dynatrace platform helps you achieve end-to-end visibility of your AI applications running on Kubernetes.
We'll use OpenTelemetry/OpenLLMetry as the primary mechanism to emit GenAI specific telemetry data (spans/metrics such as models, tokens, latencies, and costs) into Dynatrace.
OneAgent complements this by delivering full-stack Kubernetes and application context (infrastructure health, workload/process detection, logs, code-level visibility, vulnerability) and by correlating OTEL traces with services, problems, and Dynatrace Intelligence insights.
Configuration
1. Configure your environment
- Make sure your Kubernetes environment has Full-Stack Observability.
- Enable Service Detection v2 for Kubernetes.
2. Deploy the Dynatrace Collector
For production workloads, it is recommended to also route OpenLLMetry traffic through an OpenTelemetry collector. The collector provides sampling features that help controlling the cost for OpenTelemetry data.
- Save the following YAML configuration as
values.yaml
mode: deploymentimage:repository: ghcr.io/dynatrace/dynatrace-otel-collector/dynatrace-otel-collectortag: 0.33.0command:name: dynatrace-otel-collectorextraEnvs:- name: DT_API_TOKENvalueFrom:secretKeyRef:name: dynatrace-otelcol-dt-api-credentialskey: DT_API_TOKEN- name: DT_ENDPOINTvalueFrom:secretKeyRef:name: dynatrace-otelcol-dt-api-credentialskey: DT_ENDPOINTresources:limits:memory: 512MialternateConfig:extensions:health_check:endpoint: "${env:MY_POD_IP}:13133"processors:cumulativetodelta:max_staleness: 25hk8sattributes:extract:metadata:- k8s.pod.name- k8s.pod.uid- k8s.pod.ip- k8s.deployment.name- k8s.replicaset.name- k8s.statefulset.name- k8s.daemonset.name- k8s.job.name- k8s.cronjob.name- k8s.namespace.name- k8s.node.name- k8s.cluster.uid- k8s.container.nameannotations:- from: podkey_regex: metadata.dynatrace.com/(.*)tag_name: $$1- from: podkey: metadata.dynatrace.comtag_name: metadata.dynatrace.compod_association:- sources:- from: resource_attributename: k8s.pod.name- from: resource_attributename: k8s.namespace.name- sources:- from: resource_attributename: k8s.pod.ip- sources:- from: resource_attributename: k8s.pod.uid- sources:- from: connectiontransform:error_mode: ignoretrace_statements: &dynatrace_transformations# Set attributes taken from k8s metadata.- context: resourcestatements:- set(attributes["k8s.workload.kind"], "job") where IsString(attributes["k8s.job.name"])- set(attributes["k8s.workload.name"], attributes["k8s.job.name"]) where IsString(attributes["k8s.job.name"])- set(attributes["k8s.workload.kind"], "cronjob") where IsString(attributes["k8s.cronjob.name"])- set(attributes["k8s.workload.name"], attributes["k8s.cronjob.name"]) where IsString(attributes["k8s.cronjob.name"])- set(attributes["k8s.workload.kind"], "daemonset") where IsString(attributes["k8s.daemonset.name"])- set(attributes["k8s.workload.name"], attributes["k8s.daemonset.name"]) where IsString(attributes["k8s.daemonset.name"])- set(attributes["k8s.workload.kind"], "statefulset") where IsString(attributes["k8s.statefulset.name"])- set(attributes["k8s.workload.name"], attributes["k8s.statefulset.name"]) where IsString(attributes["k8s.statefulset.name"])- set(attributes["k8s.workload.kind"], "replicaset") where IsString(attributes["k8s.replicaset.name"])- set(attributes["k8s.workload.name"], attributes["k8s.replicaset.name"]) where IsString(attributes["k8s.replicaset.name"])- set(attributes["k8s.workload.kind"], "deployment") where IsString(attributes["k8s.deployment.name"])- set(attributes["k8s.workload.name"], attributes["k8s.deployment.name"]) where IsString(attributes["k8s.deployment.name"])# remove the delete statements if you want to preserve these attributes- delete_key(attributes, "k8s.deployment.name")- delete_key(attributes, "k8s.replicaset.name")- delete_key(attributes, "k8s.statefulset.name")- delete_key(attributes, "k8s.daemonset.name")- delete_key(attributes, "k8s.cronjob.name")- delete_key(attributes, "k8s.job.name")# Set attributes from metadata specified in Dynatrace and set through the Dynatrace Operator.# For more info: https://docs.dynatrace.com/docs/shortlink/k8s-metadata-telemetry-enrichment- context: resourcestatements:- merge_maps(attributes, ParseJSON(attributes["metadata.dynatrace.com"]), "upsert") where IsMatch(attributes["metadata.dynatrace.com"], "^\\{")- delete_key(attributes, "metadata.dynatrace.com")metric_statements: *dynatrace_transformationslog_statements: *dynatrace_transformationsreceivers:otlp:protocols:grpc:endpoint: ${env:MY_POD_IP}:4317http:endpoint: ${env:MY_POD_IP}:4318filelog: nullexporters:otlp_http:endpoint: "${env:DT_ENDPOINT}"headers:Authorization: "Api-Token ${env:DT_API_TOKEN}"service:extensions: [health_check]pipelines:traces:receivers: [otlp]processors: [k8sattributes, transform]exporters: [otlp_http]metrics:receivers: [otlp]processors: [k8sattributes, transform, cumulativetodelta]exporters: [otlp_http]logs:receivers: [otlp]processors: [k8sattributes, transform]exporters: [otlp_http]
It is recommended to set the max_staleness parameter of the cumulativetodelta processor to a value higher than how often the collector receives metrics (e.g., how often metrics via OTLP are received, or how long the Prometheus scrape interval is). This ensures that no references to abandoned metric streams accumulate in memory over time.
- Run the following commands to configure and install the OpenTelemetry collector.
helm repo add open-telemetry https://open-telemetry.github.io/opentelemetry-helm-chartshelm repo updatehelm upgrade -i dynatrace-collector open-telemetry/opentelemetry-collector -f values.yaml
3. Instrument your code
-
Create a Dynatrace token so OpenLLMetry can report data to your Dynatrace tenant, see Platform tokens. The token needs to have the following scopes:
- Ingest metrics (
metrics.ingest) - Ingest logs (
logs.ingest) - Ingest OpenTelemetry traces (
openTelemetryTrace.ingest)
- Ingest metrics (
-
Initialize OpenLLMetry with the token to collect all the relevant KPIs.
How you initialize the framework depends on the language.
The Dynatrace backend exclusively works with delta values and requires the respective aggregation temporality. Make sure your metrics exporter is configured accordingly, or set the
OTEL_EXPORTER_OTLP_METRICS_TEMPORALITY_PREFERENCE environment variable toDELTA.-
Install the OpenLLMetry SDK. Run the following command in your terminal.
pip install traceloop-sdk -
Initialize the tracer. Add the following code at the beginning of your main file.
from traceloop.sdk import Traceloopheaders = { "Authorization": "Api-Token <YOUR_DT_API_TOKEN>" }Traceloop.init(app_name="<your-service>",api_endpoint="https://<YOUR_ENV>.live.dynatrace.com/api/v2/otlp", # or OpenTelemetry Collector URLheaders=headers)Replace the placeholders with relevant values:
<YOUR_ENV>: Your Dynatrace environment. For more information, see Base URLs.<YOUR_DT_API_TOKEN>: The token that you created in the previous step.<your-service>: Your app's name.
-
Depending on your framework, you'll need to add annotations to get proper tracing. These include, for example,
@workflow,@task,@agent, and@tool. For more information about annotations, see Install OpenLLMetry for Python.
-
Platform capabilities
The combination of OneAgent and OpenLLMetry empowers end-to-end tracing across services. OpenTelemetry/OpenLLMetry emits GenAI spans and metrics (for example, model, token usage, latency, cost) based on the OpenTelemetry semantic conventions for GenAI. For more information, see Semantic Conventions for GenAI agent and framework spans.
There are multiple ways you can leverage GenAI spans and metrics.
-
In
 Distributed Tracing, it is possible to inspect the GenAI requests.
On the right-hand side, GenAI attributes are available for the relevant GenAI spans, providing detailed insights into key metrics. These attributes help developers and operators better understand the performance and behavior of GenAI components, enabling more effective monitoring and optimization of AI-powered services.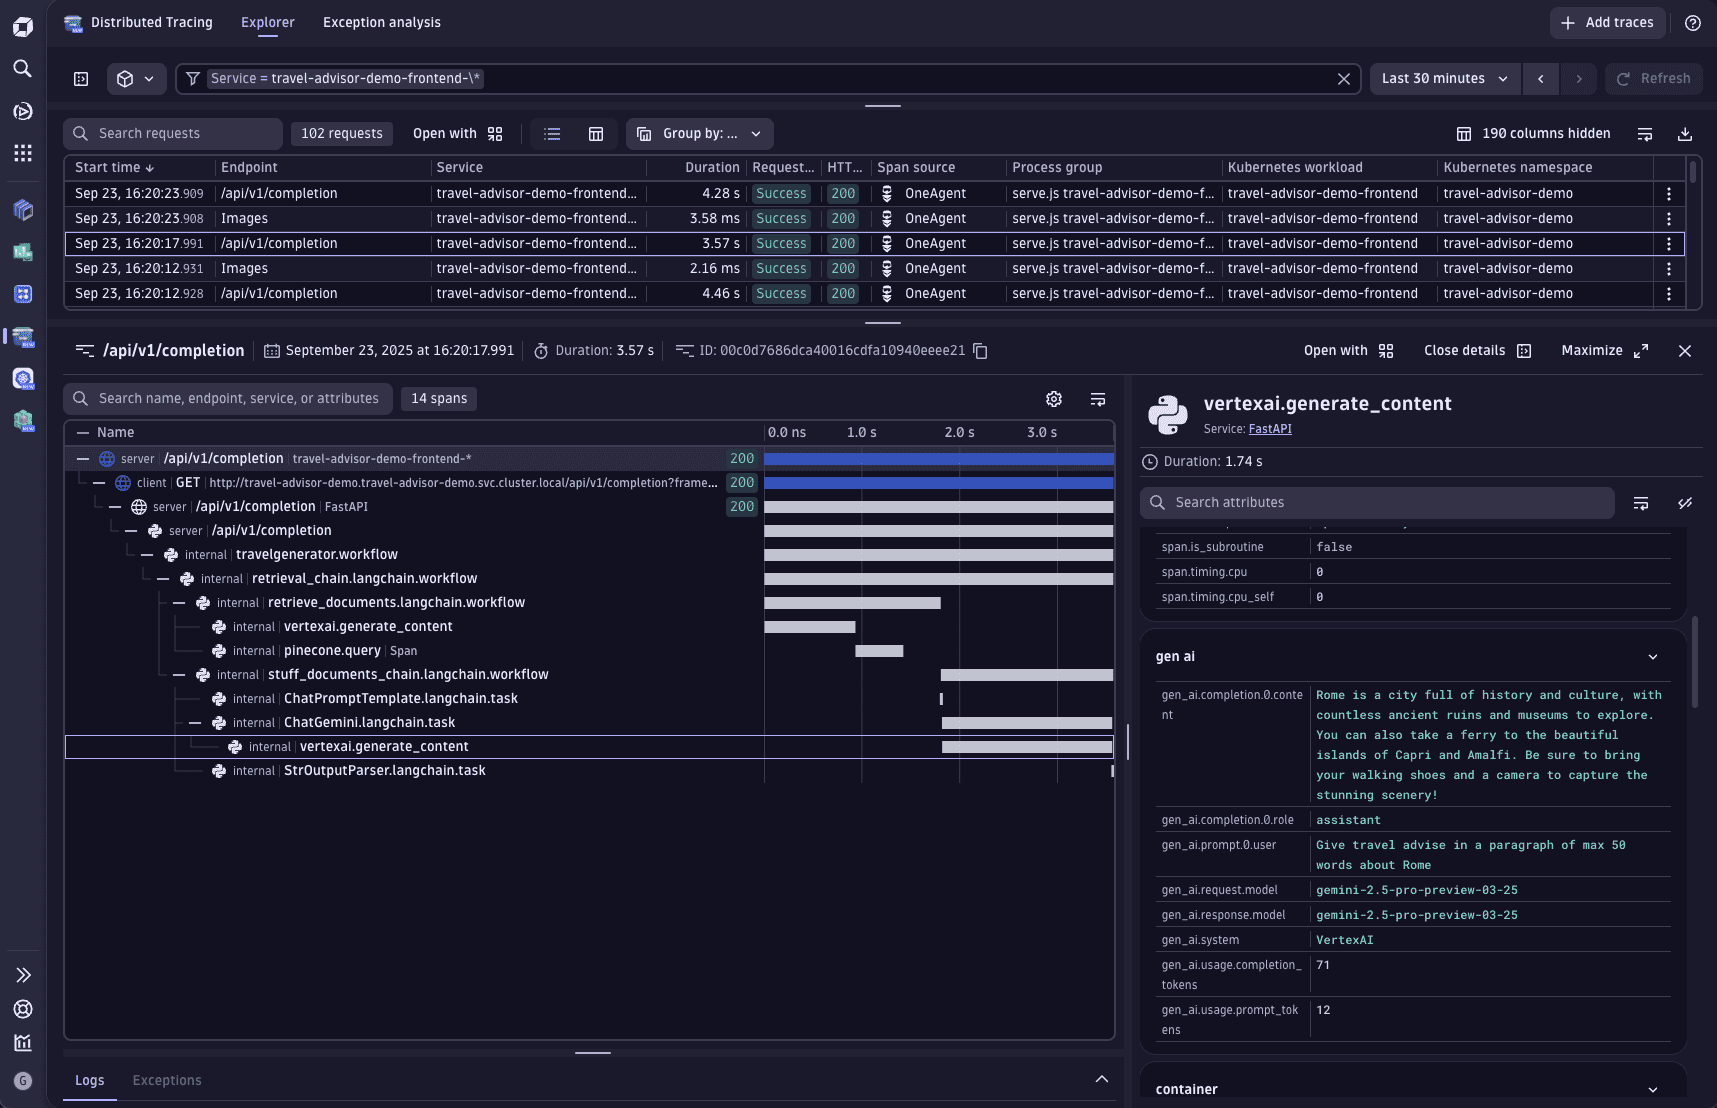 Multi Service Trace
 -
Furthermore, advanced features like Application Security are now available. In
") Kubernetes, you can directly see if your AI agents or services have any active vulnerabilities.
Kubernetes, you can directly see if your AI agents or services have any active vulnerabilities.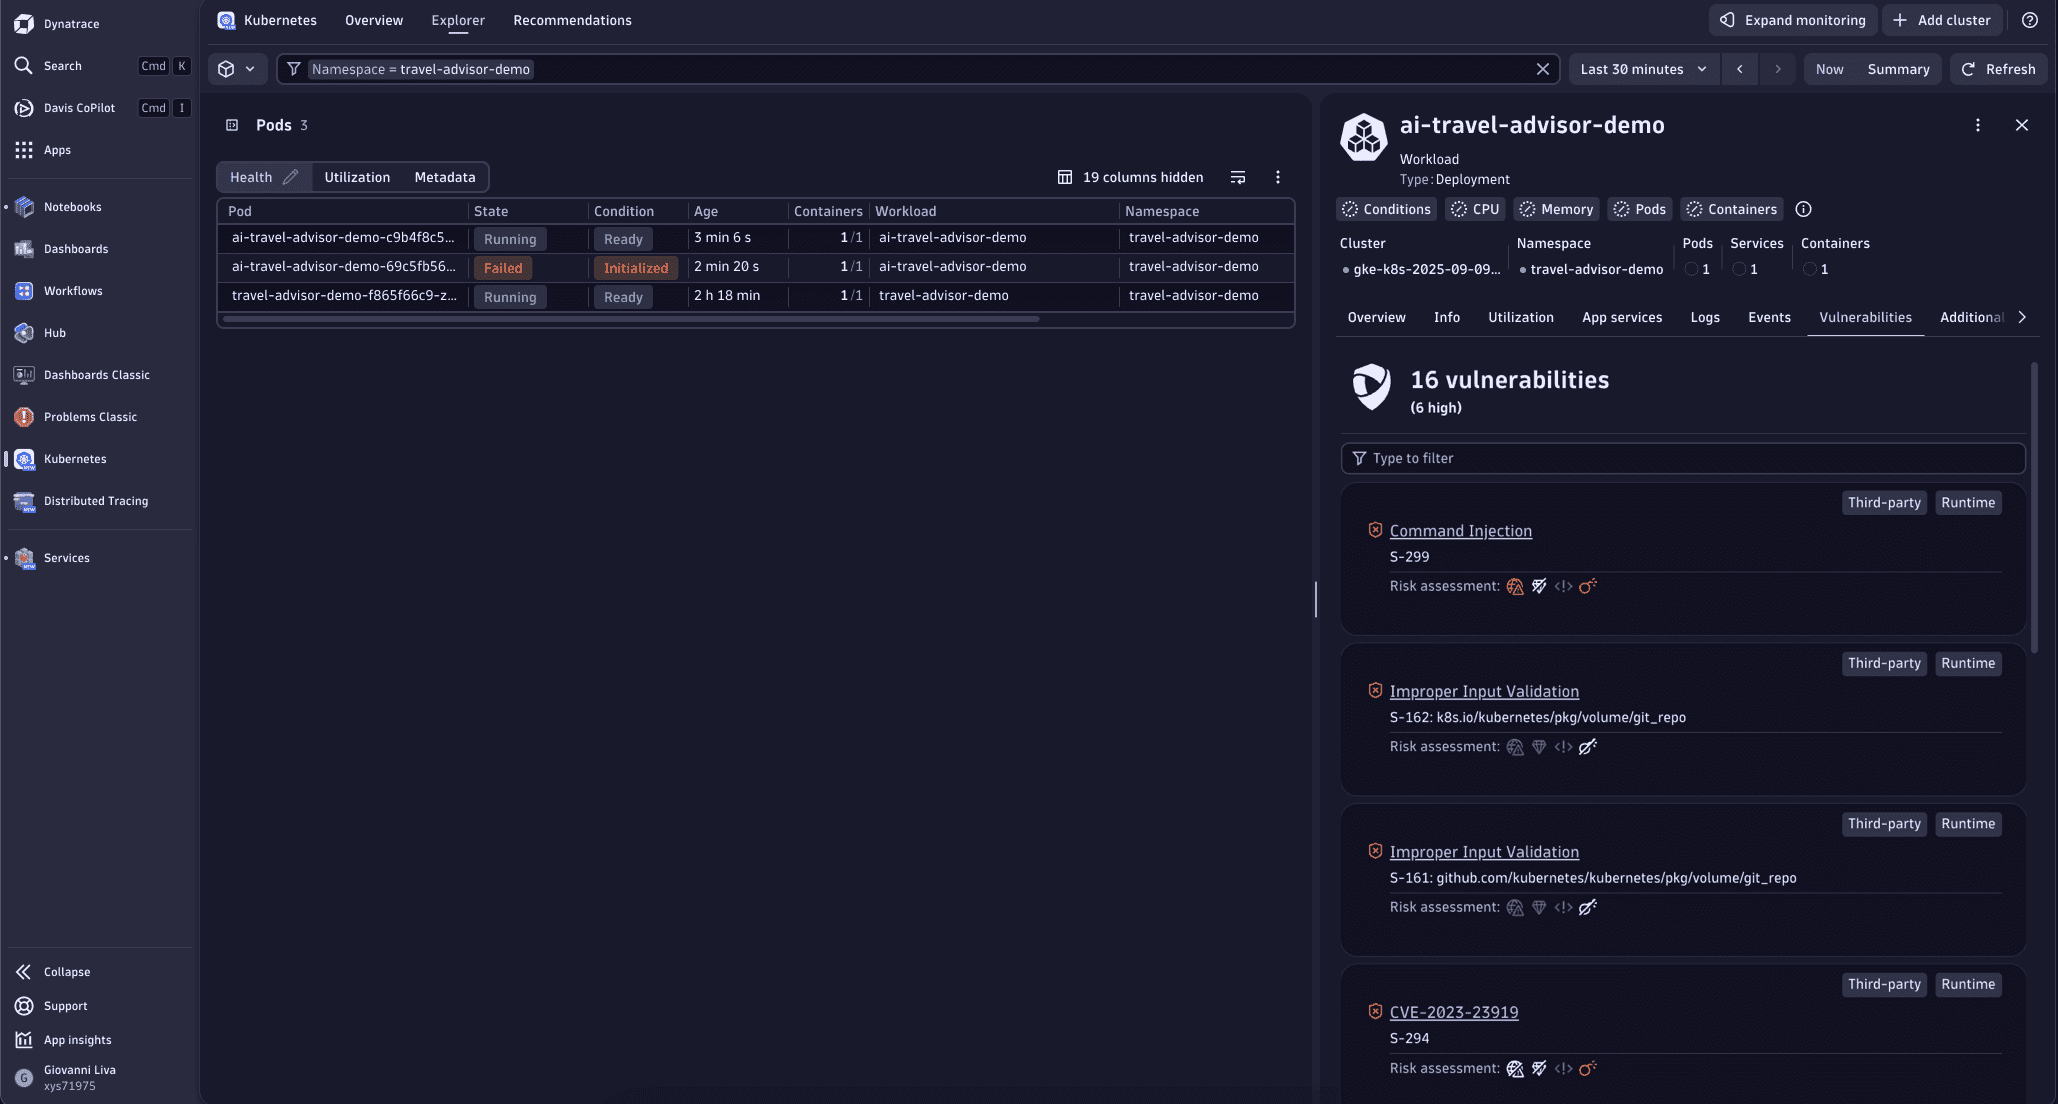 Vulnerabilities
 -
In the
Kubernetes > Deployments > Workload > Additional Telemetry tab, additional metrics are also displayed for the monitored service, which enable you to discover new AI signals to help you better understand your workloads.You can also add the displayed metrics directly in
 Dashboards without the need to manually create DQL queries.
To do this, select > Pin to dashboard.
Dashboards without the need to manually create DQL queries.
To do this, select > Pin to dashboard.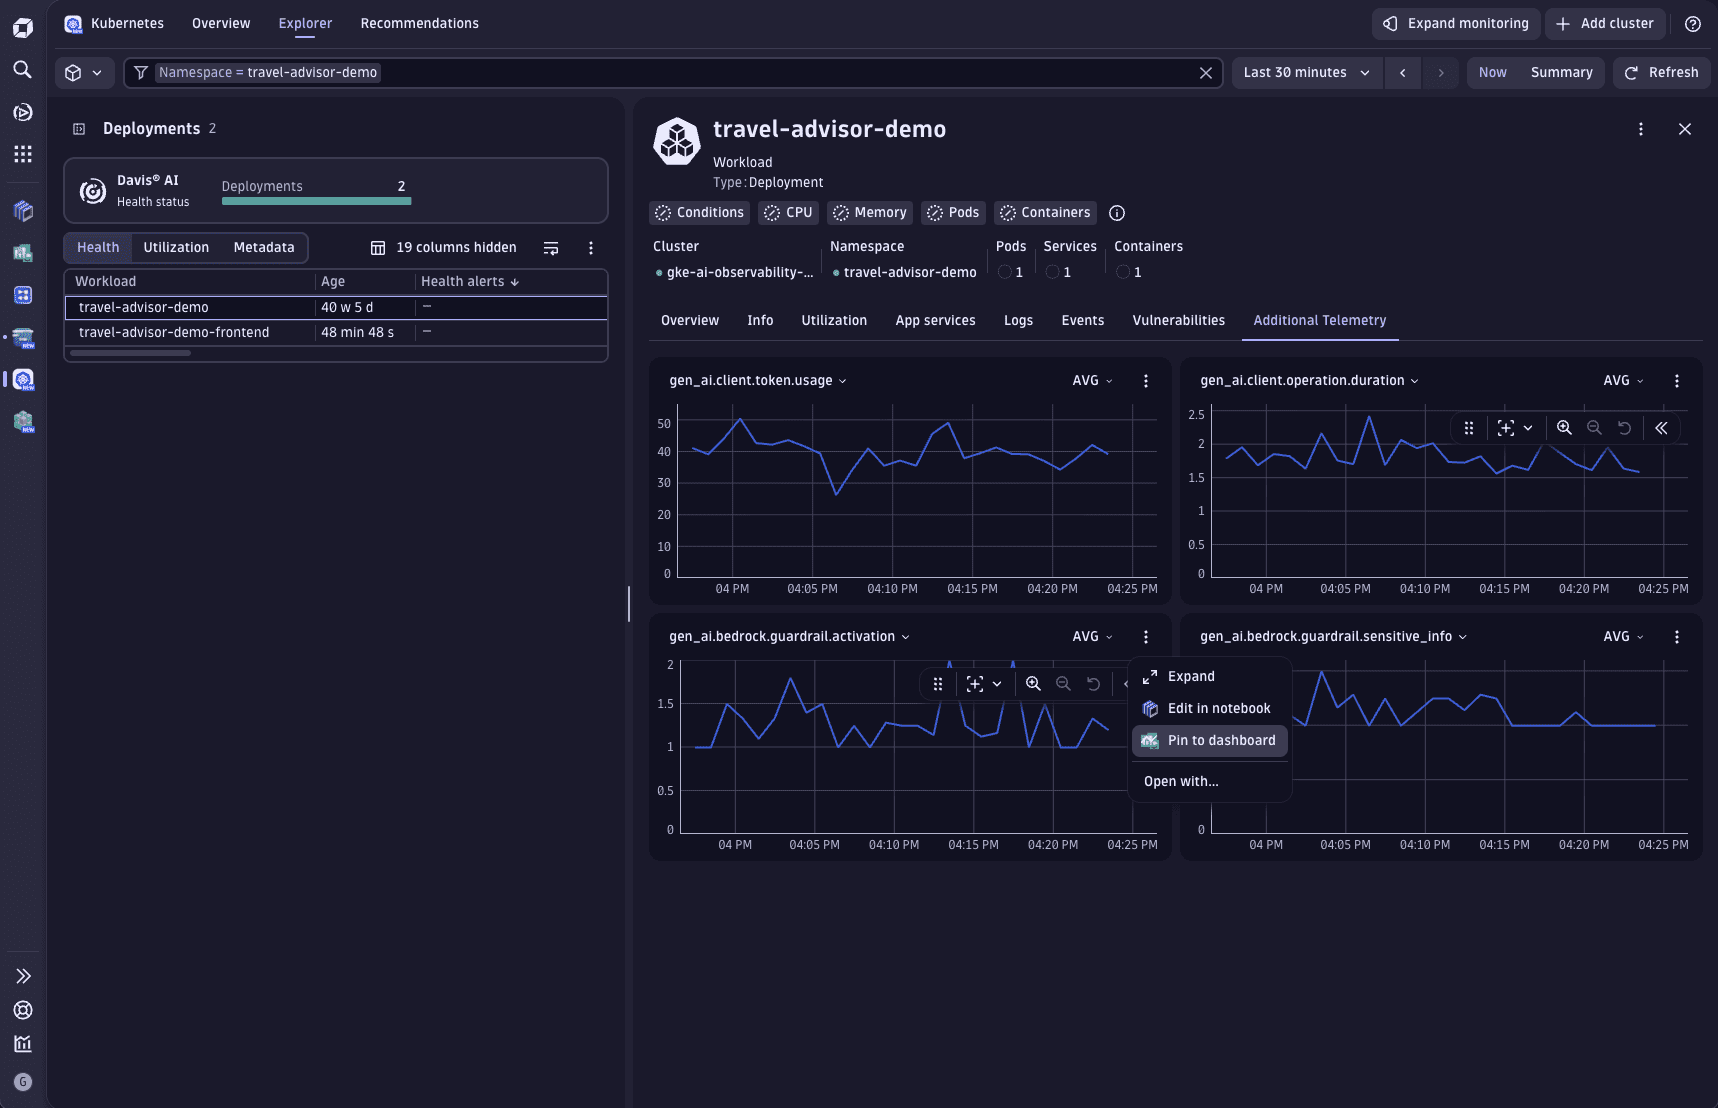 Additional Telemetry