Detect performance issues
- Latest Dynatrace
- Tutorial
- 5-min read
- Published Oct 28, 2024
Understanding which requests are slow and why that happens can be challenging in modern, cloud-based, distributed systems. The Distributed Tracing 
Test the app in a sandbox environment:
Target audience
This article is intended for SREs, developers, and performance architects who want to investigate performance issues by analyzing distributed traces within the Distributed Tracing app.
What you will learn
In this tutorial, you’ll learn how to use the Distributed Tracing app specifically to analyze and troubleshoot slow requests in a production Kubernetes namespace. You will learn to:
- Filter traces based on relevance
Use facets to narrow down the scope of traces, focusing on those that align with your responsibilities or areas of interest. - Zoom in on specific timeframes
Pinpoint relevant time periods with the time series chart or timeframce selector to view performance over a selected duration. - Identify performance outliers
Use histogram views to locate traces with extended response times. - Analyze affected services and requests
Use the grouping feature to understand which services and requests are affected. - Drill down into individual traces
Explore detailed trace data for specific requests to uncover root causes and pinpoint what occurred during slow response events.
Prerequisites
- You're familiar with the concepts of distributed tracing.
- You have Dynatrace Platform Subscription (DPS).
- You're ingesting trace data via Dynatrace OneAgent or OpenTelemetry. To get started ingesting trace data, go to the Distributed Tracing > Traces > choose a source and follow the in-product guidance.
- Make sure that your traces are available in the Distributed Tracing
app.
Analyze and troubleshoot performance issues
-
Go to Distributed Tracing
.
-
In the upper-right corner, select the timeframe Last 30 minutes to see how the number of requests and their response time have evolved during that timeframe.
-
Use facets to filter traces by a specific namaspace. To analyze traces that traverse your Kubernetes prod namespace,
-
In the facets list, go to Kubernetes > Kubernetes namespace.
The namespaces that are detected more frequently in your traces are listed first.
-
Select prod.
The filter field query automatically changes. You can edit the filter query further before updating the results.
-
Select Update to update the results.
-
-
Observe the charts to quickly spot performance outliers.
-
Go to the Timeseries chart to get an overview of the trends.

The Kubernetes prod namespace shows several spikes for request count and a cluster of failed requests.
-
To analyze data further, select Histrogram.

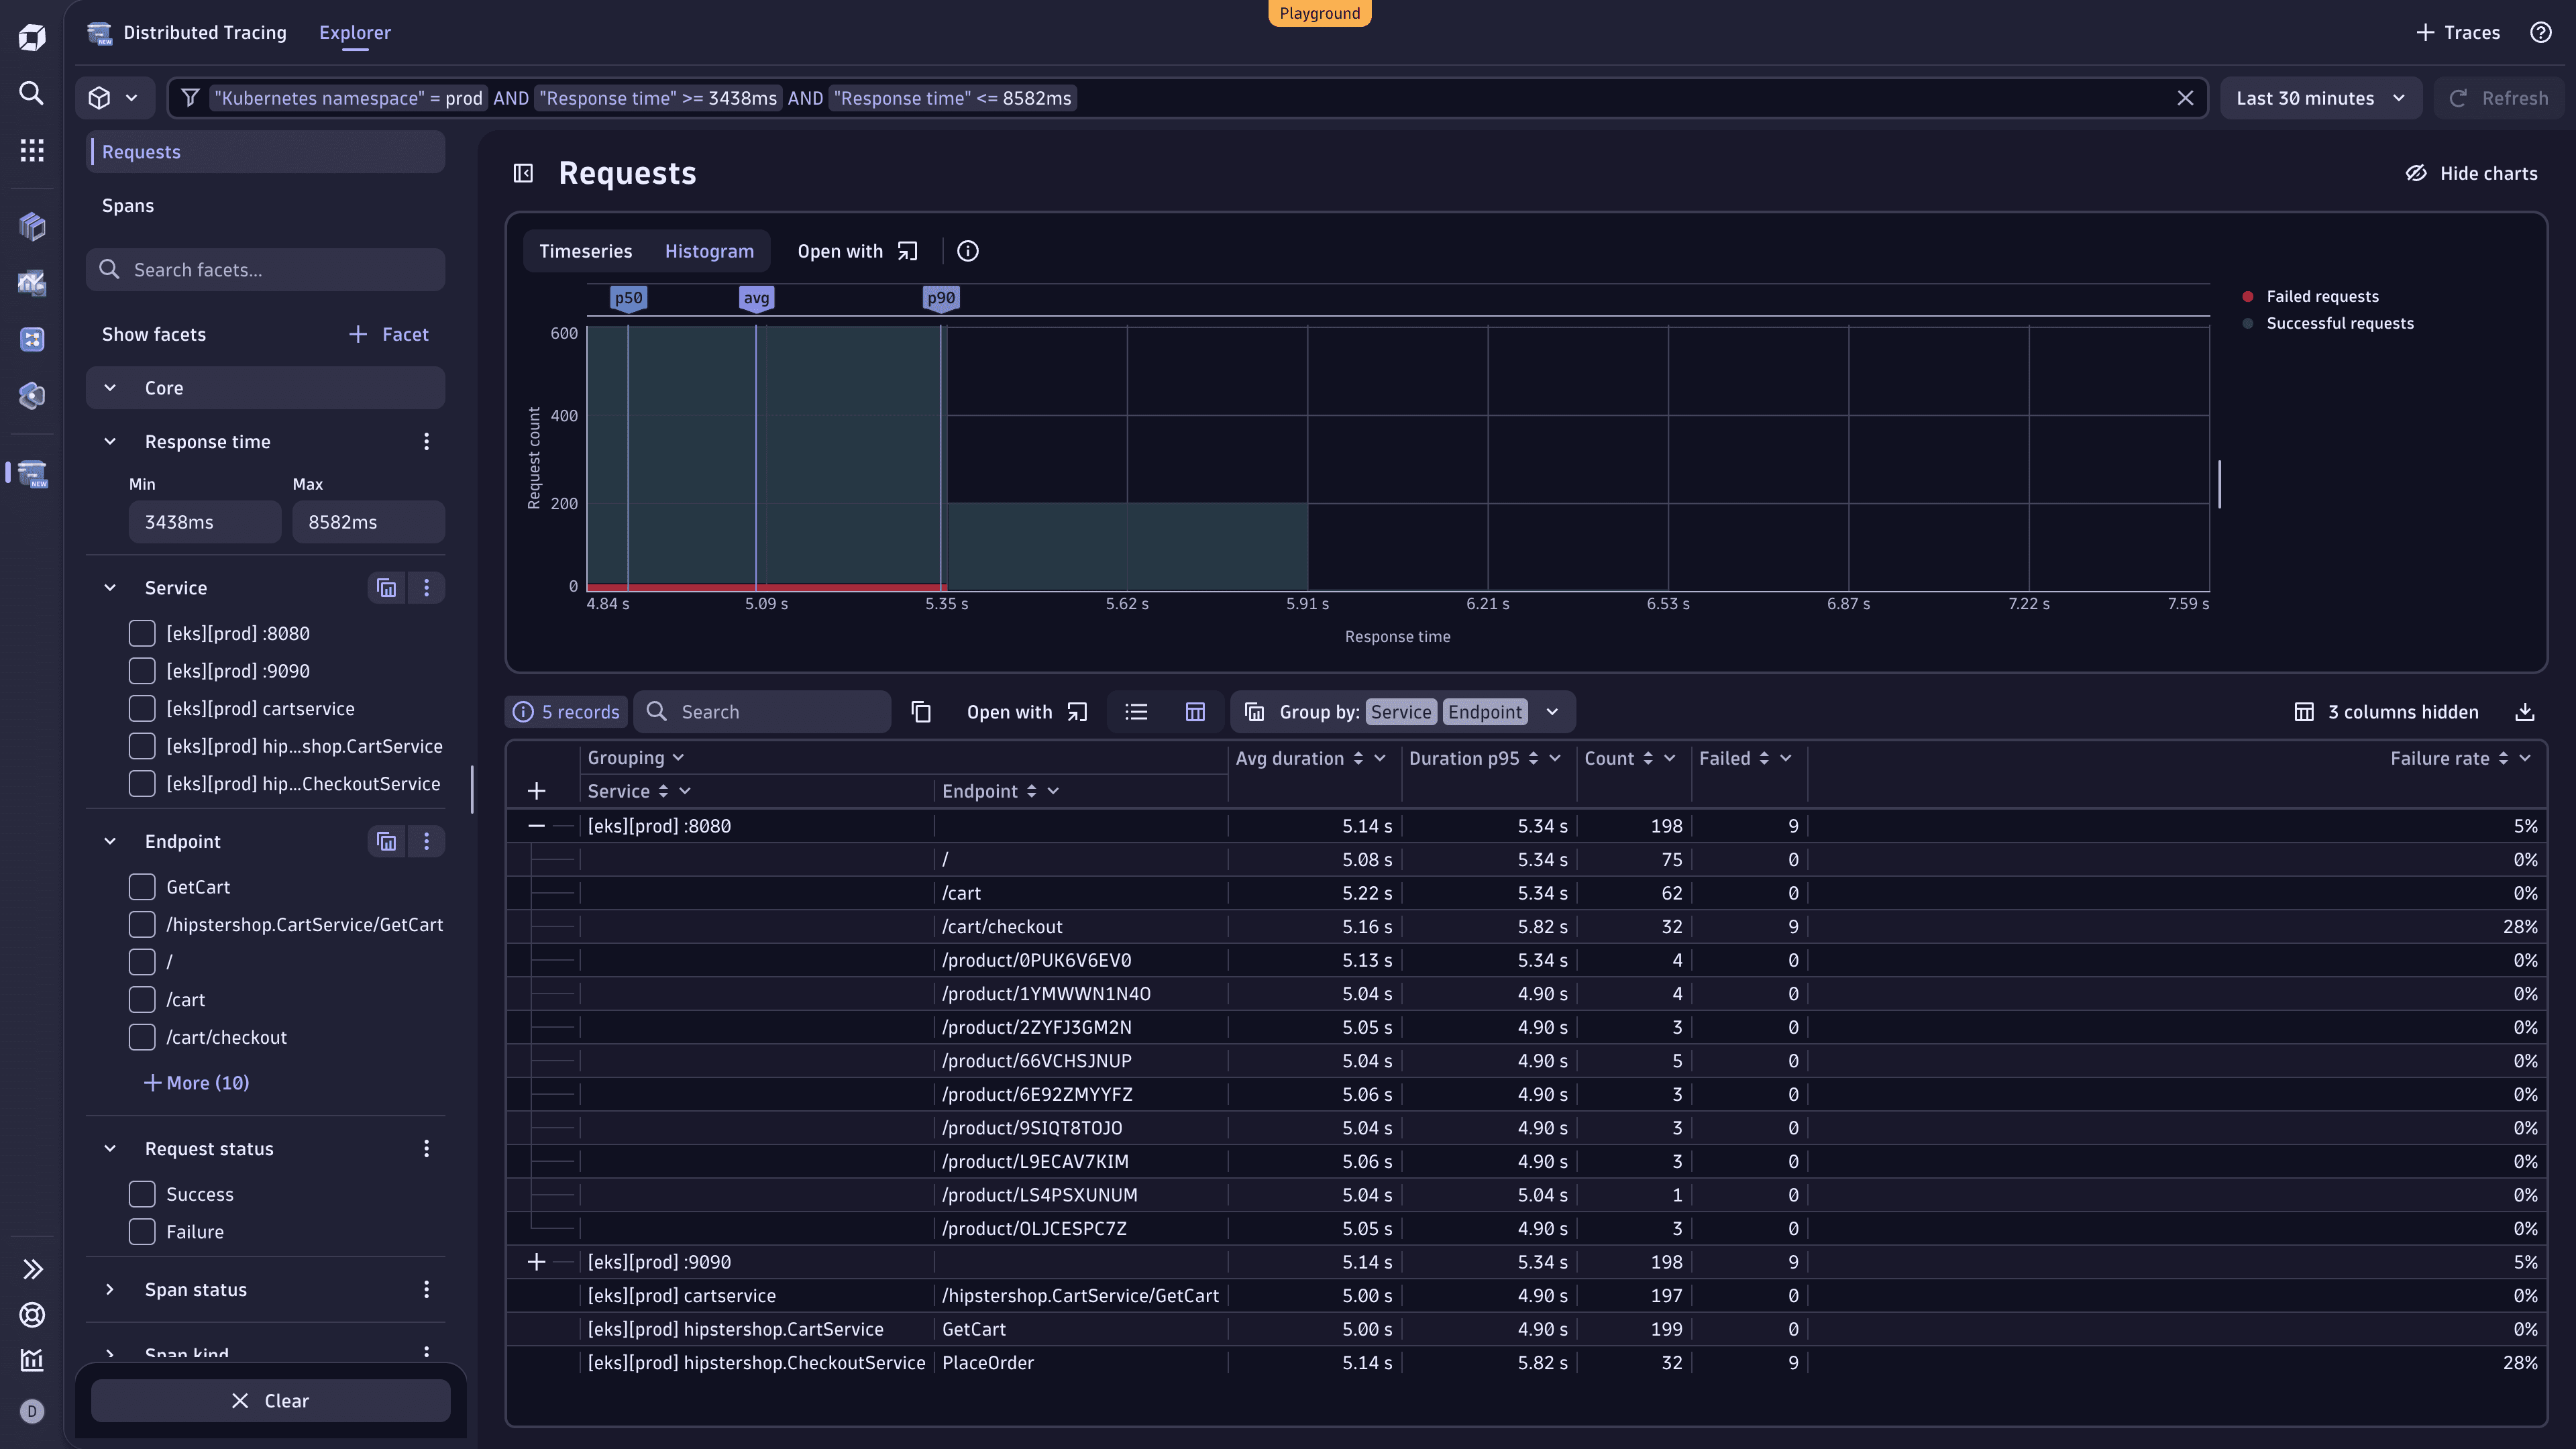
The histogram summarizes the amount of requests to a specific response time bucket. There's a cluster of requests to the prod environment that take around 5s.
-
Select the chart area containing the affected cluster to focus on the requests that fall into that response time bucket.
The filter bar is updated to show traces for the selected response time area, and the list shows traces with similar services and endpoints.
-
-
Group the requests by service and endpoint to undestand which services and endpoints are affected.
-
Go to the table and select Group by:.
-
Select the attributes Service and Endpoint.
In the table view (:TableIcon:) you can see an aggregated list of the services and endpoints that fall into the selected response time for the prod namespace. The columns summarize average and highest duration, the request count, and how many of these requests failed, including the failure rate.
-
To learn more about the top contributors to an aggregate in the table, select .
Focusing on the /cart/checkout request, you'll see that it not only has a slow response time (5.82 s) but also a high failure rate (28%), indicating it may be a key bottleneck.

-
To focus on a request, select the request name (/cart/checkout) in the table and filter by the endpoint.
The filter field query and the table results are automatically updated.
-
-
To identify the bottleneck for a request matching the selected filters, go to the list view and select the timestamp for one of the requests.
The single trace perspective opens at the bottom half of the page. Now, you can analyze the full end-to-end trace. In our case, we see that the bottleneck is the GetCart endpoint on the Cart services, which leads to a slow response time.
Conclusion
In this tutorial, you've learned how to effectively use the Distributed Tracing 
We analyzed trace data and identified a cluster of slow and failing requests within the production Kubernetes namespace. By filtering, grouping, and examining trace data, we were able to pinpoint a bottleneck in the GetCart endpoint of the Cart service.
 Distributed Tracing