Distributed traces concepts
- Dynatrace Classic
- Explanation
- 1-min read
- Published Mar 30, 2021
In this article, you will learn about the most important concepts and terminology for distributed tracing in Dynatrace.
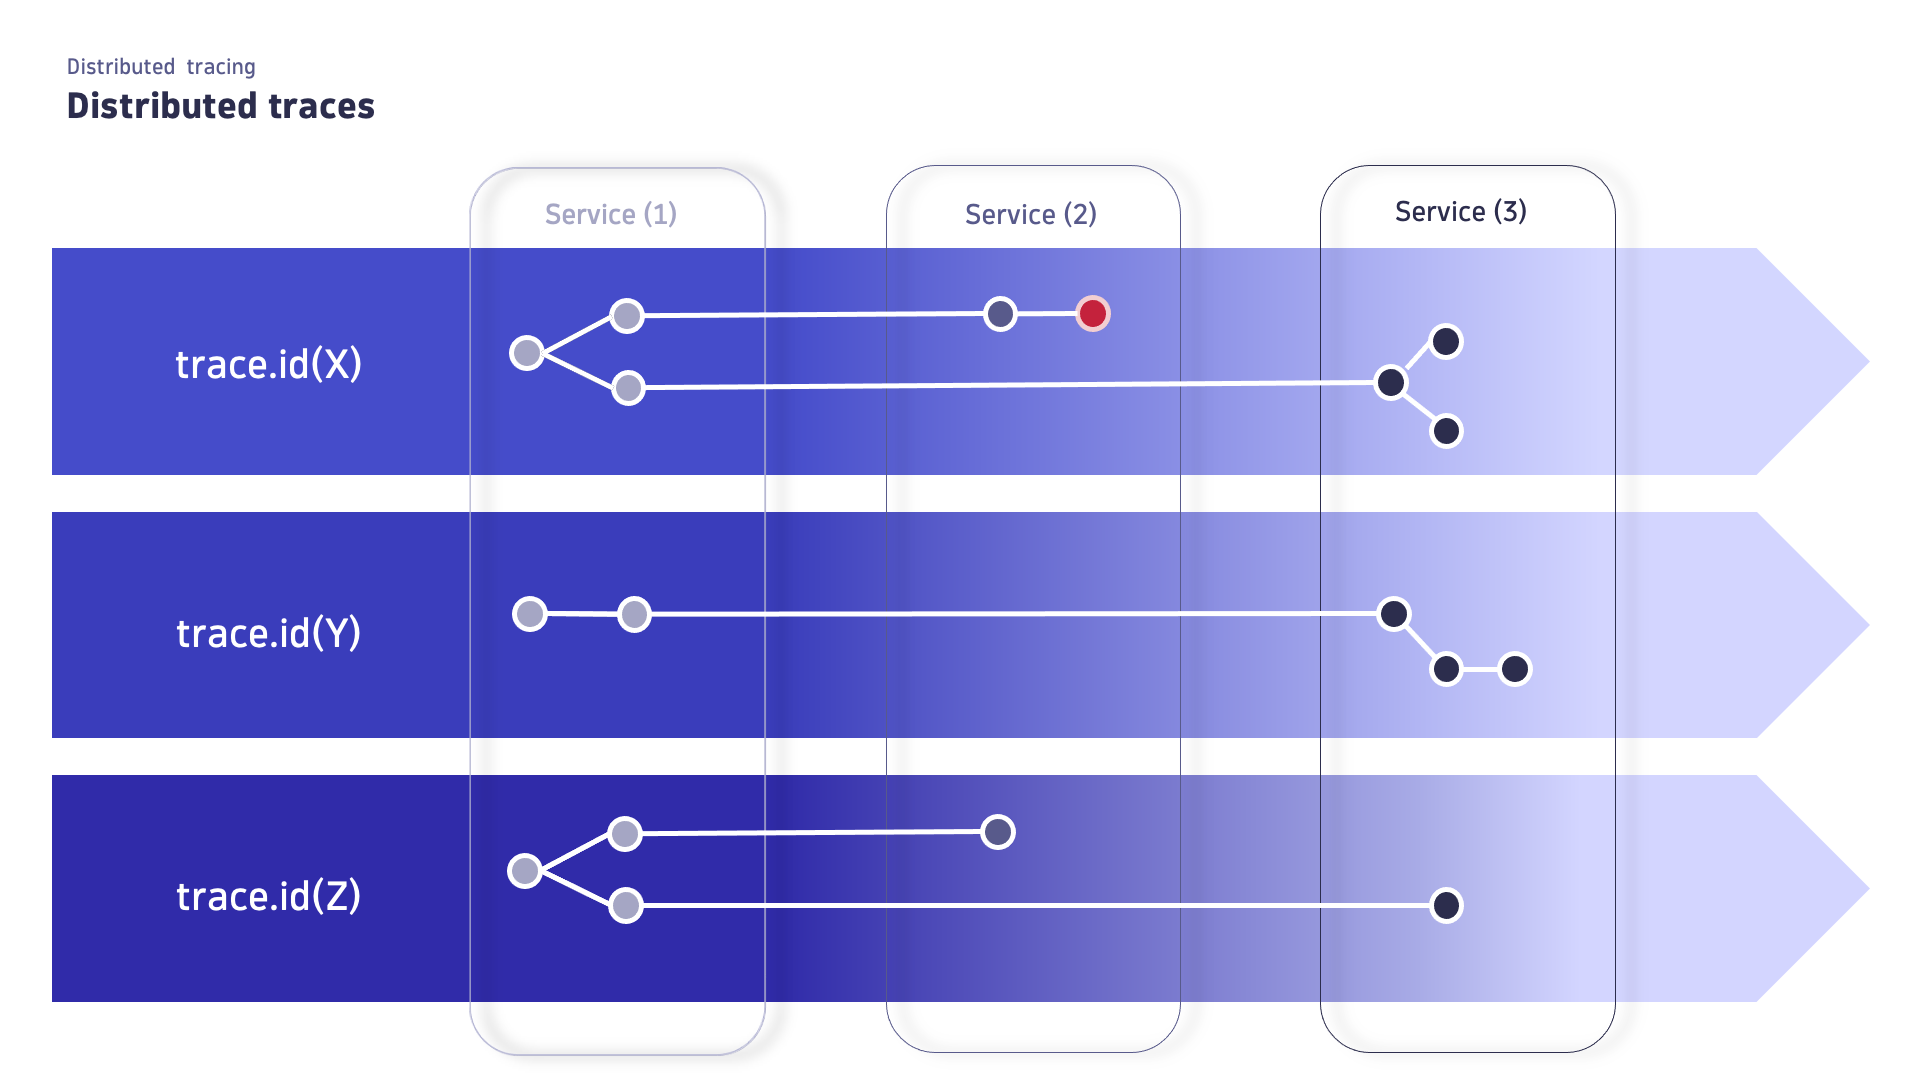
Distributed trace
A distributed trace is a sequence of spans, identified by a unique trace ID, that follows the path of a single request as it traverses through various services and components in a distributed system. In a modern microservice environment, it typically spans multiple services, providing a detailed view of the request's journey and performance. The trace contains semantically different attributes that make it possible to interpret and understand the collected data, helping identify bottlenecks, errors, and latency issues for efficient troubleshooting and optimization.
Use cases
- Understand how requests propagate across distributed systems and microservices.
- Use high-quality data generated by distributed systems and microservices for request analysis.
- Quickly understand how each microservice is performing.
- Follow Dynatrace Intelligence root cause analysis drill-downs to identify cause-effect relationships between events.
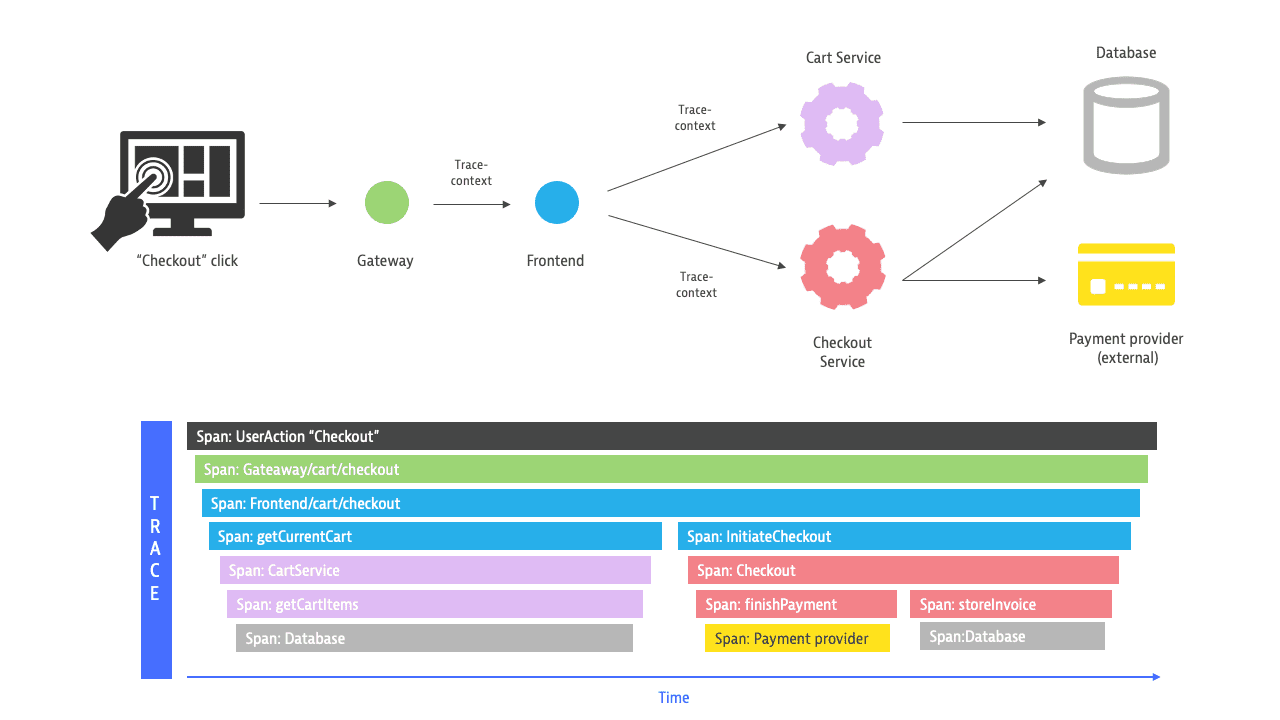
Span
A span represents a single operation within a distributed trace, capturing the details of the request's journey through multiple services. Each span includes attributes such as the name, the start timestamp, a list of span events (such as exceptions), the parent's span identifier, and the span kind. This information—span context— helps to put all spans and events in context with each other, so that you can trace and understand the performance and behavior of individual operations within the distributed system.
Within a trace, when the activity—parent span—is completed, the next activity passes to its child span. A span without a parent span is called a trace root span and indicates the start of a trace.
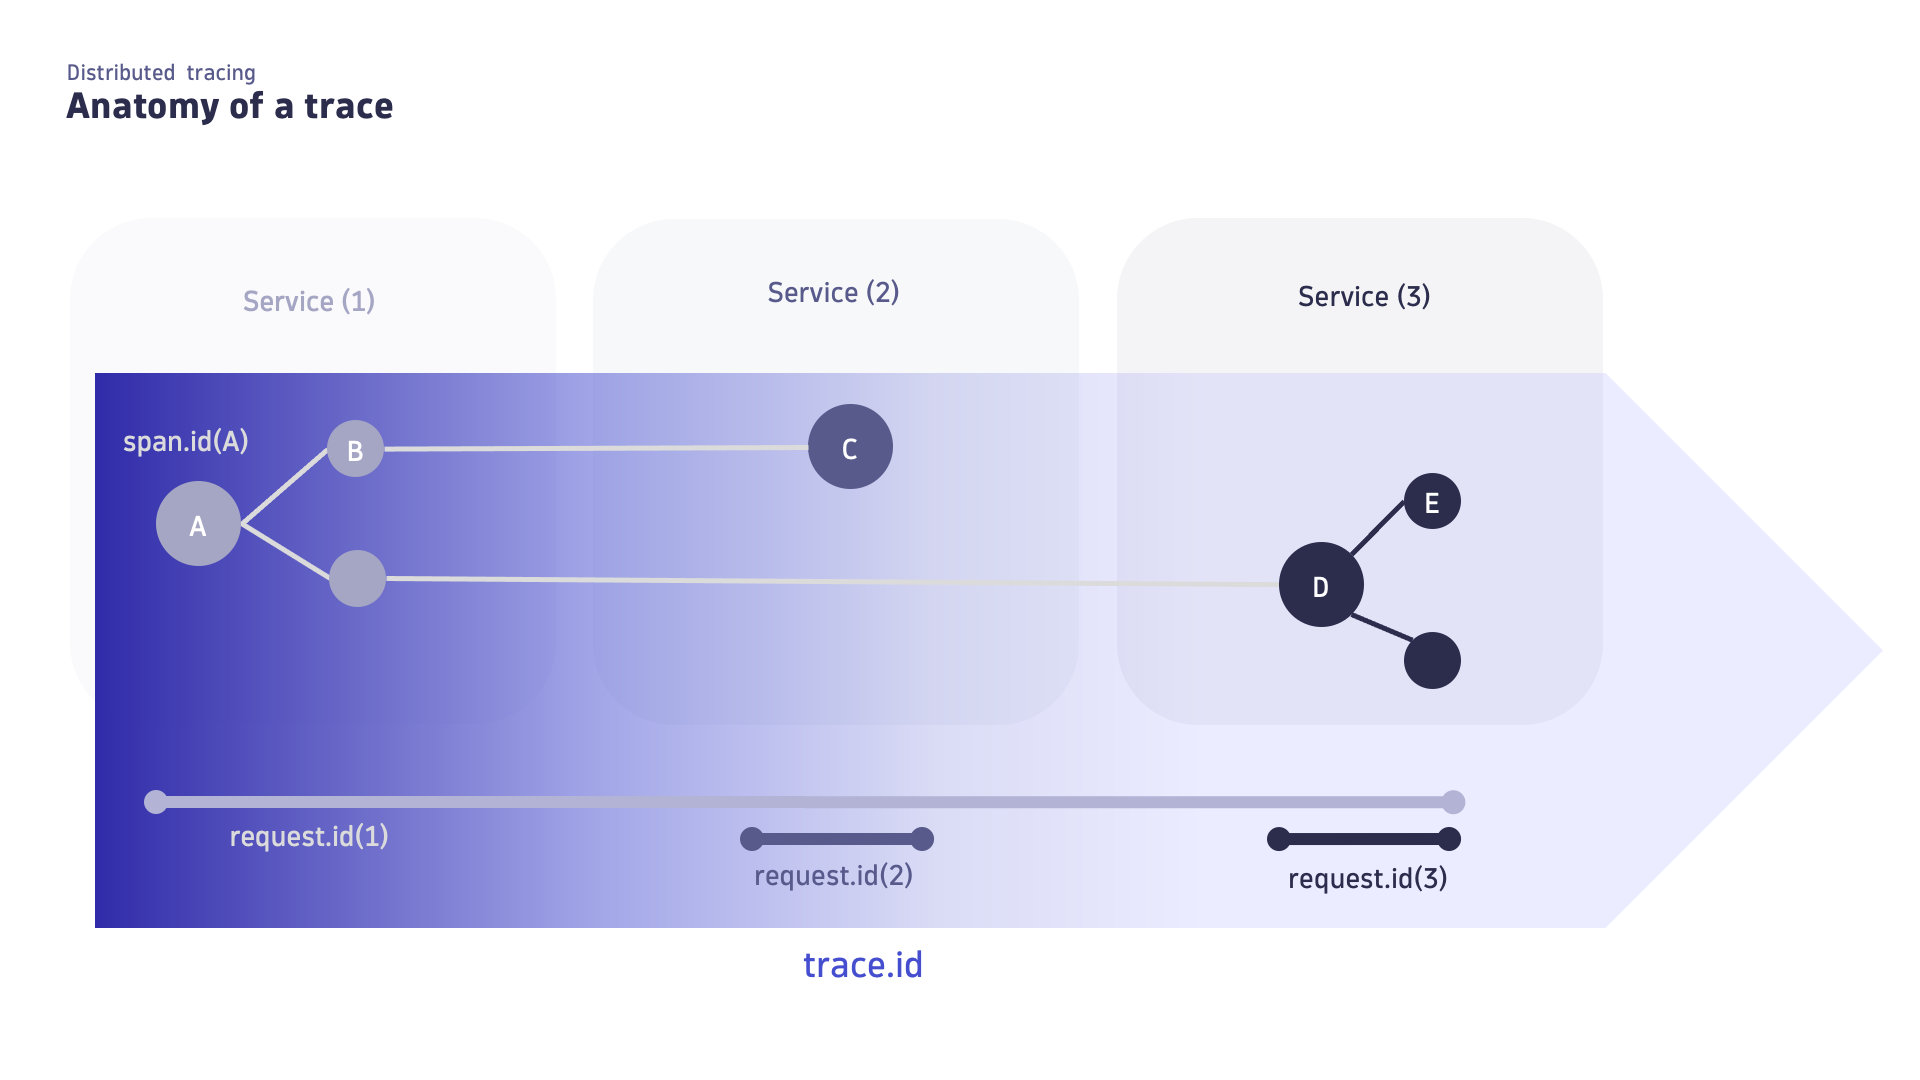
The image below shows a trace traversing three services and producing a request for each service. Each request has a root span, one of which is also the root of the trace.
- A is both the first span of the trace and the first span of the request within the first service; additionally, A is a span without a parent. A is both the root of the trace and of the request.
- C is the first span of the request within the second service; additionally, C has a parent (B). C is the root of the second request.
- E is not the first span of the request within the third service. E's parent (D) is the root of the third request.
Learn more about span semantic fields.
The span context allows a child span to relate to the trace and its parent span. Therefore, the context needs to be propagated within a service (across different threads) but also across services and process boundaries. This typically happens via HTTP headers (like the W3C trace context) or via unique IDs in messaging systems. To learn more about context propagation, see Span and trace context propagation in Distributed Traces Classic.
Attribute
Attributes are key-value pairs that provide details about a span, request, or resource such as response codes, HTTP methods, and URLs. Via attributes, you can group, query, find, and analyze your traces and spans.
Use cases
Dynatrace uses attribute metadata to
- Detect and name services.
- Gather data on the trace context and relationships with other entities for Smartscape topology.
- Connect log data to traces for Logs or Logs Classic.
- Understand how the duration of a span is affected by service timings (for example, CPU time, network time, or just waiting for other threads) and analyze which code was executed in the context of the span.
Best practices
If you collect trace data via
- OpenTelemetry, define captured attribute settings.
- OneAgent, define requests attribute settings.
Learn more about request attributes and captured attributes semantic fields.
Service
Services are traversed by distributed traces. On horizontally scaled services, specific Service Instances process each span. Services are determined and named based on available attributes or properties that are collected along with the spans.
Use cases
Data collection and context propagation
You can integrate OpenTelemetry and OneAgent to collect trace data—like request status, response time, versions, infrastructure information, and other relevant metadata as attributes. The trace context, including the unique trace ID, is then propagated across your apps and microservices.
Best practices
Before getting started with distributed tracing, understand how setup and trace data collection differs between OpenTelemetry and OneAgent. The following is an overview of the key differences.
| OpenTelemetry | OneAgent | |
|---|---|---|
Set up | Automatic or manual | Automatic |
Capturing | Automatic collection of allowed span attributes. | Automatic collection of several request attributes, including HTTP method, URL, response codes, topology data, and details about the underlying technologies. |
Context | Automatically or manually contextualized log entries, depending on the instrumentation library. | Automatically contextualized
|
To get started see
Use OpenTelemetry in combination with OneAgent to enhance your observability coverage, using the best of both.
PurePath® technology
Dynatrace patented PurePath® technology for distributed tracing, since 2006. PurePath® technology combines distributed tracing information with additional insights like user experience information, logs, metrics, topology information, metadata, and even code-level profiling information to provide the highest level of data fidelity and granularity.
Use cases
Analyze data down to code-level detail without ever losing the full context around your environment during drill down, with the highest level of data granularity and fidelity of monitored transactions.
 Distributed Traces Classic