Advanced Tracing Analytics powered by Grail
- Latest Dynatrace
- Tutorial
- 2-min read
- Preview
Advanced Tracing Analytics powered by Grail is designed for experienced users who require advanced tracing analysis that can be consumed via Dashboards, Notebooks, Workflows, and via the Dynatrace API.
Before you begin
Prerequisites
- Make sure your user has permissions necessary to access trace data.
- Traces powered by Grail overview (DPS).
Prior knowledge
Access spans and span attributes via DQL
A span represents a logical unit of work within the trace and is described by span attributes. Span attributes are set by the instrumentation that creates the span and provides detailed information on the span, including the kind of operation it represents and context on its origin. The semantics of all the fields are documented in Dynatrace Semantic Dictionary. With DQL you can
- Access every single span via the command
fetch spans. Combine it with DQL functions to query any span attribute stored in Grail without additional configuration. - Fully search any span attribute of type
string, via string function available in DQL, such asstartsWith,endsWith,contains, ormatchesPhrase.
Example: DQL access to all spans
The following example query fetches spans with an HTTP request header and, for each span, shows the values of the endpoint name, the HTTP request header and method and the trace ID.
fetch spans| filter isNotNull( http.request.header.host)| fields endpoint.name, http.request.header.host, http.request.method, trace.id| limit 5
Query result:
| endpoint.name | http.request.header.host | http.request.method | trace.id |
|---|---|---|---|
|
|
|
|
Example: DQL access to all attributes
The following query fetches spans generated with an HTTP route from the server. To make sure all spans use the same field name for the HTTP request method field, it looks for two semantically different fields and stores the first result into a new field for consultation purposes. It then summarizes the results by HTTP request method and HTTP route, providing the number of spans, their average duration, and the value of their duration in the 50th percentiles.
fetch spans| filter span.kind == "server" and isNotNull(http.route)| fieldsAdd http.request.method = coalesce(http.request.method, http.method)| summarize { count(), avg(duration), p50=percentile(duration, 50)}, by: { http.request.method, http.route }| limit 3
Query result:
| http.request.method | http.route | count() | avg(duration) | p50 |
|---|---|---|---|---|
|
|
|
|
|
Example: Full text search
The following example fetches spans with an HTTP route that contain user and don't end with username and summarizes the results, providing the number of spans by HTTP request method and HTTP route.
fetch spans| filterOut isNull(http.route)| filter contains(http.route, "v1/") and not endsWith(http.route, "/sell")| summarize count(), by: { http.request.method, http.route }
Query result:
| http.request.method | http.route | count() |
|---|---|---|
|
|
|
For more examples, see the Introduction notebook in Dynatrace Playground.
HTTP requests and networking
You can analyze your Web Requests via DQL and
- Get information on the duration of span data via the
summarizefunction. - Extract a timeseries from span raw data via the
makeTimeseriescommand and filter results by any span attribute. - Analyze requests.
- Aggregate results by request ID (OneAgent required).
Example: Summarize duration
In the following example, the query fetches spans that contain the HTTP route with a specific string value (services) and summarizes the results by duration. The duration is expressed in buckets of 100ms increments, ordered from lowest to highest value. Each bucket aggregates the response times of a number of spans, which are represented by a random trace picked among the aggregated values.
fetch spans// filter for specific HTTP route| filter contains(http.route, "services")| summarize {spans=count(),trace=takeAny(record(start_time, trace.id)) // pick random trace from aggregation bucket}, by: { bin(duration, 100ms) }| fields `bin(duration, 100ms)`, spans, trace.id=trace[trace.id], start_time=trace[start_time]
Query result:
| bin(duration, 100ms) | spans | trace.id | start_time |
|---|---|---|---|
|
|
|
|
Example: Extract timeseries
Via the makeTimeseries command, you can extract a timeseries from raw span data and use span attributes to filter, aggregate, or group the results. This on-the-fly approach supersedes the limitation of materialized timeseries (metrics) that require sets of dimensions defined up-front.
The following query fetches spans that contain a specific HTTP route and extracts a timeseries based on the results.
fetch spans// filter for specific http route| filter contains(http.route, "services") and http.request.method == "GET"// extract timeseries| makeTimeseries { avg=avg(duration) }, by: { http.route }, bins:250
Example: Request analysis
A request is an incoming call identified in Dynatrace by the key-value pair request.is_root_span: true. You can analyze requests using the fields function to extract specific information or track issues such as failed requests by using request.is_failed: true. For example, you can query failed requests and display relevant details, including the associated endpoint, to pinpoint where issues occur.
Requests typically also contain the endpoint, a name that represents a specific path or resource within a service where requests are directed. It represents the entry point for interactions, such as an API route—for example, /api/orders—or a method.
The following query fetches failed requests and displays the values of the specified fields.
fetch spans// filter only for request root spans| filter request.is_root_span == true| filter request.is_failed == true| fields trace.id, span.id, start_time, response_time = duration, endpoint.name| limit 100
Example: Request aggregation via request ID (OneAgent required)
In the following example, the goal is to gather information on the child spans of the requests. The request.id is leveraged to aggregate the results since all spans that belong to a single request carry its ID.
fetch spans// request.id is pre-requisite for this query. not always present| filter isNotNull(request.id)| summarize {spans = count(),client_spans = countIf(span.kind == "client"),span_events = sum(arraySize(span.events)),// from all spans in the summarized group, select the one that is the request rootrequest_root = takeMin(record(root_detection_helper = coalesce(if(request.is_root_span, 1), 2 /* INVALID */),start_time, endpoint.name, duration))}, by: { trace.id, request.id }// reset request_root to NULL if root_detection_helper is invalid| fieldsAdd request_root=if(request_root[root_detection_helper] < 2, request_root)| fieldsFlatten request_root | fieldsRemove request_root.root_detection_helper, request_root| fieldsstart_time = request_root.start_time,endpoint = request_root.endpoint.name,response_time = request_root.duration,spans,client_spans, span_events,trace.id| limit 100
Example: Trace aggregations
A full trace consists of many spans. You usually want to identify a trace by the first request it started with; the "root request".
The following query finds the root request span and additionally does aggregations over the whole trace, based on an aggregation on the trace.id.
fetch spans| summarize {spans = count(),client_spans = countIf(span.kind == "client"),span_events = sum(arraySize(span.events)),// endpoints involved in the traceendpoints = toString(arrayRemoveNulls(collectDistinct(endpoint.name))),// hosts involved in the tracehosts = arrayRemoveNulls(collectDistinct(host.name)),// from all spans in the summarized group, select the one that is the first request root in the tracetrace_root = takeMin(record(root_detection_helper = coalesce(if(request.is_root_span, 1), if(isNull(span.parent_id), 2), 3),start_time, endpoint.name, duration))}, by: { trace.id }| fieldsFlatten trace_root | fieldsRemove trace_root.root_detection_helper, trace_root| fieldsstart_time = trace_root.start_time,endpoint = trace_root.endpoint.name,response_time = trace_root.duration,spans,client_spans, span_events,endpoints, hosts,trace.id| sort start_time| limit 100
Example: Request attributes
Request attributes are represented as span attributes on the "request root span" (request.is_root: true) with the following key: request_attribute.name of the <request attribute>.
If the request attribute name contains special characters, you need to use backticks.
fetch spans// no backticks required| filter isNotNull(request_attribute.my_customer_id)// backticks required| filter isNotNull(`request_attribute.My Customer ID`)
The data type of request_attribute.* depends on the request attribute configuration. If the configuration is set to "All values", the data type is array.
If a request attribute is configured to be captured from method parameters, there are additional attributes on the span on which the attribute has been captured with the following captured_attribute.<name of the request attribute> key. The data type of captured_attribute.* is always an array because at capture time, it's unknown whether there is one or multiple values.
For more examples, see the HTTP Requests and Networking notebook in Dynatrace Playground.
Databases
You can analyze your Databases with Traces DQL.
Example: Top 10 most frequent database queries
This query identifies the top 10 most frequently executed database queries from client spans, across your telemetry data, and groups them by database system, operation name, and query text.
fetch spans| filter isNotNull(db.namespace) AND span.kind == "client"| summarize by:{db.system, db.operation.name, db.query.text}, count = count()| sort count desc| limit 10
Example: Top database statements per service
This query identifies the top 10 database statements executed by each service, along with the total number of calls made to each statement. It takes into account sampling and aggregation to provide an accurate count of database calls.
fetch spans// filter for database spans| filter span.kind == "client" and isNotNull(db.namespace)// add service name| fieldsAdd entityName = dt.entity.service// calculate multiplicity factor for every span, to for extrapolations| fieldsAdd sampling.probability = (power(2, 56) - coalesce(sampling.threshold, 0)) * power(2, -56)| fieldsAdd sampling.multiplicity = 1/sampling.probability| fieldsAdd multiplicity = coalesce(sampling.multiplicity, 1)* coalesce(aggregation.count, 1)* dt.system.sampling_ratio| summarize { db_calls = sum(multiplicity) }, by: { dt.entity.service.name, code.function, db.system, db.namespace, db.query.text }// top 100| sort db_calls desc| limit 10
Example: Database calls per endpoint as timeseries
This query identifies the top 10 database calls made to each endpoint over time. It takes into account sampling and aggregation to provide an accurate count of database calls.
fetch spans// calculate multiplicity factor for every span, to for extrapolations| fieldsAdd sampling.probability = (power(2, 56) - coalesce(sampling.threshold, 0)) * power(2, -56)| fieldsAdd sampling.multiplicity = 1/sampling.probability| fieldsAdd multiplicity = coalesce(sampling.multiplicity, 1)* coalesce(aggregation.count, 1)* dt.system.sampling_ratio| summarize {spans = count(),db_spans = countIf(span.kind == "client" and isNotNull(db.namespace)),db_calls = sum(if(span.kind == "client" and isNotNull(db.namespace), multiplicity, else: 0) ),// from all spans in the summarized group, select the one that is the request rootrequest_root = takeMin(record(root_detection_helper = coalesce(if(isNotNull(endpoint.name), 1), 2),start_time, endpoint.name, duration))}, by: { trace.id, request.id }| fieldsstart_time = request_root[start_time],endpoint = request_root[endpoint.name],respopnse_time = request_root[duration],spans,db_spans, db_calls,trace.id| makeTimeseries { avg(db_calls) }, by: { endpoint }// only show top 10 timeseries| sort arraySum(`avg(db_calls)`) desc| limit 10
Example: Database errors
This query identifies the top 10 database errors occurring in client spans, and groups them by database system and query text.
fetch spans// filter for database spans| filter span.kind == "client"| filter isNotNull(span.events)| filter db.namespace != ""| filter isNotNull(db.query.text)| filter eventname == "exception"// adds service name| fieldsAdd entityName(dt.entity.service)// adds the error message| fieldsAdd exception = span.events[0][exception.message]// adds span name| fieldsAdd eventname = span.events[0][span_event.name]| summarize {ExceptionMessage = collectDistinct(exception),Errors = count()},by:{Database = db.namespace, Query = db.query.text}// only show top 10 errors| sort Errors desc| limit 10
Query result:
| Database | Query | ExceptionMessage | Errors |
|---|---|---|---|
TradeManagement |
| One or more errors occurred. (Cannot insert explicit value for identity column in table 'Trades' when IDENTITY_INSERT is set to OFF.) | 201 |
For more examples, see the Databases notebook in Dynatrace Playground.
Exceptions
Exceptions that happen in the context of a distributed trace are stored within individual spans as a list of span.events. You can query for those exceptions with the iAny DQL command. You can also expand and flatten the span events, so that the exception attributes appear as top-level attributes. With this, it's easy to create timeseries or any other aggregation from exceptions.
Every attribute's value is of type string, making it searchable, which also applies to exception messages and stack traces. On top of that, you can apply the parse DQL command to extract structured information.
Example: Find exceptions and excluding specific ones
This query extracts spans that contain error events, specifically focusing on exceptions that aren't related to HTTP.
fetch spans// only spans which contain a span event of type "exception"| filter iAny(span.events[][span_event.name] == "error")// exclude specific exception| filter iAny(contains(span.events[][span_event.name], "http"))// make exception attributes top level attributes| expand span.events| fields span.events| fieldsFlatten span.events| fieldsRemove span.events| limit 1000
Example: Full-text search
This query performs a full-text search on the stack trace of spans to find specific error messages.
fetch spans// full text search on stacktrace| filter iAny(contains(span.events[][exception.stack_trace], "hang up"))// make exception attributes top level attributes| expand span.events| fields span.events| fieldsFlatten span.events| limit 1000
Example: Exception count by type
This query counts the number of exceptions by their type.
fetch spans// only spans which contain a span event of type "exception"| filter iAny(span.events[][span_event.name] == "exception")// make exception type top level attribute| expand span.events| fieldsFlatten span.events, fields: { exception.type }| summarize count(), by: { exception.type }
Query result:
exception.type | count() |
|---|---|
| 1 |
| 236 |
| 57 |
PHP Deprecated | 1626 |
| 311 |
| 2 |
| 114 |
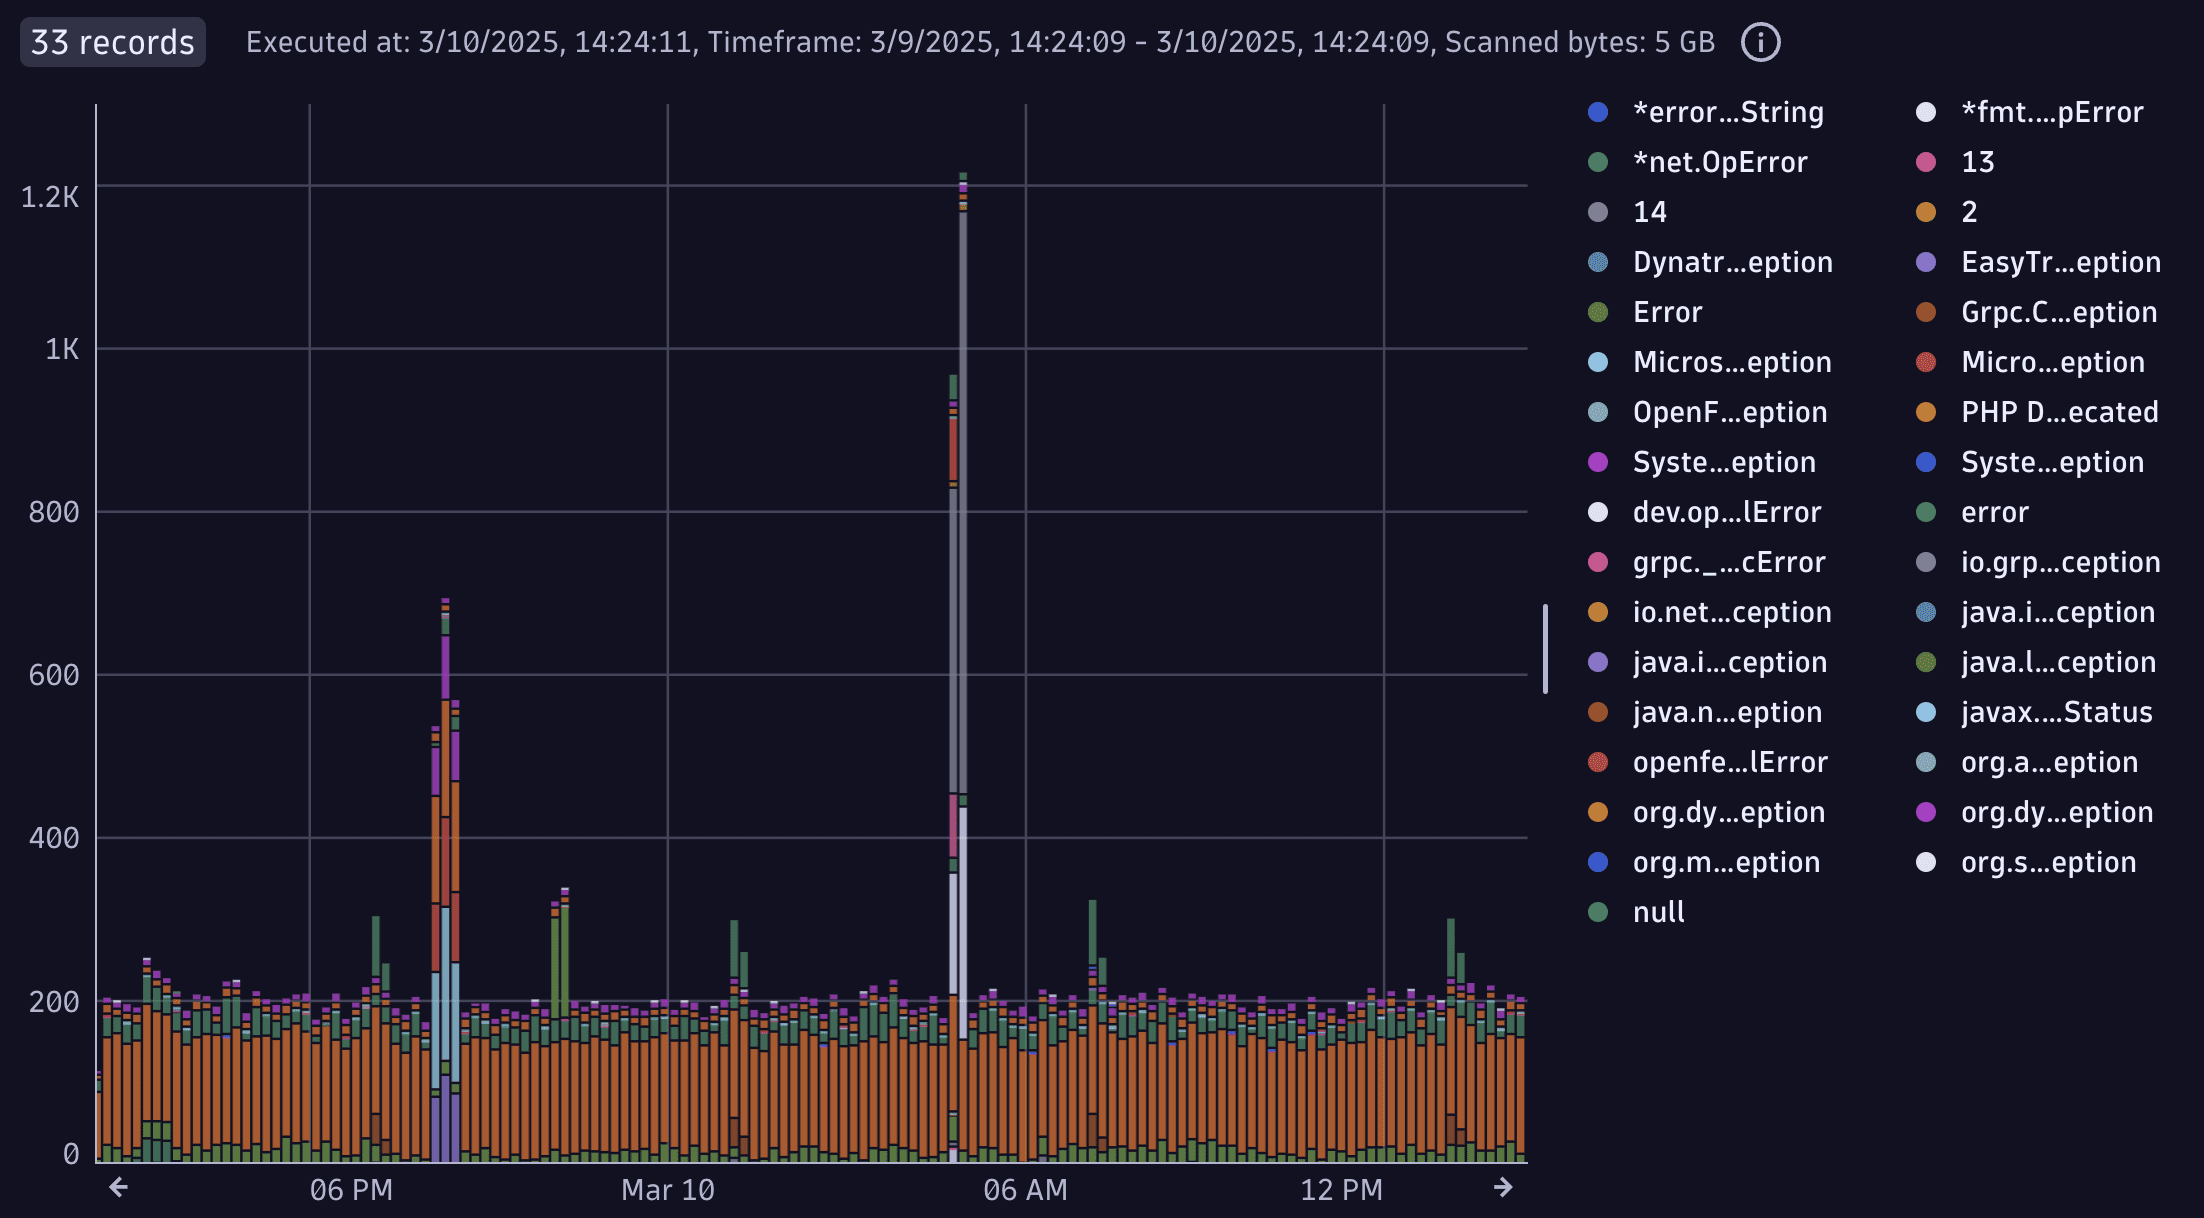
Example: Exception frequency as chart
This query creates a timeseries chart showing the frequency of exceptions by their type.
fetch spans// only spans which contain a span event of type "exception"| filter iAny(span.events[][span_event.name] == "exception")// make exception type top level attribute| expand span.events| fieldsFlatten span.events, fields: { exception.type }| makeTimeseries count(), by: { exception.type }
Query result:
Example: Use the parse command to extract information
This query extracts structured information from exception messages using the parse command.
fetch spans| filter iAny(contains(span.events[][exception.message], "Bio for user with id"))// make exception attributes top level attributes| expand span.events| fields span.events| fieldsFlatten span.events| fieldsRemove span.events// parse "user_id" number from the exception message// Example message: "Bio for user with id '9146' not found"| parse `span.events.exception.message`, "Bio for user with id \'INT:user_id\' not found"| summarize count(), by: { user_id }// show top 5| sort `count()` desc| limit 5
Query result:
user_id | count() |
|---|---|
3 | 3 |
302 | 3 |
389 | 3 |
428 | 3 |
507 | 3 |
For more examples, see the Exceptions notebook in Dynatrace Playground.
Logs
Logs can be enriched with trace_id and span_id. OneAgent can even enrich such context into logs automatically. With this information, you can join spans and logs to, for example, find traces and spans that emit specific logs.
Example: Logs with trace context
This query fetches logs that are enriched with trace context information.
fetch logs// only logs that have a trace context| filterOut isNull(trace_id)| limit 10
Example: Find spans containing a specific string
This query fetches spans that contain a specific string in their attributes.
fetch spans| filter trace.id in [fetch logs// only logs that have a trace context| filter isNotNull(trace_id)// search for a particular string in logs content| filter contains(content, "No carts for user")// convert from string to UID type| fields toUid(trace_id)]| limit 5
Example: From logs containing a specific string, show performance of spans in which the log was emitted
This query fetches spans that were active when a specific log message was emitted.
fetch spans| filter span.id in [fetch logs// only logs that have a trace context| filter isNotNull(span_id)| filter contains(content, "No carts for user")// convert from string to UID type| fields toUid(span_id)]// pick either the span name or code namespace and function, depending on what's available| fieldsAdd name = coalesce(span.name, concat(code.namespace, ".", code.function))| summarize { count(), avg(duration), p99=percentile(duration, 99), trace.id=takeAny(trace.id) } , by: { k8s.pod.name, name }
Example: Join spans and logs
This query joins spans with logs based on the trace ID.
fetch spans| fieldsAdd trace_id = toString(trace.id)| join [ fetch logs ], on:{ left[trace_id] == right[trace_id] }, fields: { content, loglevel }| fields start_time, trace.id, span.id, code=concat(code.namespace, ".", code.function), loglevel, content| limit 100
For more examples, see the Logs notebook in Dynatrace Playground.
Sampling, aggregation, and extrapolation
- Sampling
- Adaptive Traffic Management (ATM) is a rate-limiting, head-based sampling mechanism that adaptively reacts to the rate of requests. The decision is made on the agent, at the beginning of a trace (thus "head-based").
- Adaptive Load Reduction (ALR) is a server-side sampling mechanism that's aimed to protect the backend infrastructure from being overloaded.
- Read Sampling
- With read sampling, you can control how much data should be read in a query, via the parameter
samplingRatio. - With a value greater than 1, only a sampled fraction of the data is read.
- The following sampling rates are available:
1,10,100,1000,10000,100000. Whereas1means 100% data, and100means 1% of data. - The actually applied read-sampling ratio can be used via
dt.system.sampling_ratio. Even ifsamplingRatiois set tosamplingRatio: 17, Grail may decide to fall back to an actual sampling rate of 10. - Read sampling is aware of traces. This means that within a specific sampling rate, you'll find either all spans of a trace, or none (based on common
trace.id).
- Aggregation
Certain types of operations of the same type can be aggregated into a single span to optimize and reduce the number of spans. One example is database spans. If there are many database operations with the same statement on the same database, OneAgent may choose to aggregate them. Such aggregated spans can be identified by the presence of the
aggregation.countattribute.- Extrapolation
To take all of this into account, when counting operations, you need to extrapolate span counts to actual operation count by using the correct extrapolation-factor:
// calculate multiplicity factor for every span, to for extrapolations| fieldsAdd sampling.probability = (power(2, 56) - coalesce(sampling.threshold, 0)) * power(2, -56)| fieldsAdd sampling.multiplicity = 1/sampling.probability| fieldsAdd multiplicity = coalesce(sampling.multiplicity, 1)* coalesce(aggregation.count, 1)* dt.system.sampling_ratioTo use the extrapolation, for example, to count the number of requests, you need to use
sum():| summarize count = sum(multiplicity)
Example: Count requests with extrapolations
This query counts the number of requests with extrapolations applied.
fetch spans// read only 1% of data for better read performance, samplingRatio:100// only request roots| filter request.is_root_span == true// calculate multiplicity factor for every span, to for extrapolations| fieldsAdd sampling.probability = (power(2, 56) - coalesce(sampling.threshold, 0)) * power(2, -56)| fieldsAdd sampling.multiplicity = 1/sampling.probability| fieldsAdd multiplicity = coalesce(sampling.multiplicity, 1)* coalesce(aggregation.count, 1)* dt.system.sampling_ratio| summarize span_count=count(), request_count_extrapolated = sum(multiplicity)
Query result:
span_count | request_count_extrapolated |
|---|---|
479927 | 48460200 |
Example: Database call count and durations, extrapolated
This query counts the number of database calls with extrapolations applied.
fetch spans// read only 1% of data for better read performance, samplingRatio:100// only database spans| filter isNotNull(db.statement)// calculate multiplicity factor for every span, to for extrapolations| fieldsAdd sampling.probability = (power(2, 56) - coalesce(sampling.threshold, 0)) * power(2, -56)| fieldsAdd sampling.multiplicity = 1/sampling.probability| fieldsAdd multiplicity = coalesce(sampling.multiplicity, 1)* coalesce(aggregation.count, 1)* dt.system.sampling_ratio| fieldsAdd aggregation.duration_avg = coalesce(aggregation.duration_sum / aggregation.count, duration)| summarize {operation_count_extrapolated = sum(multiplicity),operation_duration_extrapolated = sum(aggregation.duration_avg * multiplicity) / sum(multiplicity)}
Query result:
operation_count_extrapolated | operation_duration_extrapolated |
|---|---|
11800 | 6.38ms |
For more examples, see the Sampling, aggregation, and extrapolation notebook in Dynatrace Playground.
Trace query usage
Explore the Trace query usage from the billing perspective. Discover usage per apps, users, and query type.
Example: Query traces usage for Apps
This query analyzes billing usage data specifically related to trace queries, aiming to break down data consumption and query volume by application and user.
fetch dt.system.events| filter event.kind == "BILLING_USAGE_EVENT"| filter event.type == "Traces - Query"| dedup event.id| summarize {data_read_GiB = sum(billed_bytes / 1024 / 1024 / 1024.0),Query_count = count()}, by: {App_context = client.application_context, application_detail = client.source, User = user.email}| fieldsAdd split_by_user = record(data_read_GiB, App_context, application_detail, User, Query_count)| summarize {split_by_user = arraySort(collectArray(split_by_user), direction: "descending"),data_read_GiB = sum(data_read_GiB),Query_count = sum(Query_count)}, by:{App_context, application_detail}| fieldsAdd split_by_user = record(App_context = split_by_user[][App_context], application_detail = split_by_user[][application_detail], User = split_by_user[][User], data_read_GiB = split_by_user[][data_read_GiB], data_read_pct = (split_by_user[][data_read_GiB] / data_read_GiB * 100), Query_count = split_by_user[][Query_count])| fieldsAdd split_by_user = if(arraySize(split_by_user) == 1, arrayFirst(split_by_user)[User], else: split_by_user)| fieldsAdd application_details = record(data_read_GiB, App_context, application_detail, split_by_user, Query_count)| summarize {application_details = arraySort(collectArray(application_details), direction: "descending"),data_read_GiB = sum(data_read_GiB),Query_count = toLong(sum(Query_count))}, by:{App_context}| fieldsAdd application_details = record(App_context = application_details[][App_context], application_detail = application_details[][application_detail], split_by_user = application_details[][split_by_user], data_read_GiB = application_details[][data_read_GiB], data_read_pct = application_details[][data_read_GiB] / data_read_GiB * 100, Query_count = application_details[][Query_count])| fieldsAdd key = 1| fieldsAdd total = lookup([fetch dt.system.events| filter event.kind == "BILLING_USAGE_EVENT" and event.type == "Traces - Query"| dedup event.id| summarize total = sum(billed_bytes / 1024 / 1024 / 1024.0)| fieldsAdd key = 1], sourceField: key, lookupField:key)[total]| fields App_context, application_details, data_read_GiB, data_read_pct = data_read_GiB / total * 100, Query_count| sort data_read_GiB desc
Example: Query traces usage by users
This query provides a detailed breakdown of trace query billing usage by user, focusing on how much data each user consumes and through which application contexts.
fetch dt.system.events| filter event.kind == "BILLING_USAGE_EVENT"| filter event.type == "Traces - Query"| dedup event.id| summarize {data_read_GiB = sum(billed_bytes / 1024 / 1024 / 1024.0),Query_count = count()}, by: {App_context = client.application_context, application_detail = client.source, User = user.email}| fieldsAdd split_by_application_detail = record(data_read_GiB, App_context, application_detail, User, Query_count)| summarize {split_by_application_detail = arraySort(collectArray(split_by_application_detail), direction: "descending"),data_read_GiB = sum(data_read_GiB),Query_count = sum(Query_count)}, by:{User, App_context}| fieldsAdd split_by_application_detail = record(User = split_by_application_detail[][User], App_context = split_by_application_detail[][App_context], application_detail = split_by_application_detail[][application_detail], data_read_GiB = split_by_application_detail[][data_read_GiB], data_read_pct = (split_by_application_detail[][data_read_GiB] / data_read_GiB * 100), Query_count = split_by_application_detail[][Query_count])| fieldsAdd split_by_application_detail = if(arraySize(split_by_application_detail) == 1, arrayFirst(split_by_application_detail)[application_detail], else: split_by_application_detail)| fieldsAdd App_contexts = record(data_read_GiB, User, App_context, split_by_application_detail, Query_count)| summarize {App_contexts = arraySort(collectArray(App_contexts), direction: "descending"),data_read_GiB = sum(data_read_GiB),Query_count = toLong(sum(Query_count))}, by:{User}| fieldsAdd App_contexts = record(User = App_contexts[][User], App_context = App_contexts[][App_context], split_by_application_detail = App_contexts[][split_by_application_detail], data_read_GiB = App_contexts[][data_read_GiB], data_read_pct = App_contexts[][data_read_GiB] / data_read_GiB * 100, Query_count = App_contexts[][Query_count])| fieldsAdd key = 1| fieldsAdd total = lookup([fetch dt.system.events| filter event.kind == "BILLING_USAGE_EVENT" and event.type == "Traces - Query"| dedup event.id| summarize total = sum(billed_bytes / 1024 / 1024 / 1024.0)| fieldsAdd key = 1], sourceField: key, lookupField:key)[total]| fields User, App_contexts, data_read_GiB, data_read_pct = data_read_GiB / total * 100, Query_count| sort data_read_GiB desc
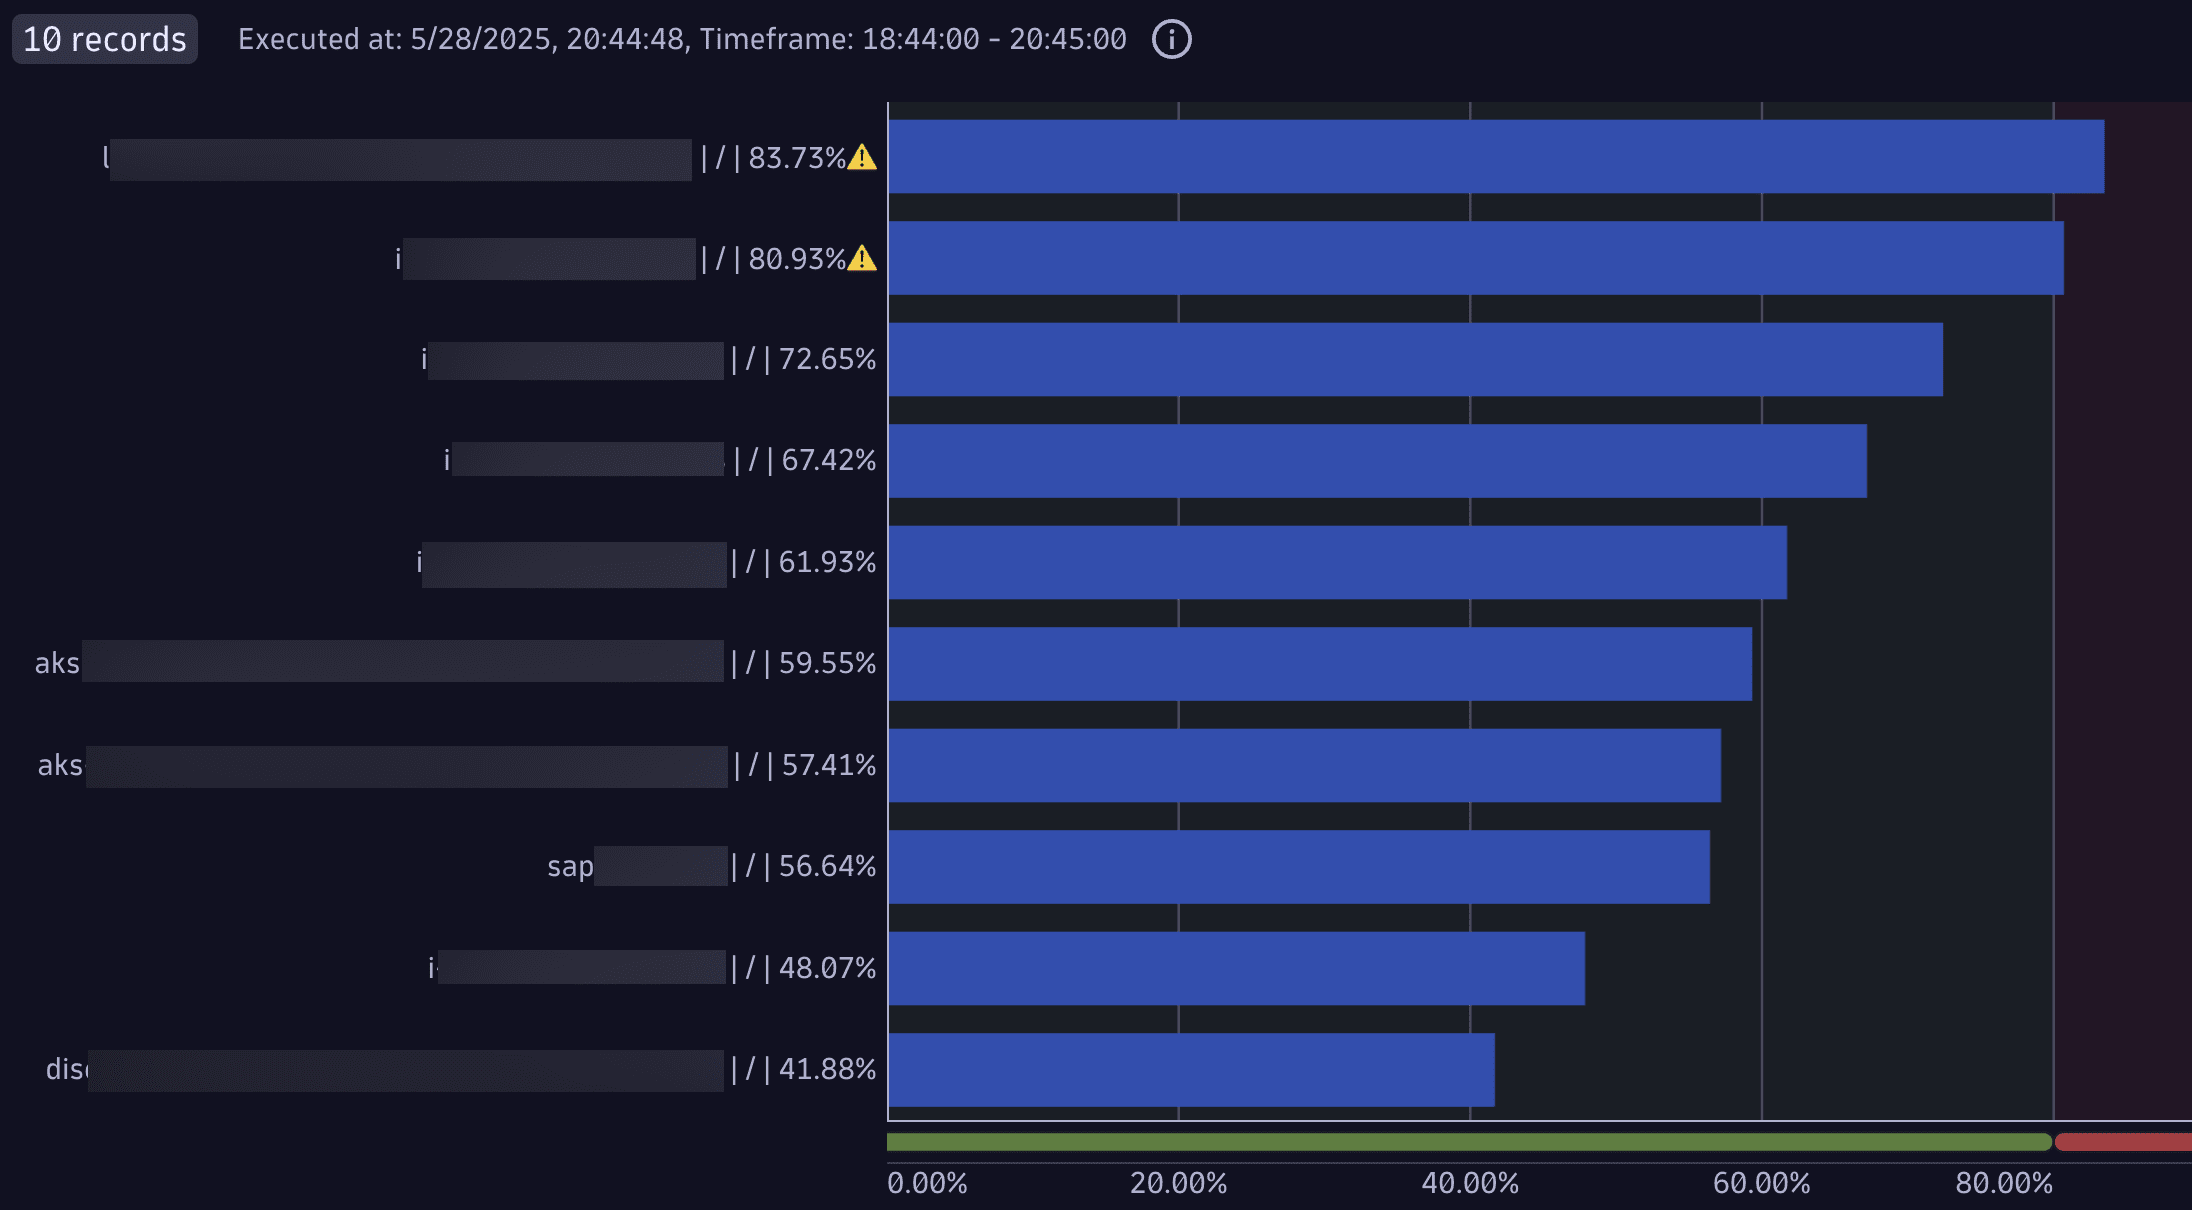
Example: Top 10 disks with the highest average usage
This query identifies the top 10 disks with the highest average usage across hosts. It calculates the average disk usage percentage for each disk-host pair, and then computes the overall average for each combination.
timeseries percent = avg(dt.host.disk.used.percent), by:{dt.entity.host, dt.entity.disk}| fieldsAdd percent = arrayAvg(percent)| fieldsAdd display = concat(entityName(dt.entity.host), " | ", entityName(dt.entity.disk), " | " , round(percent, decimals:2), "%", if(percent>80, "⚠️"))| sort percent desc| limit 10
Query result:
For more examples, see the Trace query usage notebook in Dynatrace Playground.
Related topics
 Distributed Tracing