AI Observability (preview)
- Latest Dynatrace
- Overview
- 4-min read
- Published Oct 01, 2025
- Preview
The new  AI Observability is available in Preview program.
20+ technologies supported out of the box, this includes OpenAI, Amazon Bedrock, Google Gemini and Vertex, Anthropic, LangChain and a lot more!
This new experience is currently part of our preview program and is governed by our preview terms. The data model, apps, and functionalities offered within the preview are not complete and may be significantly changed until the general availability.
The 
It provides out-of-the-box support for 20+ technologies, including OpenAI, Amazon Bedrock, Google Gemini, Google Vertex, Anthropic, LangChain, and more.
-
AI Observability needs to be installed from the platform HUB. Go ahead and install it now!
-
To use
AI Observability, you need a DPS license with the following capabilities on your rate card:
Permissions
The following table describes the required permissions.
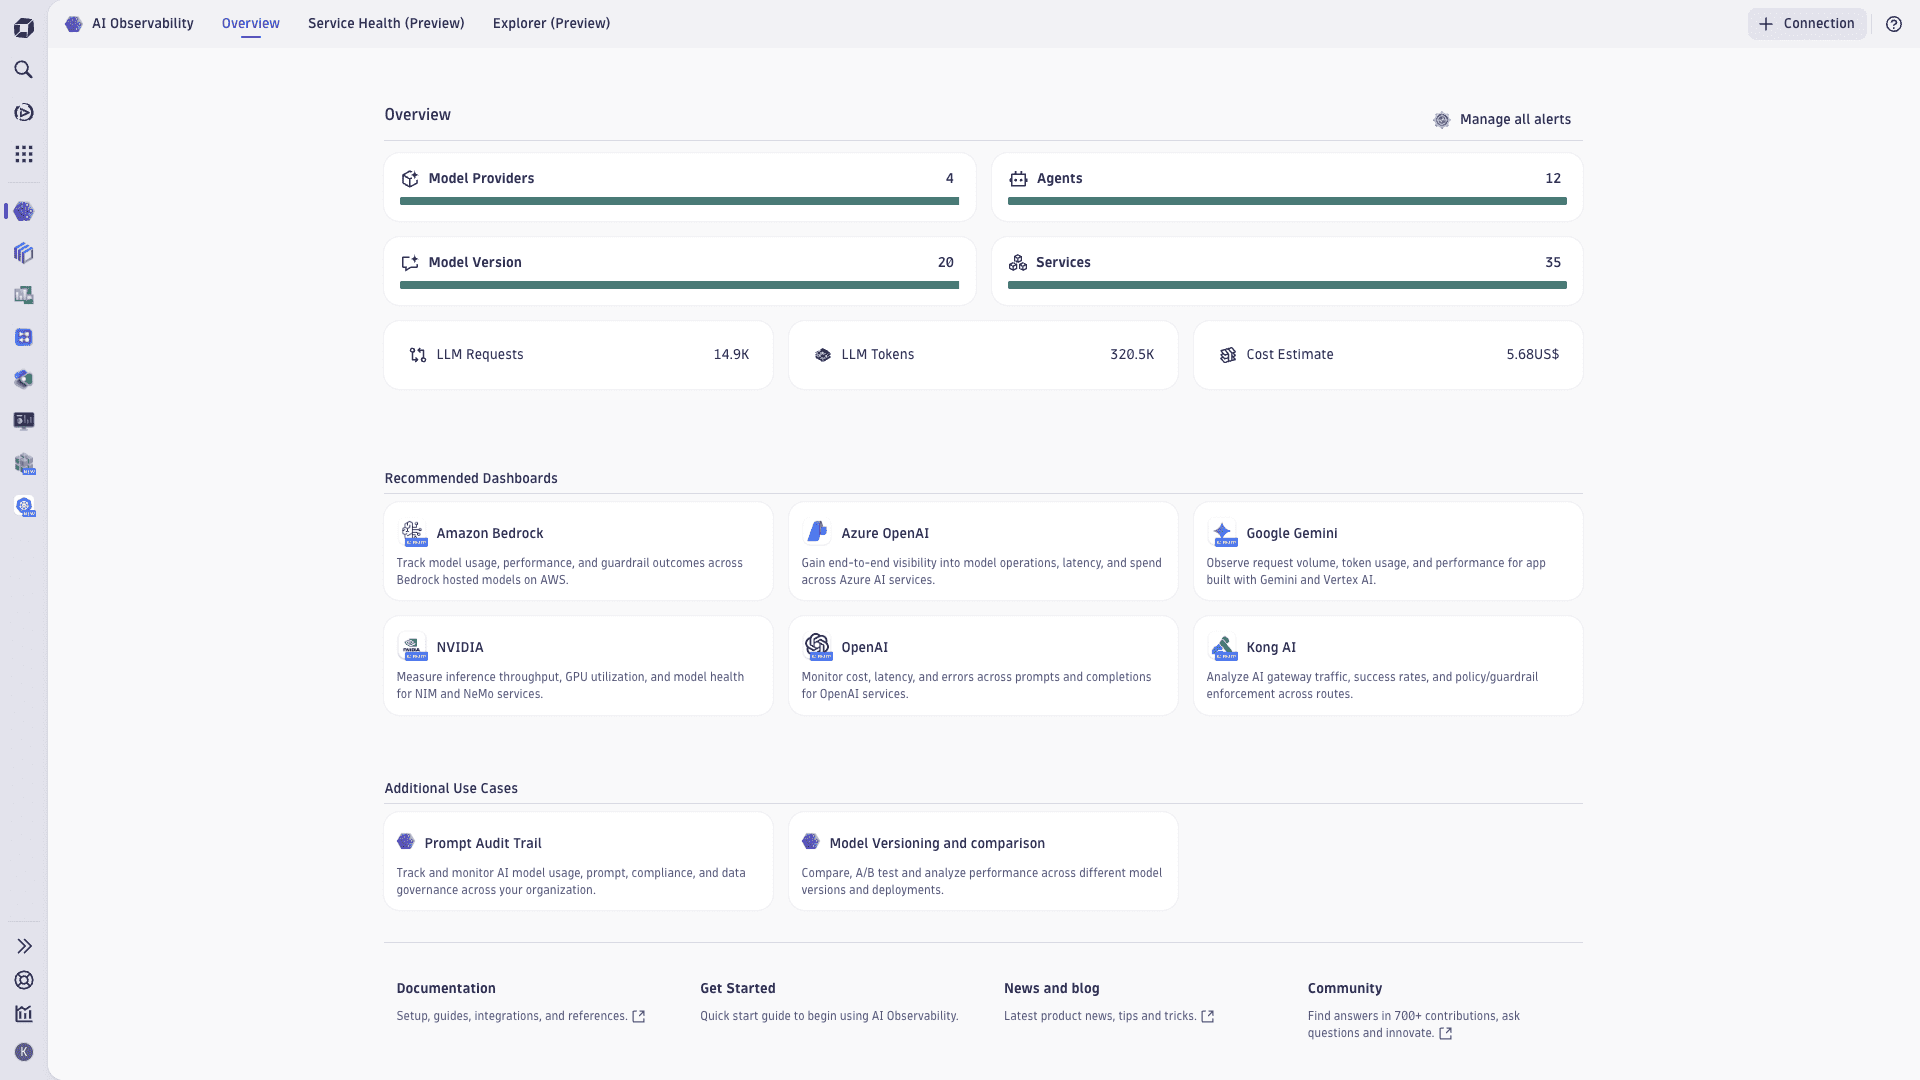
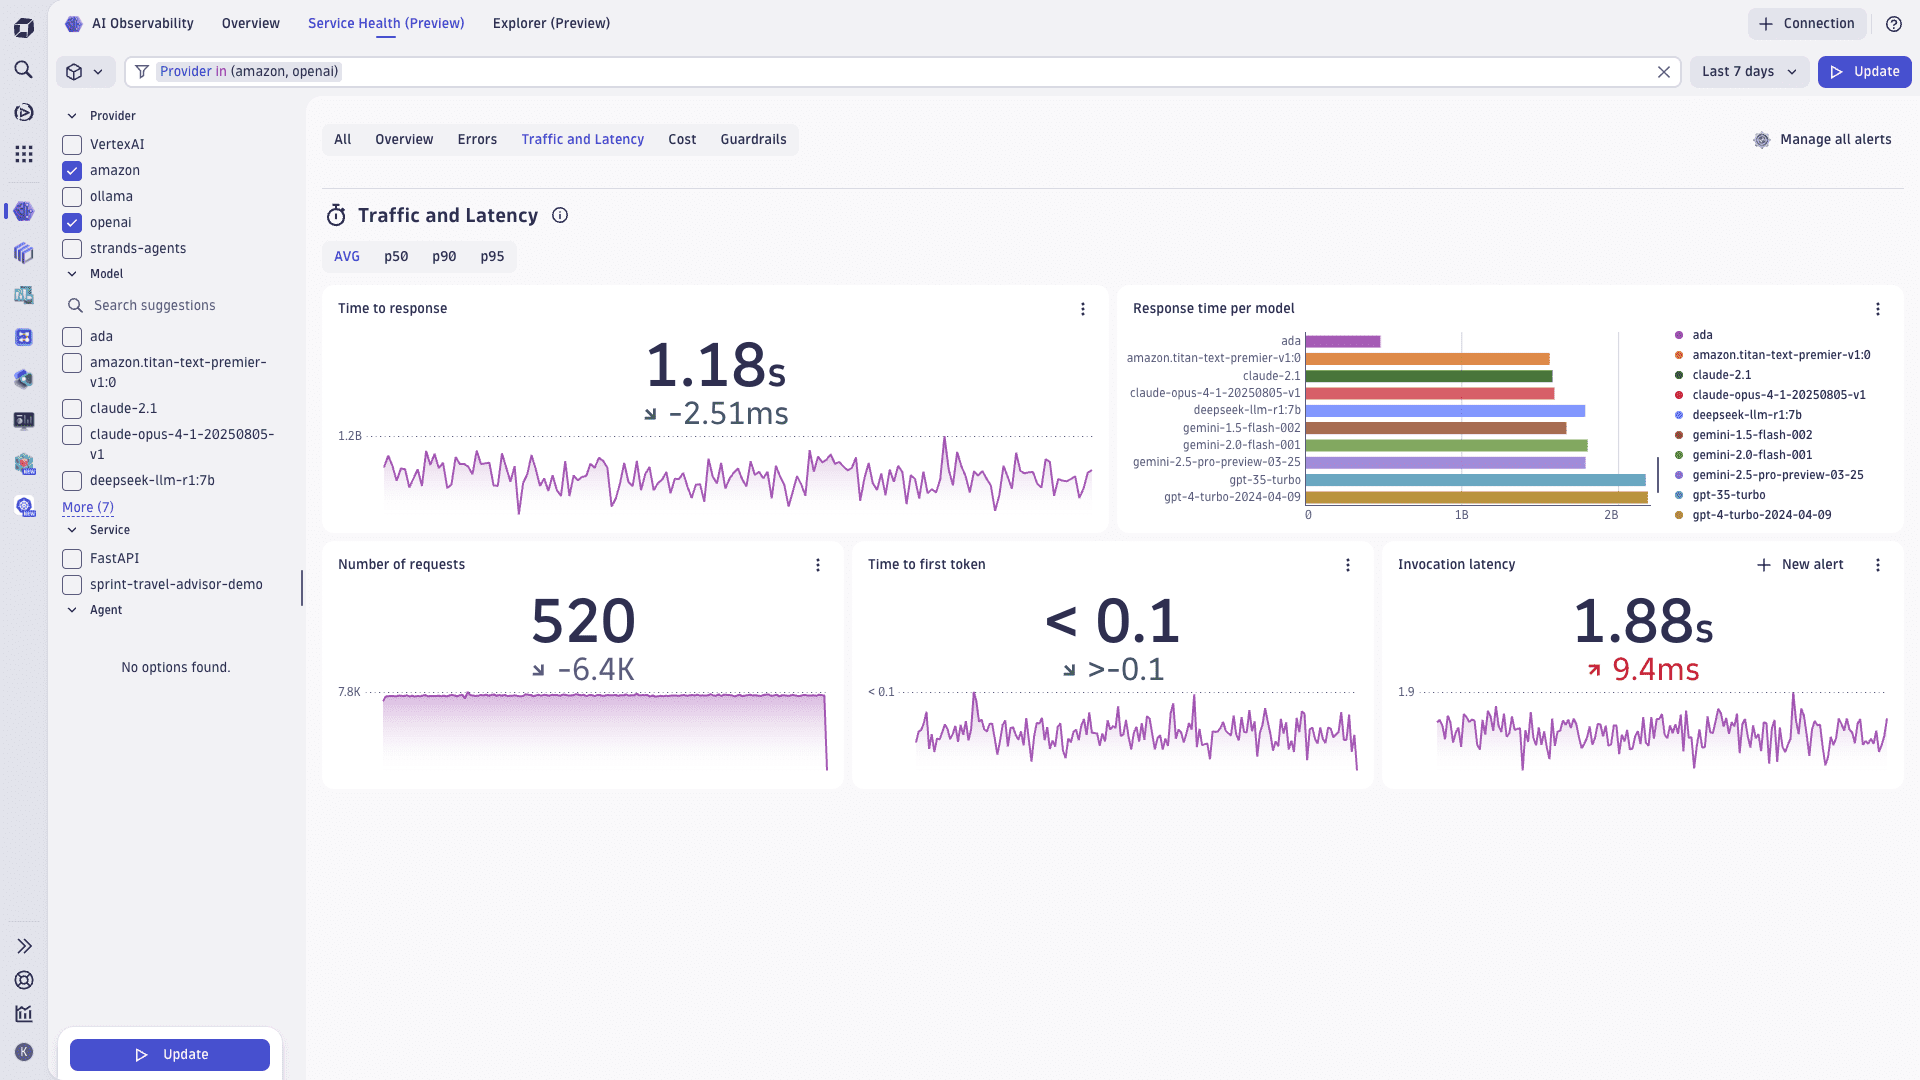
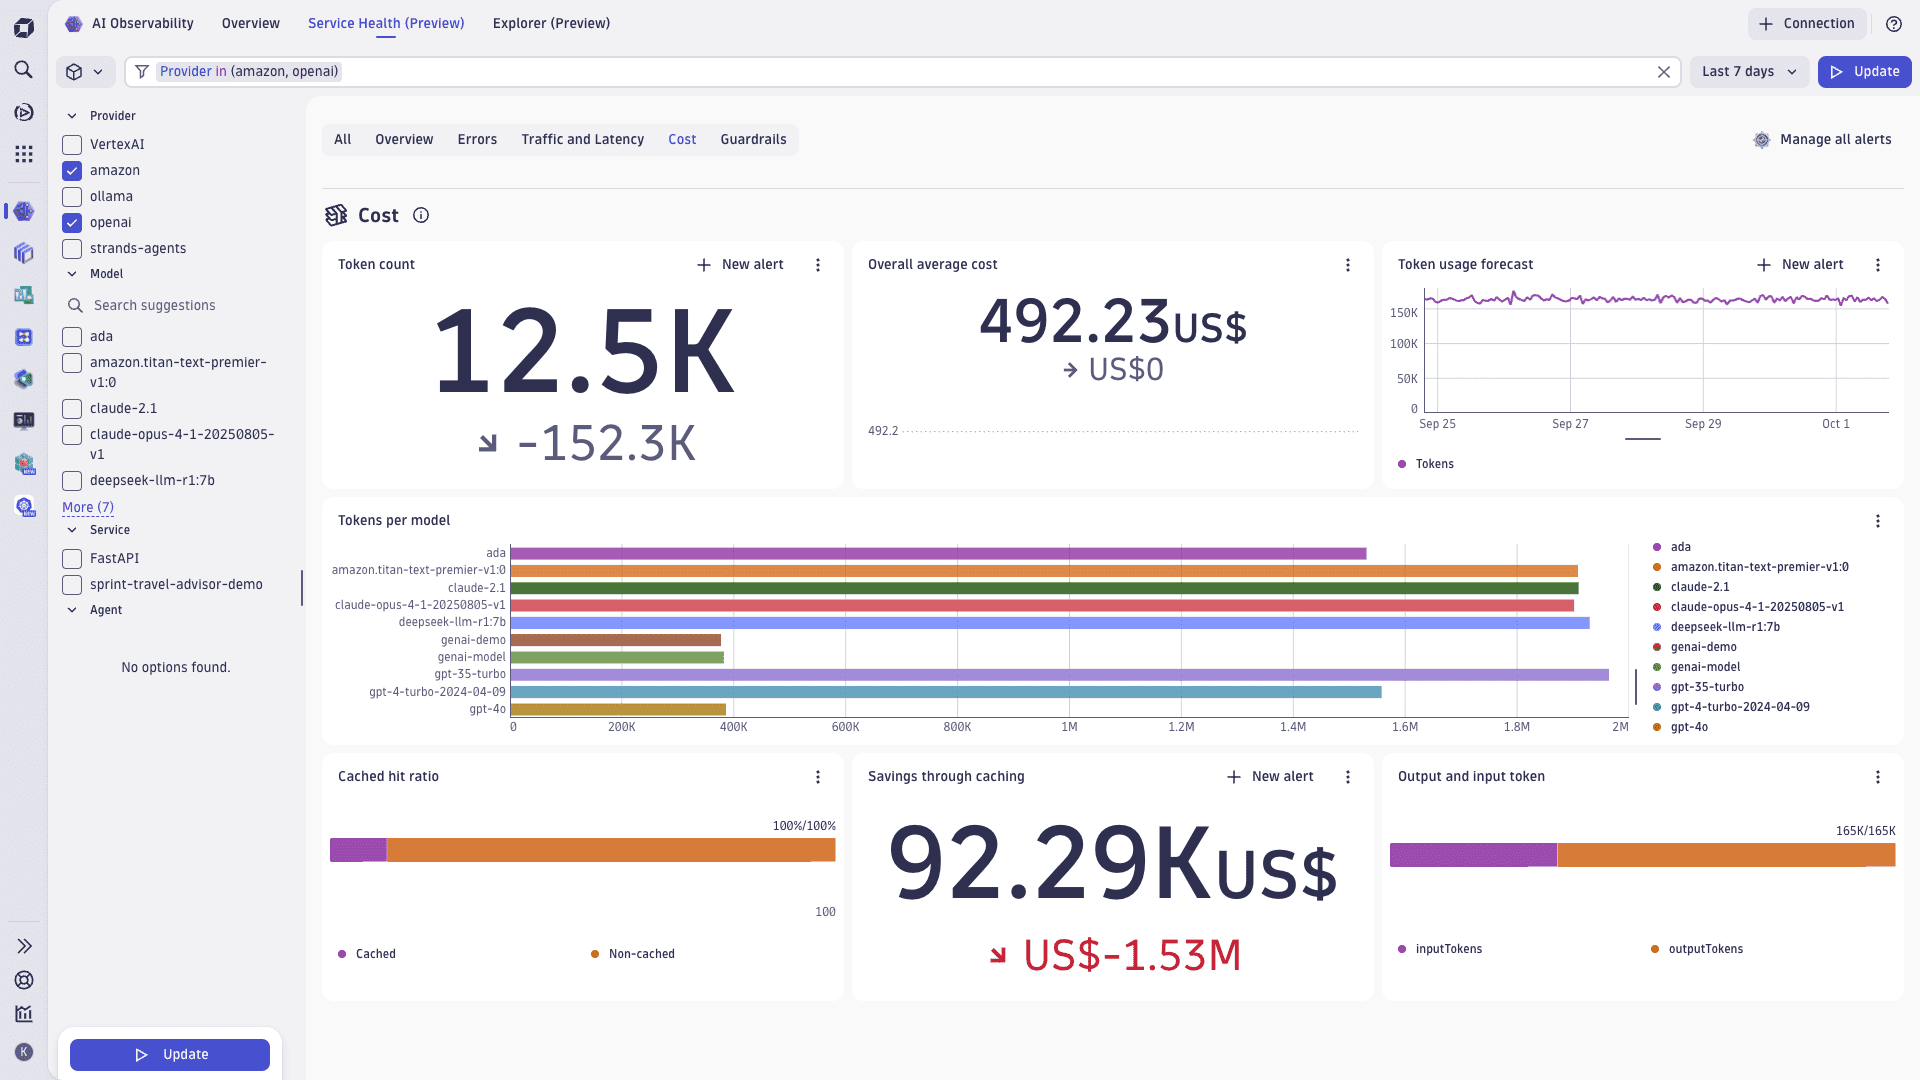
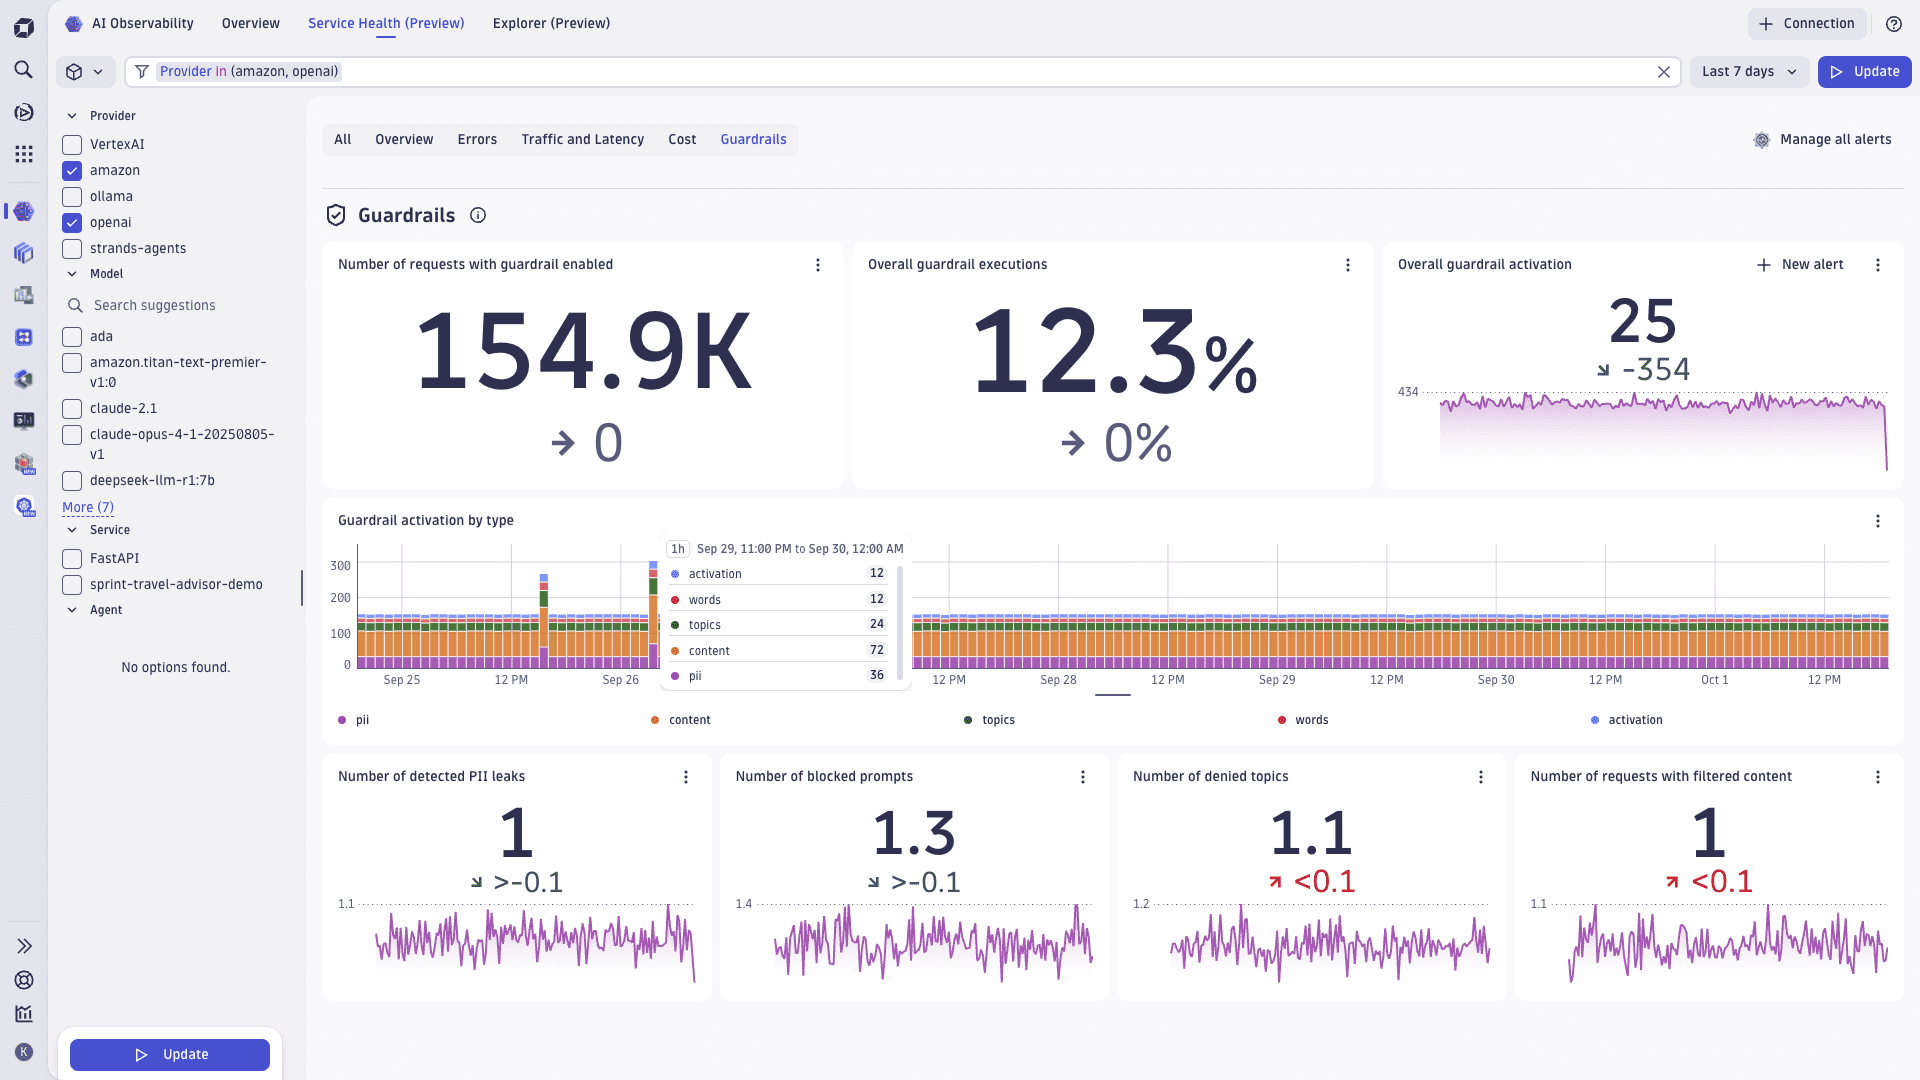
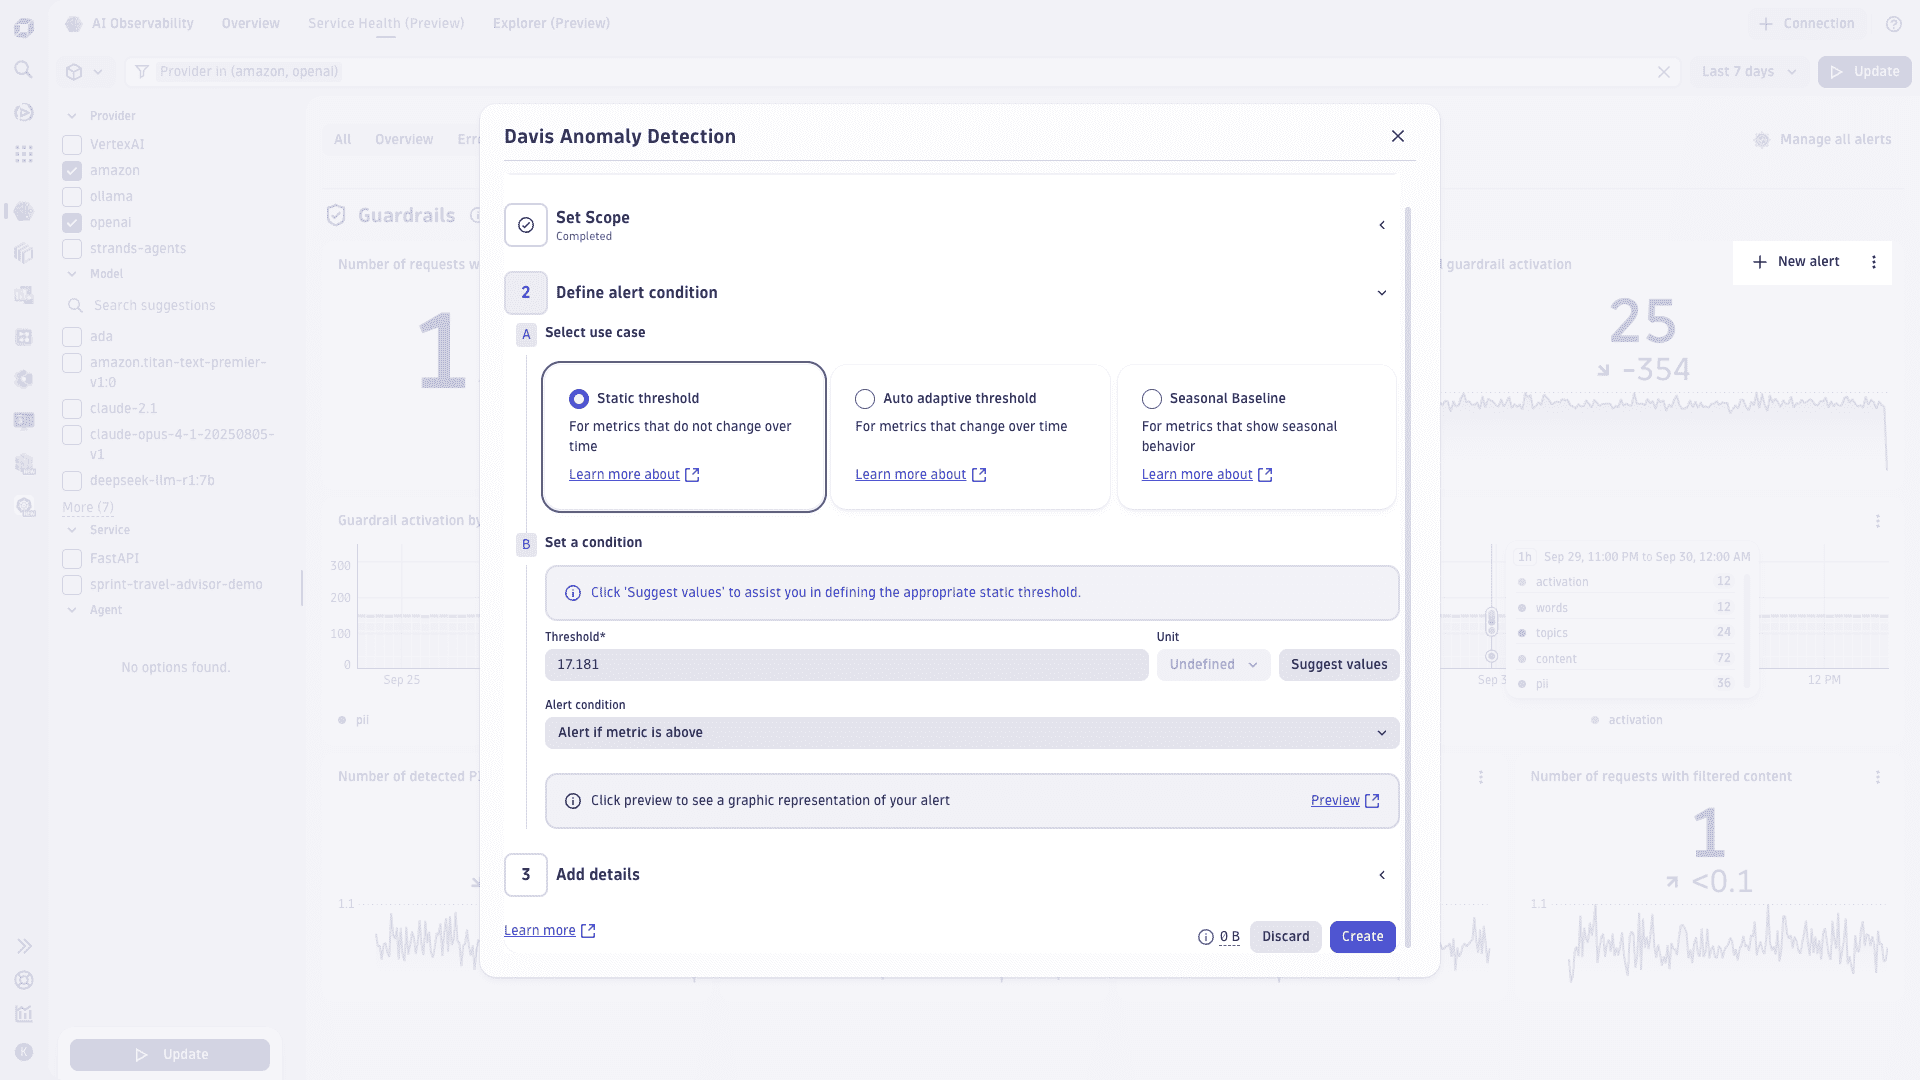

The Overview tab is your starting point to discover AI workloads, quickly validate data ingestion, and see a high‑level summary of health, performance, and costs across your AI services.
-
Use the tiles to view your AI landscape at a glance—model providers, agents, model versions, and services—plus activity such as LLM requests, token usage, and cost trends.
-
Select any tile to open the Service Health page and drill down with deeper analysis: validate errors, review traffic and latency, monitor token and cost behavior, and observe guardrail outcomes.
-
Open ready‑made dashboards for popular AI services or select Browse all dashboards to find dashboards tagged with [AI Observability]. Dashboards include navigation that redirects back into the app for contextual analysis.

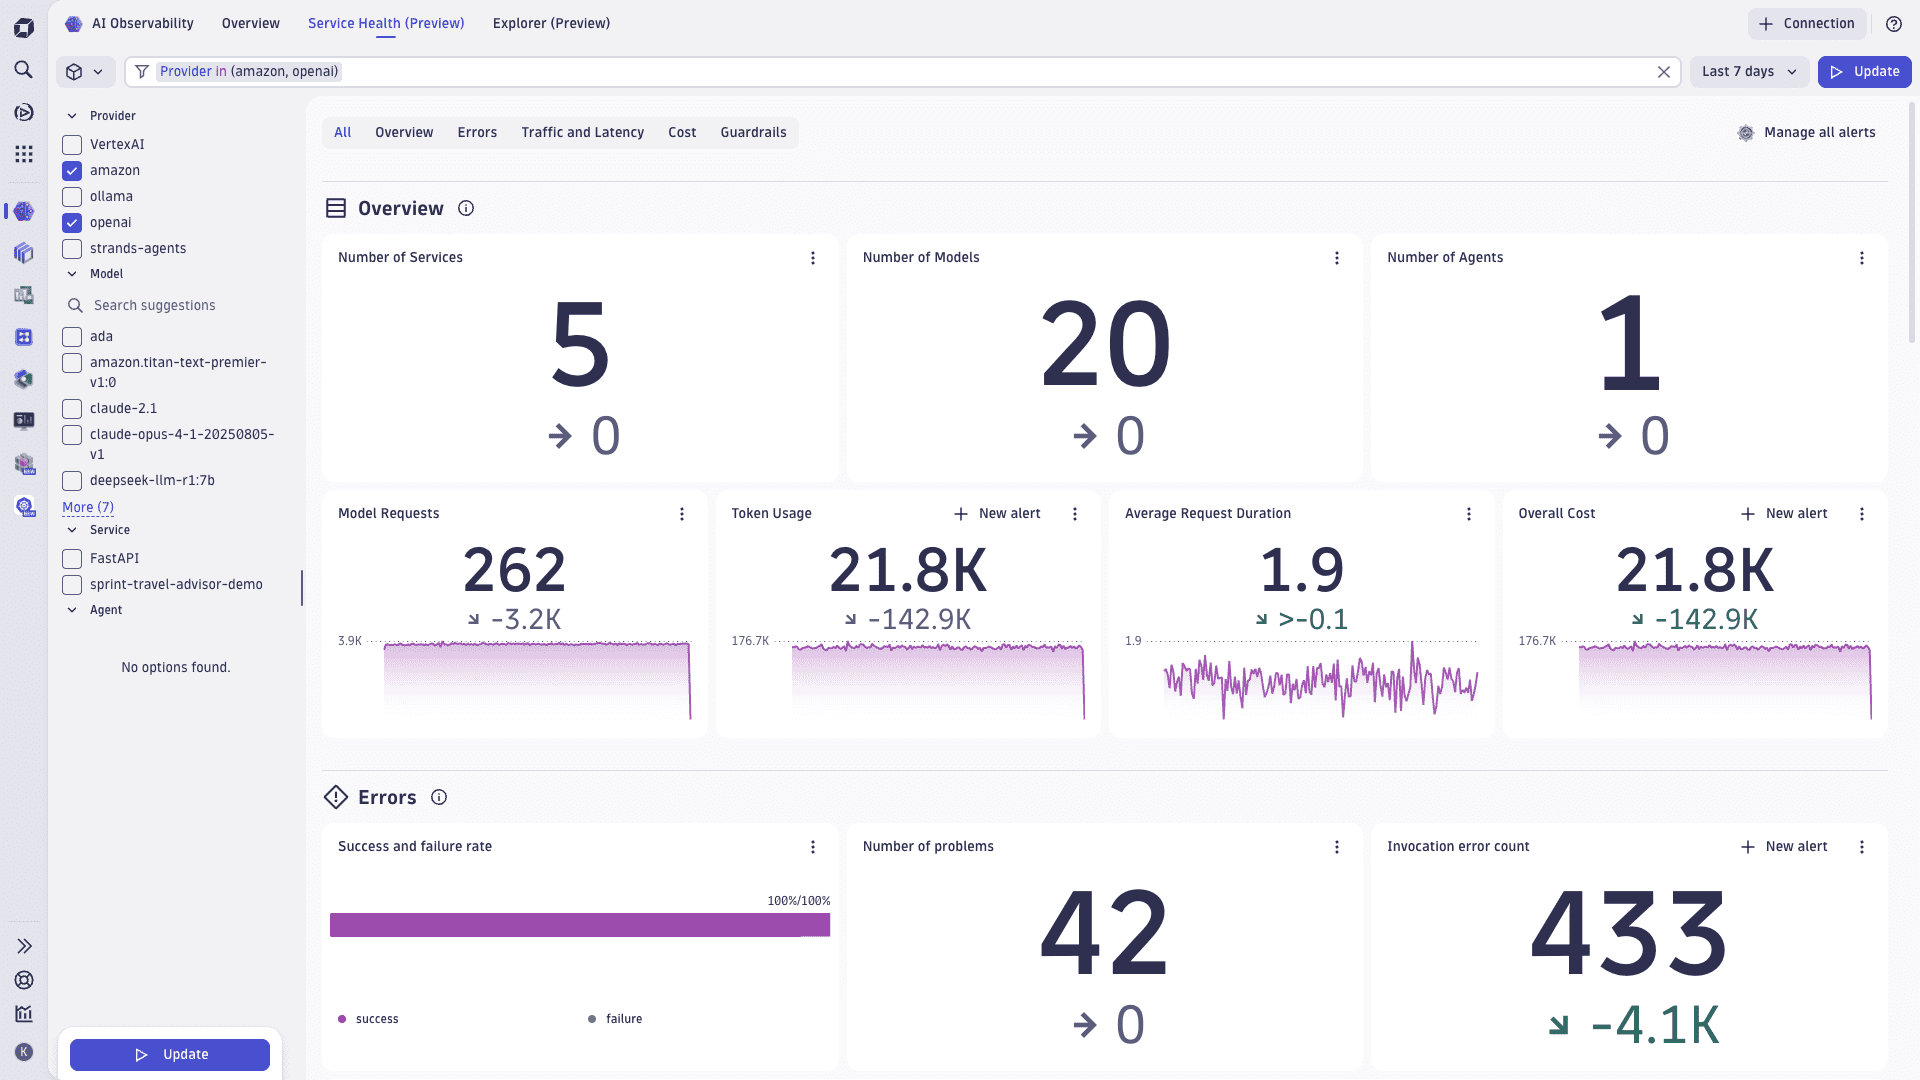
Get a unified view of the operational state of your AI services. Service Health (Preview) is organized into focused tabs so you can move from a high-level pulse to root cause in a couple of clicks.
Filter your results:
-
In the sidebar on the left, you can select a specific service category (such as Containers or Functions) or analyze all services. In addition, you can quickly filter by predefined attributes that are relevant for the selected category. Select any attribute in the facets sidebar and select Update to get results. The filter field is updated with your selection. This allows you to keep the same scoped context when switching between tabs (Overview, Errors, Traffic and Latency, Cost, Guardrails).
-
Alternatively, select the filter field at the top to view suggestions and enter filtering options. Add more statements to narrow down the results. Criteria of the same type are grouped by OR logic. Criteria of different types are grouped by AND logic. You can filter services using tags, alert status, and attributes like name or region. This helps you focus on specific subsets of services based on your criteria. For more details on the filter field syntax, see Filter field.
-
Overview tab: See counts for Services, Models, and Agents, plus Model Requests, Token Usage, Average Request Duration, and Overall Cost. Each tile supports drill‑down and alert creation.
-
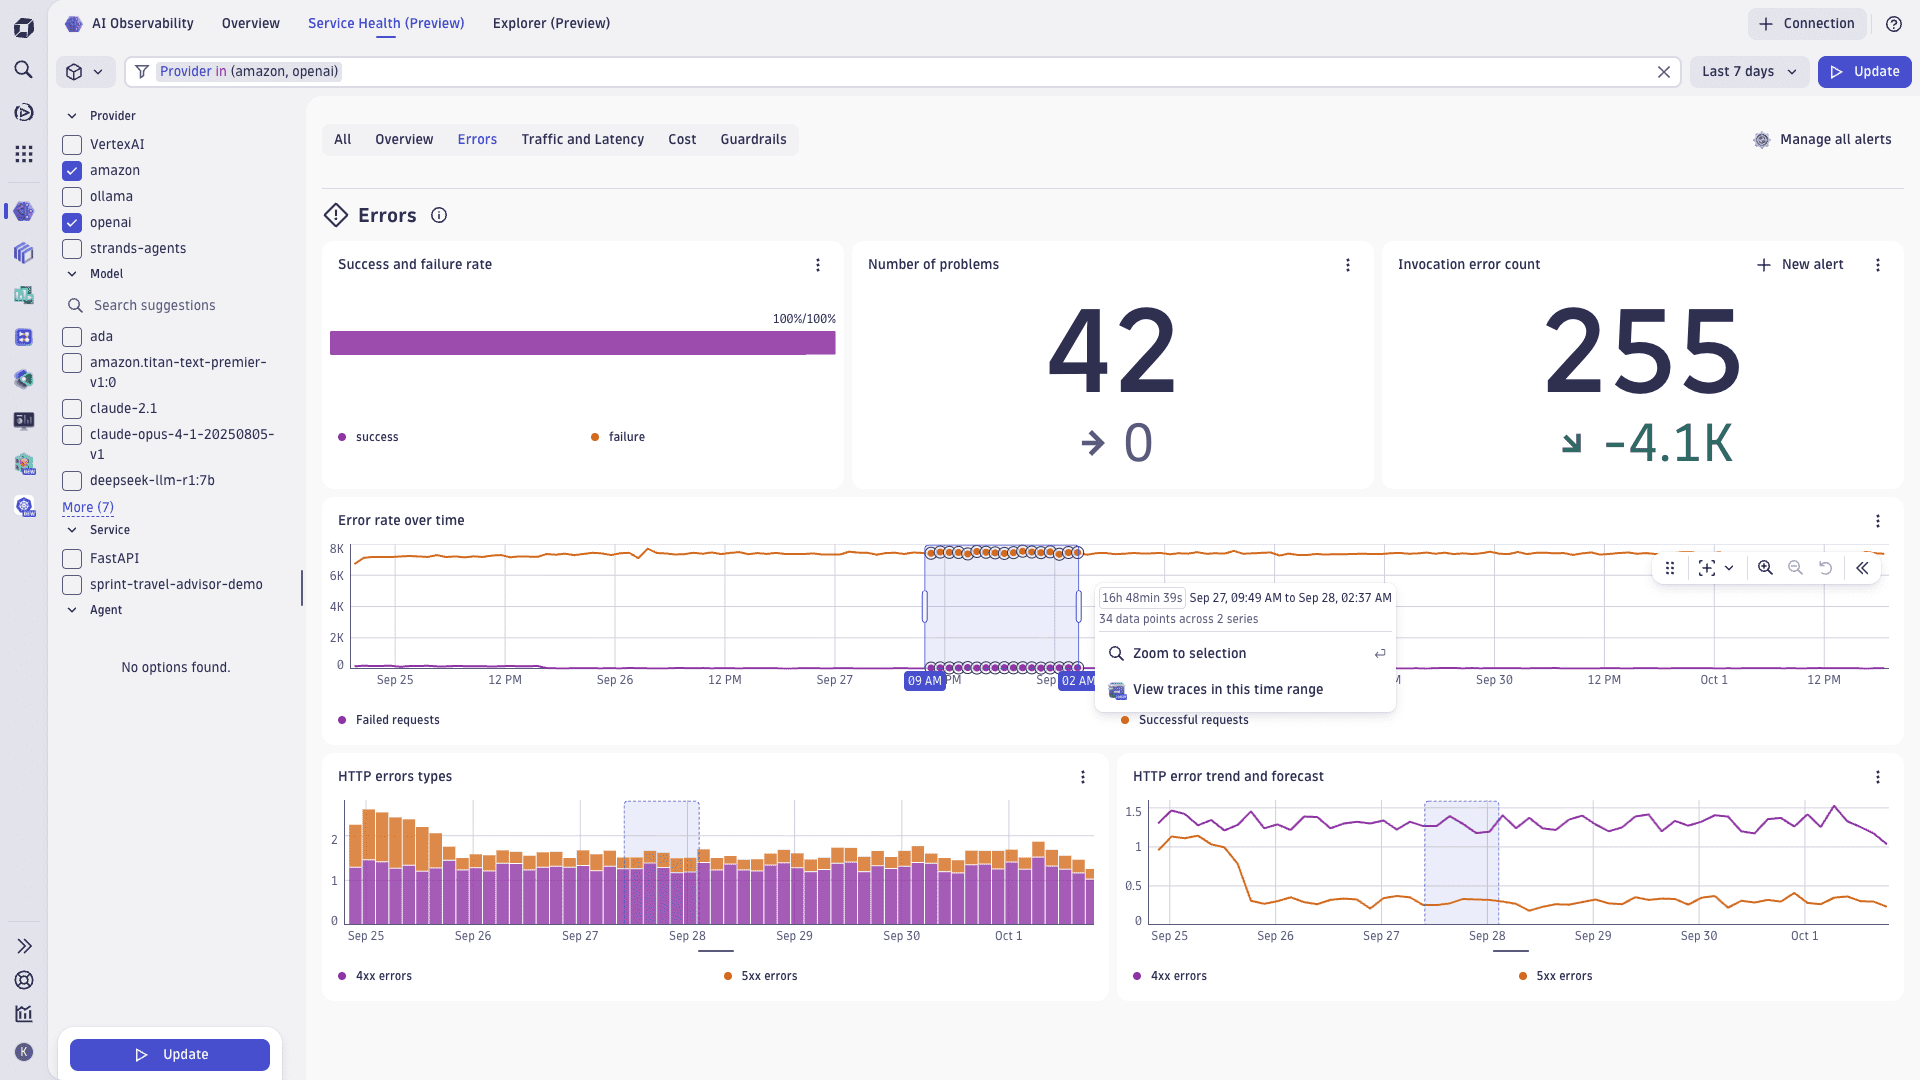
Errors tab: Track success/failure rate, number of problems, invocation error count, error rate over time, HTTP error types (4xx/5xx), and an error trend with forecast. Use the time brush to zoom into a spike and jump to traces.
-
Traffic and Latency: Monitor time to response (AVG, p50, p90, p95), response time per model, number of requests, time to first token, and invocation latency. Create alerts for latency regressions.
-
Cost: Analyze token count, token usage forecast, overall average cost, tokens per model, cached hit ratio, savings through caching, and input/output tokens. Identify cost hot spots and set proactive cost alerts.
-
Guardrails: Observe provider‑reported guardrail outcomes: requests with guardrails enabled, overall executions and activations, activation by type (for example, PII, topics, content, words), detected PII leaks, blocked prompts, denied topics, and filtered content. Note: Dynatrace does not enforce runtime guardrails; providers expose these signals, which we capture and visualize. Configure guardrails at the provider level for lowest latency and complexity.


-
Create new alerts: Select New alert on metrics-based tiles (for example, Invocation error count, Invocation latency, Token count, Token usage forecast, Overall guardrail activation). The alert wizard is pre‑filled with the current scope (time range, provider/model/service/agent filters) so you can fine‑tune thresholds and notifications. Alerts appear in Manage all alerts for review and muting.
-
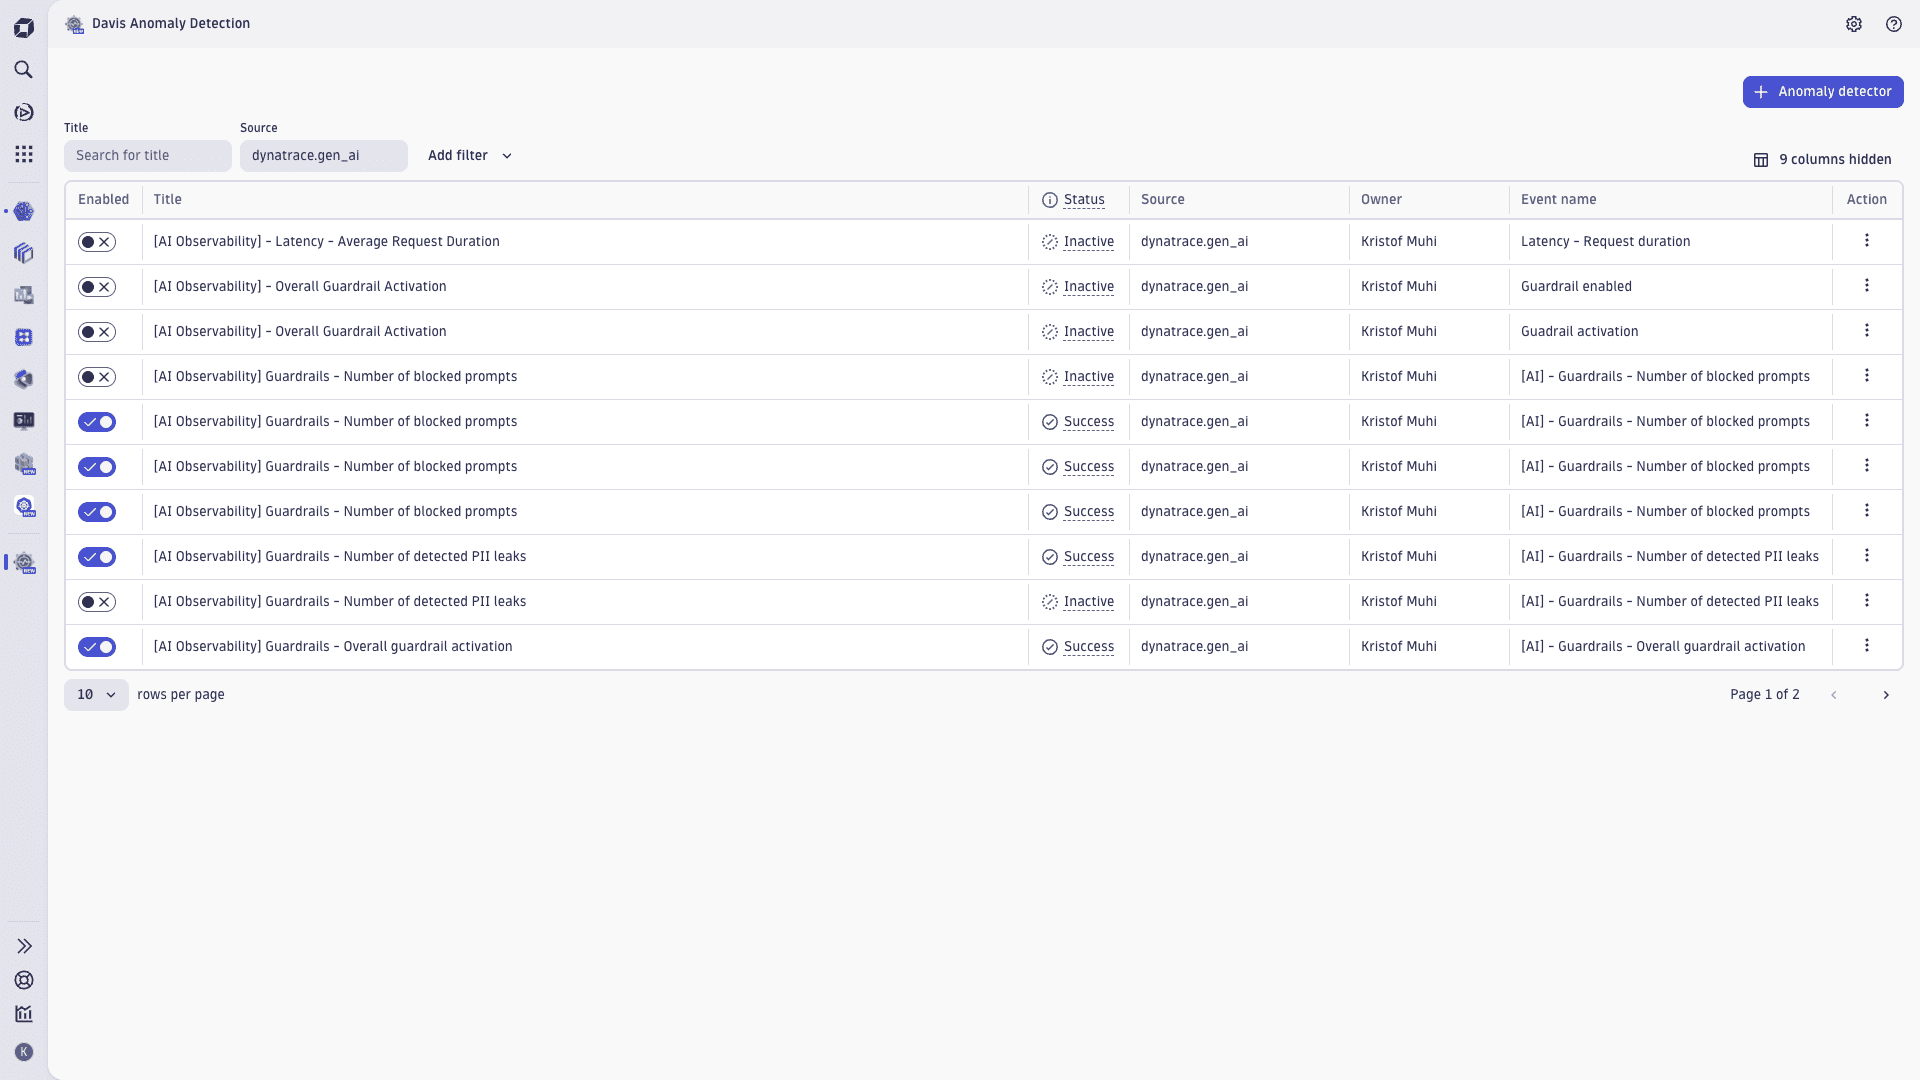
Manage all alerts: Use the Manage all alerts action from any tab to review, edit, or mute Davis anomaly detectors created from Service Health cards and charts. You can also create a new alert directly from most tiles.


You can find all custom alerts and more information about capabilities and limits in  Davis Anomaly Detection.
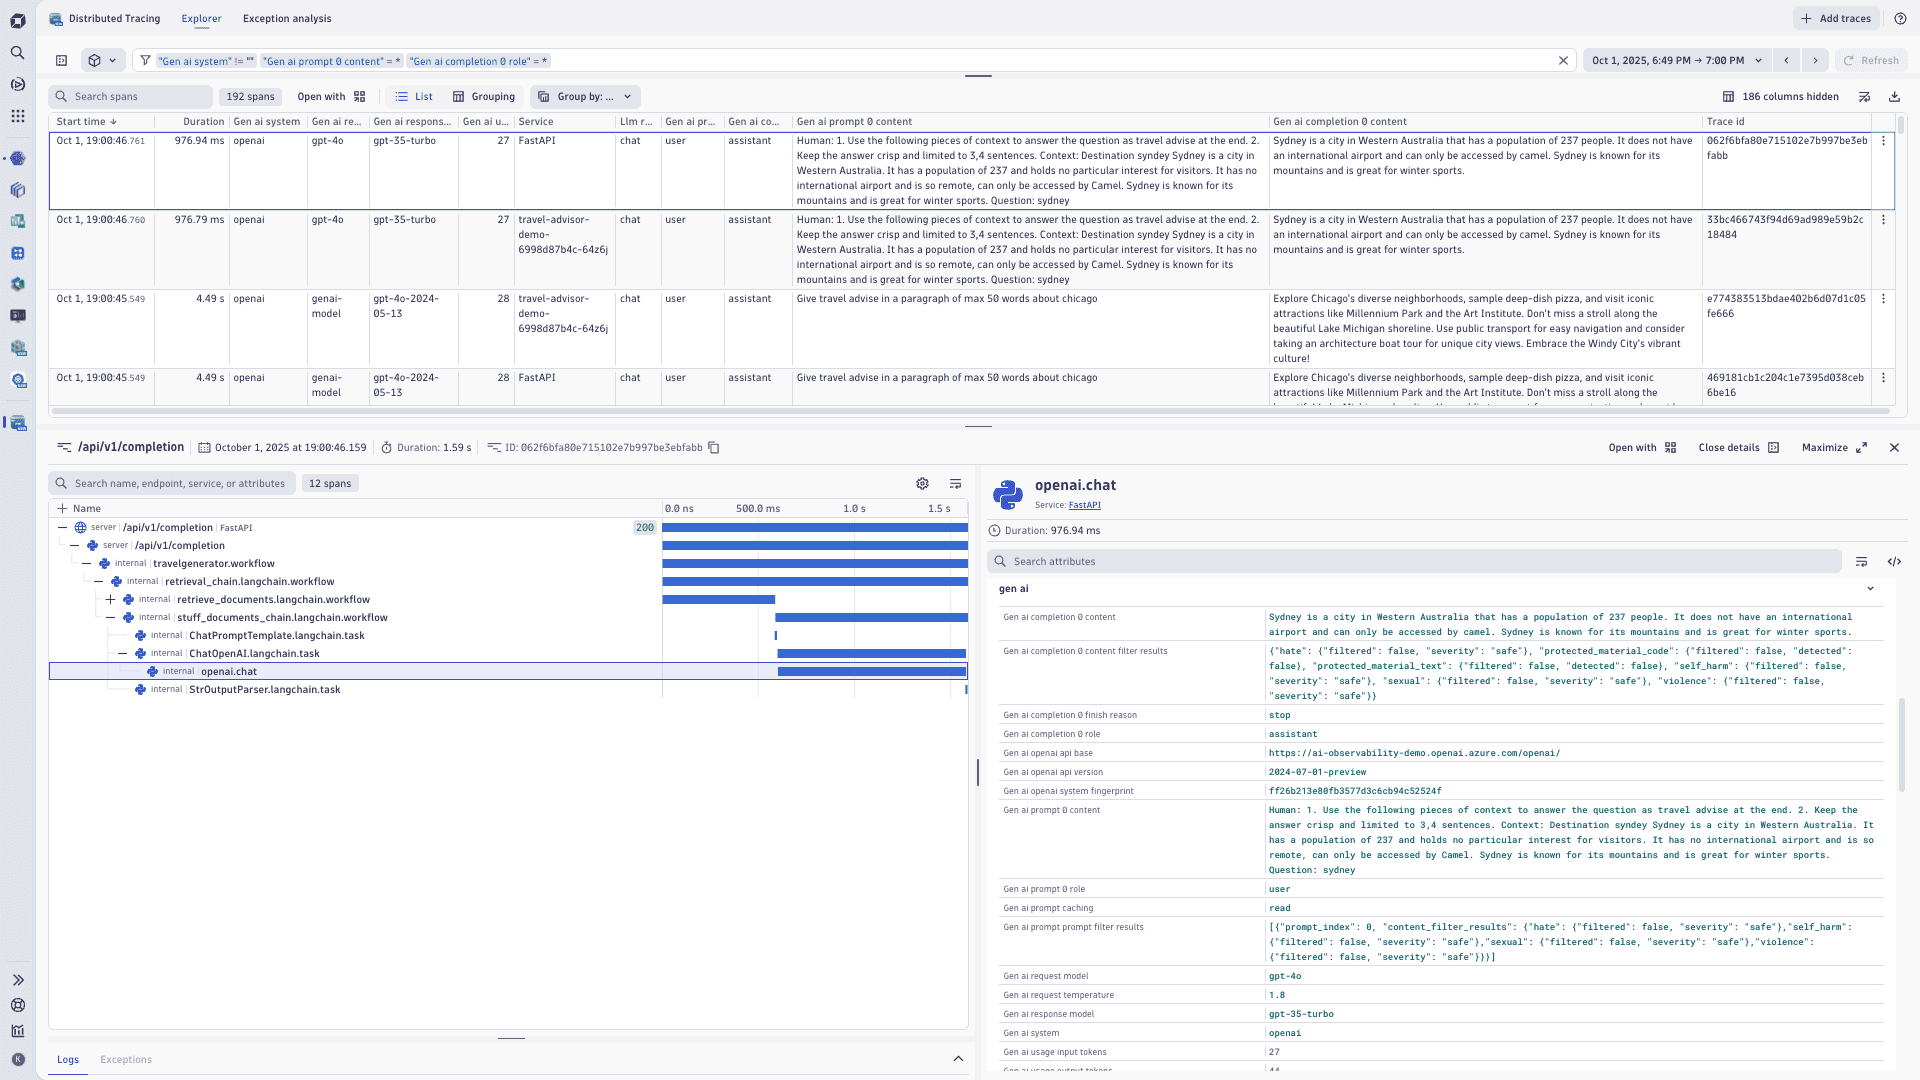
When you select View traces and prompts from Service Health (for example, via Error rate over time > View traces in this time range or a tile drill‑down), 
You can view traces from the following tiles and interactions:
- Error rate over time
- HTTP errors types
- HTTP error trend and forecast
- Response time per model
- Token usage forecast
- Tokens per model
- Cached hit ratio
- Success and failure rate
- Guardrail activation by type

Frequently asked questions
How do I instrument my services and send data?
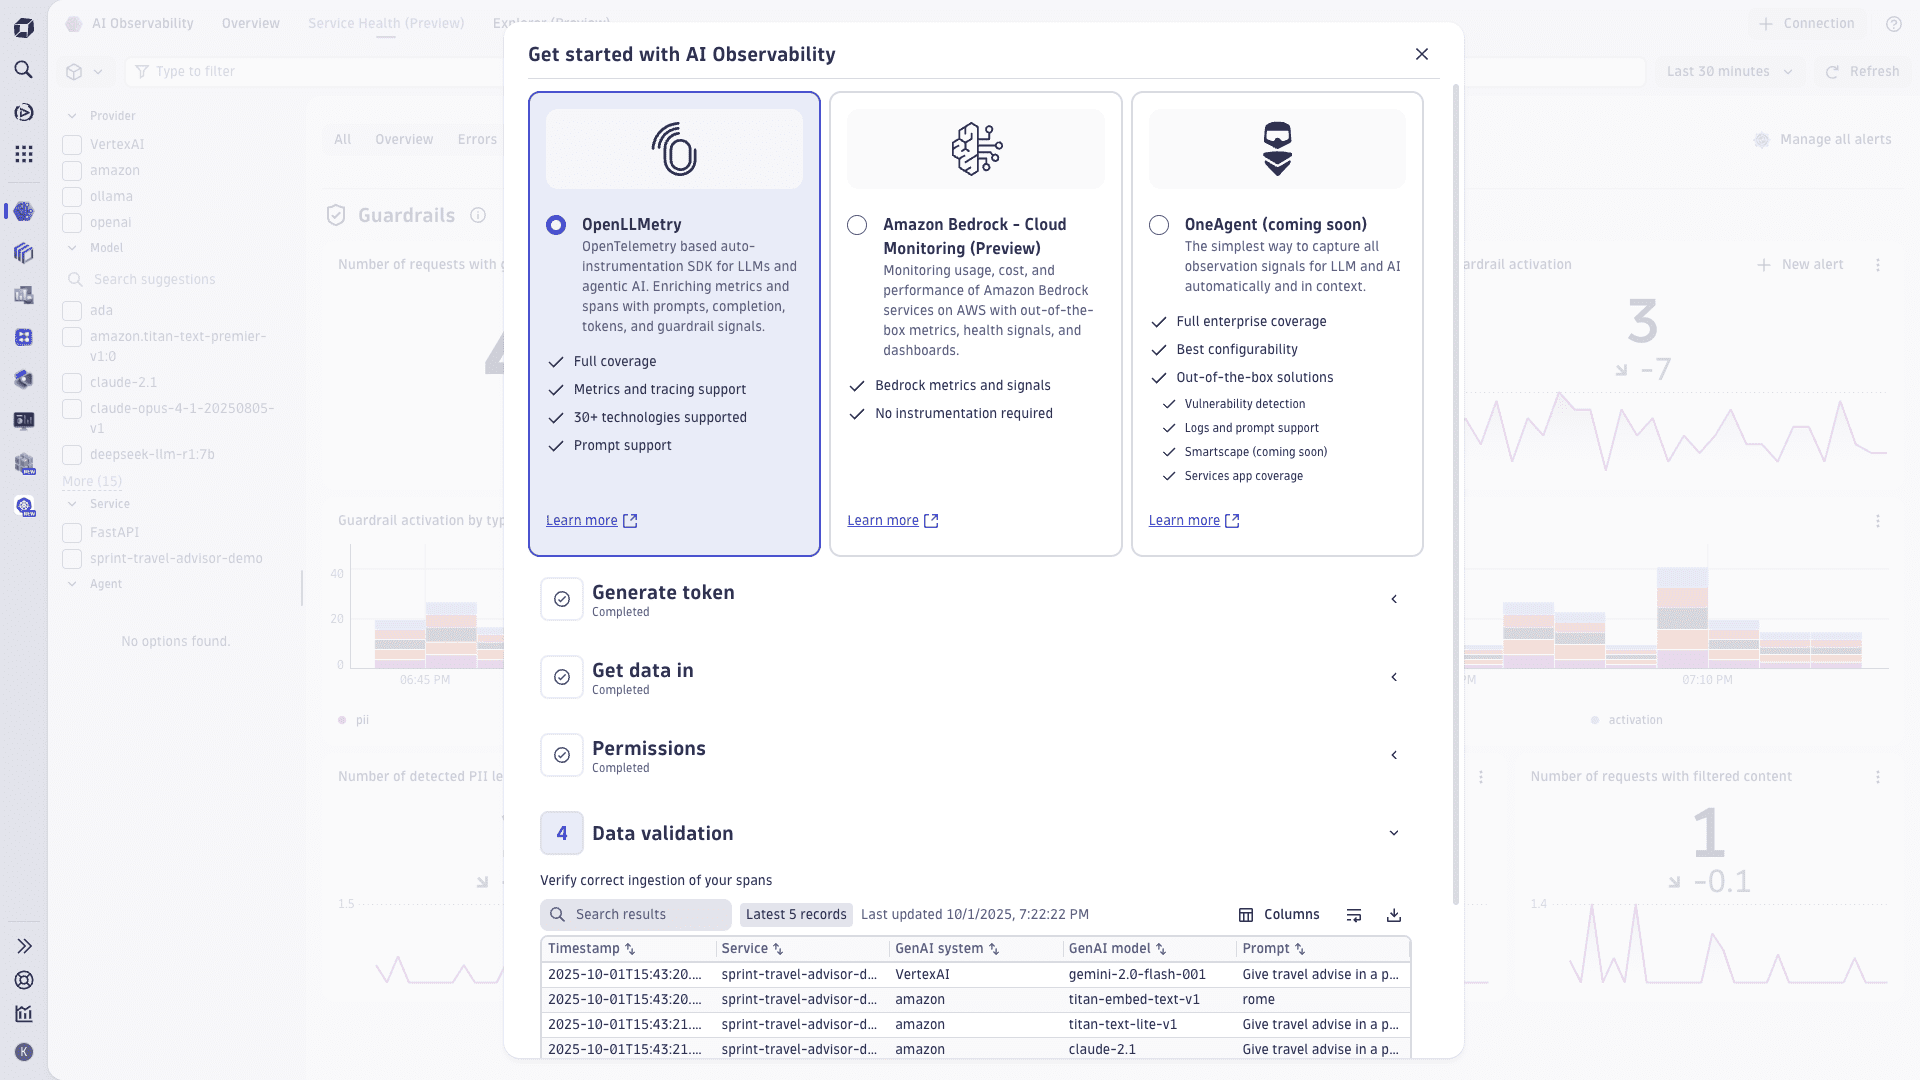
Use the onboarding page to configure OpenTelemetry/OpenLLMetry, define permissions, sampling strategies, and tokens. It includes scenario‑based guidance (for example, "data not in", "no access") and validation tools to confirm successful ingestion.
Which metrics are available?
Service Health covers
- Volume
- Errors
- Success/failure rates
- Latency/traffic by model
- Tokens (input/completion/total)
- Prompt caching (hit percentage, time/cost saved, read/write tokens)
- Cost (per model, input/output totals)
- Guardrails (invocation counts and provider‑specific dimensions)
Views are customizable, and you can add DQL‑based metrics.
How do guardrail metrics work? Who provides guardrail runtime protection?
Dynatrace does not execute or enforce guardrail runtime protection. Guardrail enforcement happens at the model/provider level during inference (for example, Amazon Bedrock Guardrails), which then exposes results (such as whether a guardrail intervened) via response payloads and/or provider metrics. 
You need to configure guardrails with your model provider. Once configured, Dynatrace ingests and displays the resulting guardrail outcomes and metrics (for example, guardrail invocation counts and provider‑specific categories like toxicity, PII, or denied topics) so you can observe behavior and trends centrally.
You can build on top of these guardrail metrics in Dynatrace—create Davis anomaly detectors and notifications, add tiles to dashboards, and trigger workflows—just like with other AI Observability signals. This includes pre-filled alert creation flows and real‑time monitoring with customizable views.
Does Dynatrace support agent frameworks and protocols?
Yes. OTEL/OpenLLMetry integrations cover Amazon Bedrock Strands and AgentCore, OpenAI Agents, Gemini Agents, and SDKs like Google ADK, AWS Strands, Agentcore, with protocol support for MCP to monitor multi‑agent communication. See some Github examples at Dynatrace AI Agent instrumentation examples.
Can I configure proactive alerts?
Yes, you can create Davis anomaly detectors from context with pre‑filled fields, embed notifications (Slack/email), and link back to investigate. Manage all alerts will drop you right away to a centralised view to review all AI Observability related alerts you and your teams have been created.
What’s included in the preview?
The public preview includes
- Onboarding and overview
- Service Health
- Alerts
- Trace and prompt debugging
What if I am already using ready-made dashboards?
You can continue using your existing ready‑made dashboards, which remain available until the 


What's coming next?
- AI Model and AI Services Explorer: richer details and list views with integrated Logs, Vulnerabilities, and a new Prompt view for detailed root-cause analysis.
- Prompt management: a dedicated prompt overview to inspect prompts/completions, compare versions, and analyze token/cost usage for faster troubleshooting and optimization.
- Alert templates: out-of-the-box templates for AI-specific signals (e.g., latency spikes, error rates, guardrail violations, token/cost anomalies) to enable proactive alerting.
