Metrics browser filters and fields
- Reference
- 3-min read
The Metrics browser lists the available metrics, their filters and details, and the metadata fields for custom metrics.
Metric filters and sorting
By default, the table shows only metrics reported since the start of the selected timeframe (for example, Last 2 hours). Turn off Only show metrics reported after the start of the selected timeframe to show all metrics.
The Filtered by bar offers these filters:
| Filter | Values or search terms | Matching metrics |
|---|---|---|
Text | Search string; select | Metric name, Metric key, or Description contains the string |
Tag | Matching tag | Tags contains the tag |
Unit | Metric unit, such as | Unit matches the selected unit |
Favorites |
| All metrics, only favorites, or only non-favorites |
Dimension | Metric dimension, such as | The metric has the selected dimension |
Filters combine. For example, Dimension Host and Text usage show metrics with the Host dimension and usage in their name, key, or description.
Select the star in the Favorite column to add or remove a favorite. Favorites sort to the top by default. Select Favorite, Name, or Key in the column header to sort the table.
Metric details
Select in the Details column of a metric to see its details and a visualization over the selected timeframe.
| Field | Description |
|---|---|
Metric name | Name of the metric in the UI |
Metric key | Fully qualified metric key; transformations are reflected in the key |
Entity type | Entity type for the metric |
Description | Short description of the metric |
Tags | Tags that further group metrics |
Created | Timestamp when the metric was created |
Last written | Timestamp when the metric was last written |
Davis Data Units billing | Whether the metric is subject to Davis data units (DDUs) consumption |
Unit | Unit of the metric |
Minimum value | Known lower boundary value for the metric |
Maximum value | Known upper boundary value for the metric |
Default aggregation | Default aggregation for the metric |
Aggregations | Allowed aggregations for the metric |
Dimensions | Metric dimensions, such as process group and process ID for a process-related metric |
Transformations | Available transform operators |
Metric value notation
The browser uses order-of-magnitude notation for large values. For example, 7.5M means about 7.5 million, not exactly 7.5 million. The scale depends on the values in the selected timeframe, so the same metric can show k values over a shorter timeframe.
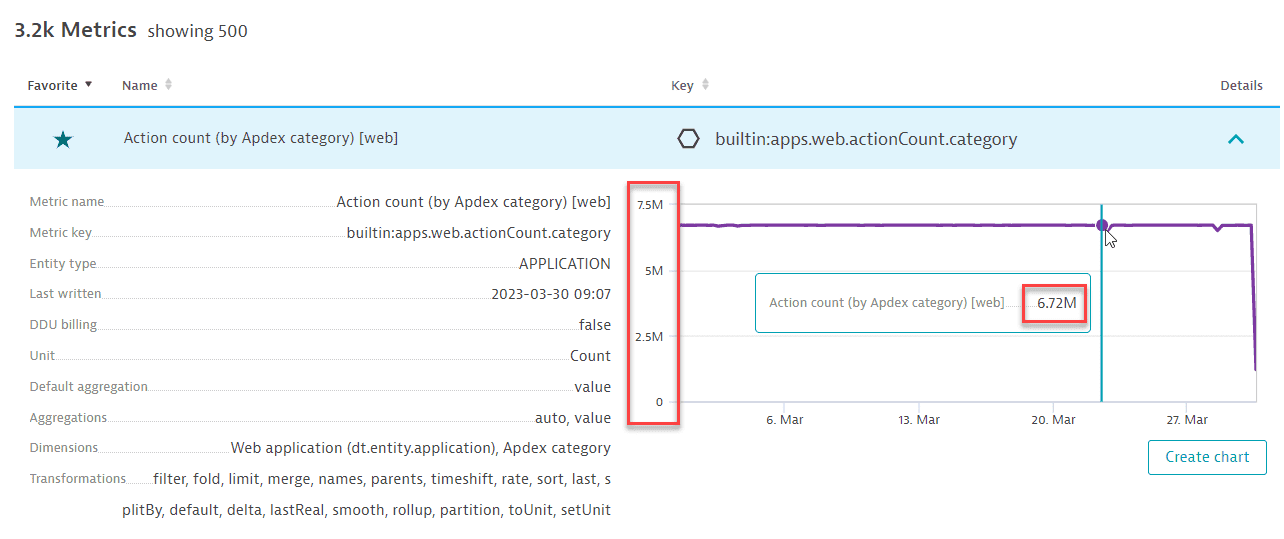
For details, see Order-of-magnitude notation.
Metric charts
Select Create chart in the expanded row of a metric to open the metric in Data Explorer. From there, you can adjust the query and visualization and pin the chart to a dashboard.
Metadata for custom metrics
Custom metric metadata provides context for each metric key, including display names, units, value ranges, and Davis-relevant properties.
The metadata becomes part of the metric descriptor and is available through the API, the Metrics browser, and Data Explorer. You can create it before ingesting the first data point.
Settings 2.0 metadata applies only to custom or schemaless metrics, not built-in or code-registered metrics. It exists alongside the metric time series.
| Field | Description |
|---|---|
Display name | Human-friendly metric name |
Description | How the metric is measured |
Unit | Unit of measurement |
Minimum value | Lower boundary of the metric |
Maximum value | Upper boundary of the metric |
Root cause relevant | Whether the metric strongly indicates a faulty component |
Impact relevant | Whether the metric depends on other metrics and changes after an underlying root-cause metric changes |
Value type |
|
Latency | Minutes before an ingested metric data point becomes available in Dynatrace |
Metric dimensions | Dimension key and display name for each added dimension |
Tags | Tags added to the metric |
Source entity type | Metric entity type; editable only if the metric is ingested through an API endpoint |
To edit these fields in the UI, see Configure custom metric metadata. You can also configure metadata through the API.