What's new in Dynatrace SaaS version 1.320
- Release notes
- 10-min read
- Rollout start on Jul 29, 2025
This page showcases new features, changes, and bug fixes in Dynatrace SaaS version 1.320. It contains:
Platform | Problems
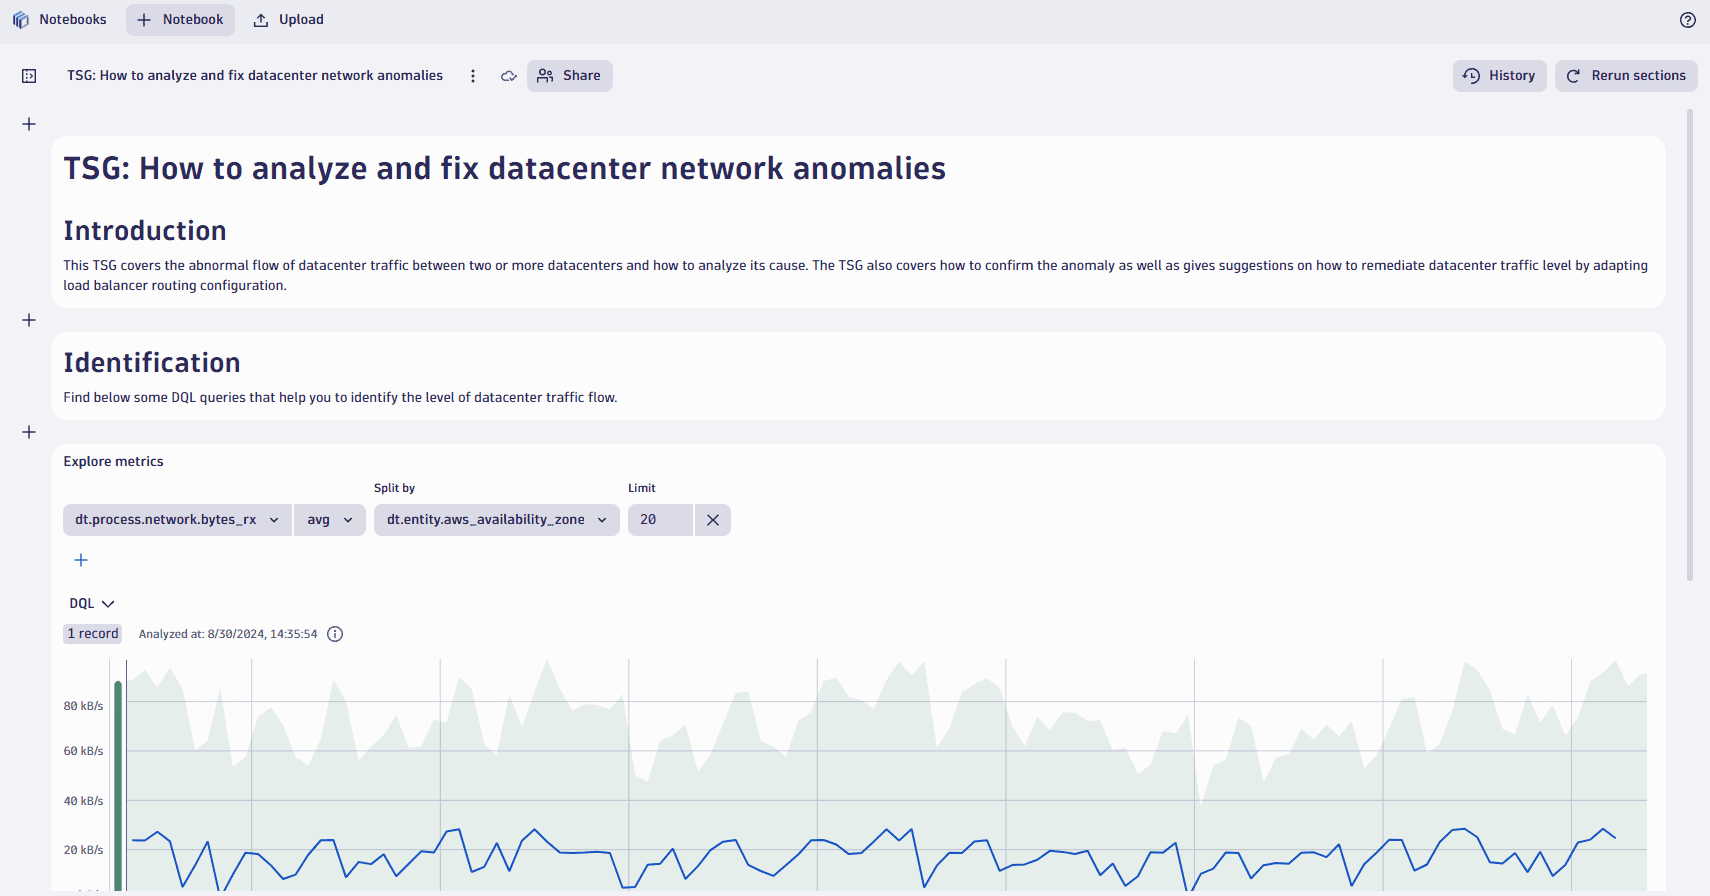
Streamline incident response with troubleshooting guides and Davis CoPilot
You can now create structured troubleshooting guides directly from the  Problems app in Dynatrace.
This feature allows you to document key aspects of an incident—including detection, problem analysis, remediation steps, and helpful resources—using prebuilt templates in  Notebooks or
  Dashboards. Once saved, they serve as a reusable knowledge base for your team, improving consistency and accelerating future incident response.
With Davis CoPilot enabled, relevant troubleshooting guides are automatically suggested when similar problems occur. CoPilot indexes all environment-shared guides every six hours using vector embeddings, enabling fast and accurate retrieval through semantic similarity. To ensure your guide is discoverable, simply share the document at the environment level. This integration helps reduce mean time to repair, promotes knowledge reuse, and ensures your team has immediate access to proven solutions when they need them most.
For details, see Problems app.
Feature updates
Infrastructure Observability
Investigate problems quickly with built-in problem investigation journeys
Investigating detected problems in your environment is now much easier and more streamlined with problem-specific drilldowns in the respective domain applications in Dynatrace. In the domain applications, you can hover over the health alert chips and select Investigate problem. As a result, all relevant telemetry of the health alert is put into focus and you’re guided to the root cause quickly.
- In
 Services, you can investigate problems on the golden signals of your microservices. This has been available since Dynatrace version 1.318.
 - In
") Kubernetes, you can investigate problems on the Kubernetes platform such as resource shortages or failing pods.
Kubernetes, you can investigate problems on the Kubernetes platform such as resource shortages or failing pods. - In
 Infrastructure & Operations, you can investigate health issues with hosts and processes.
 - In
 Databases, you can investigate problems about performance and availability of your databases.
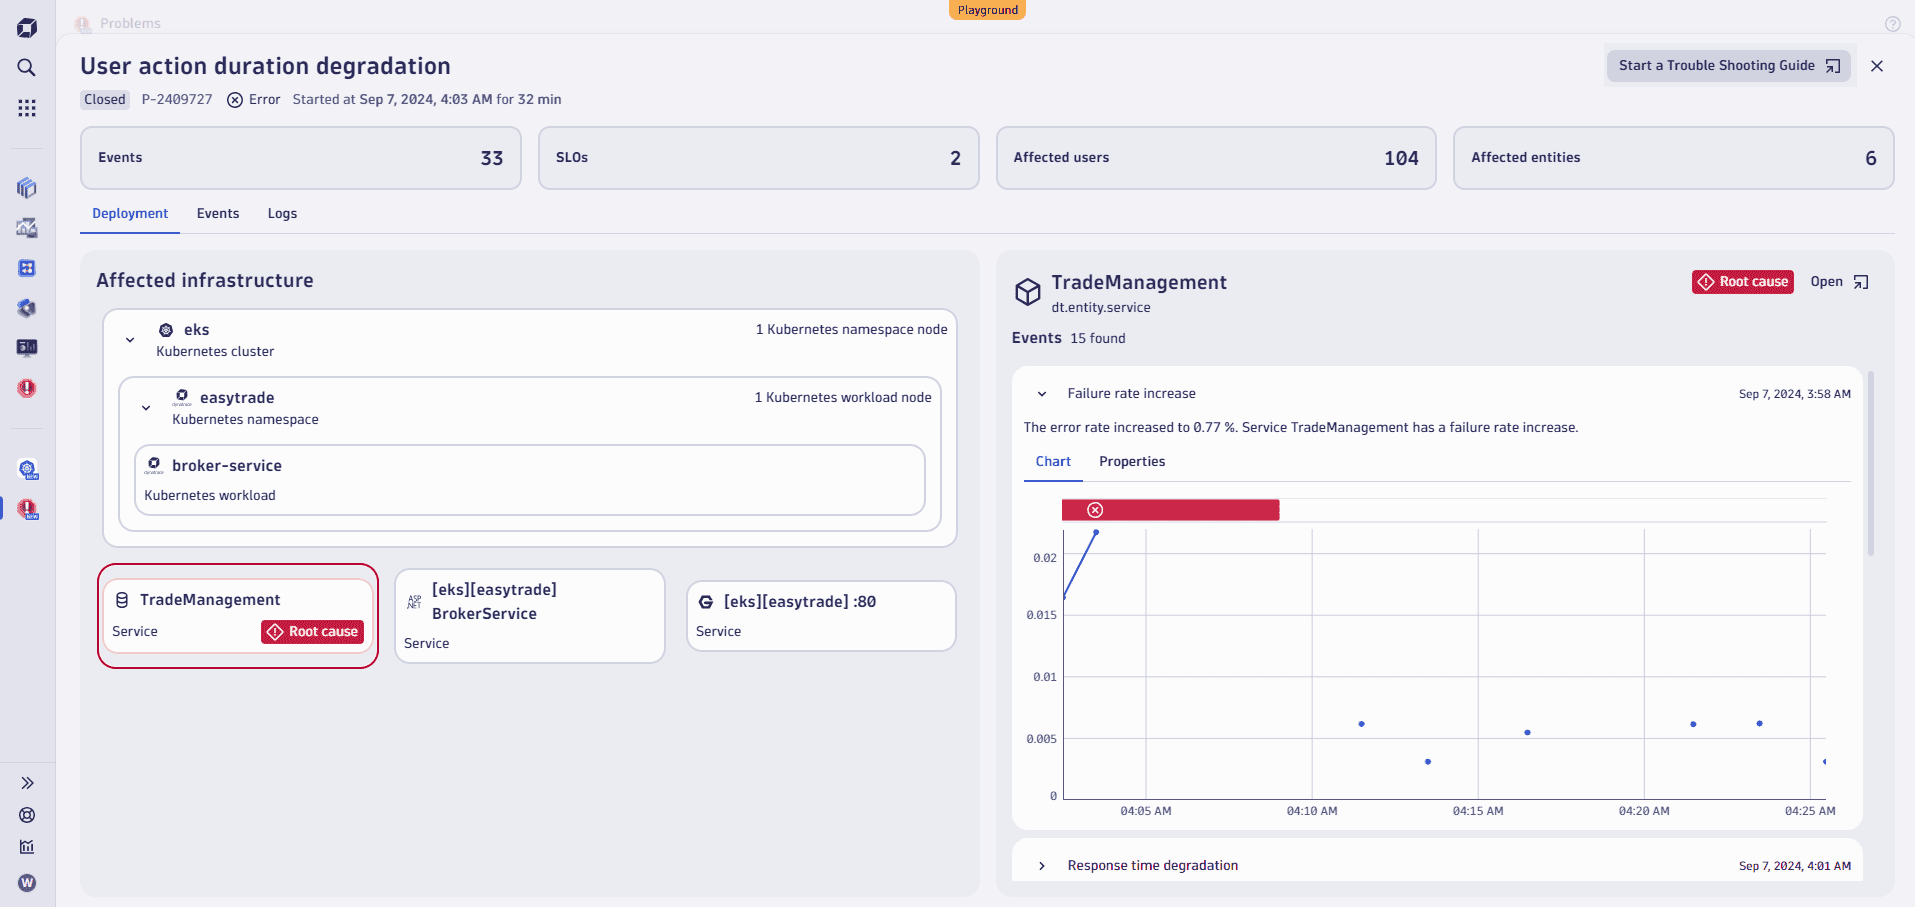
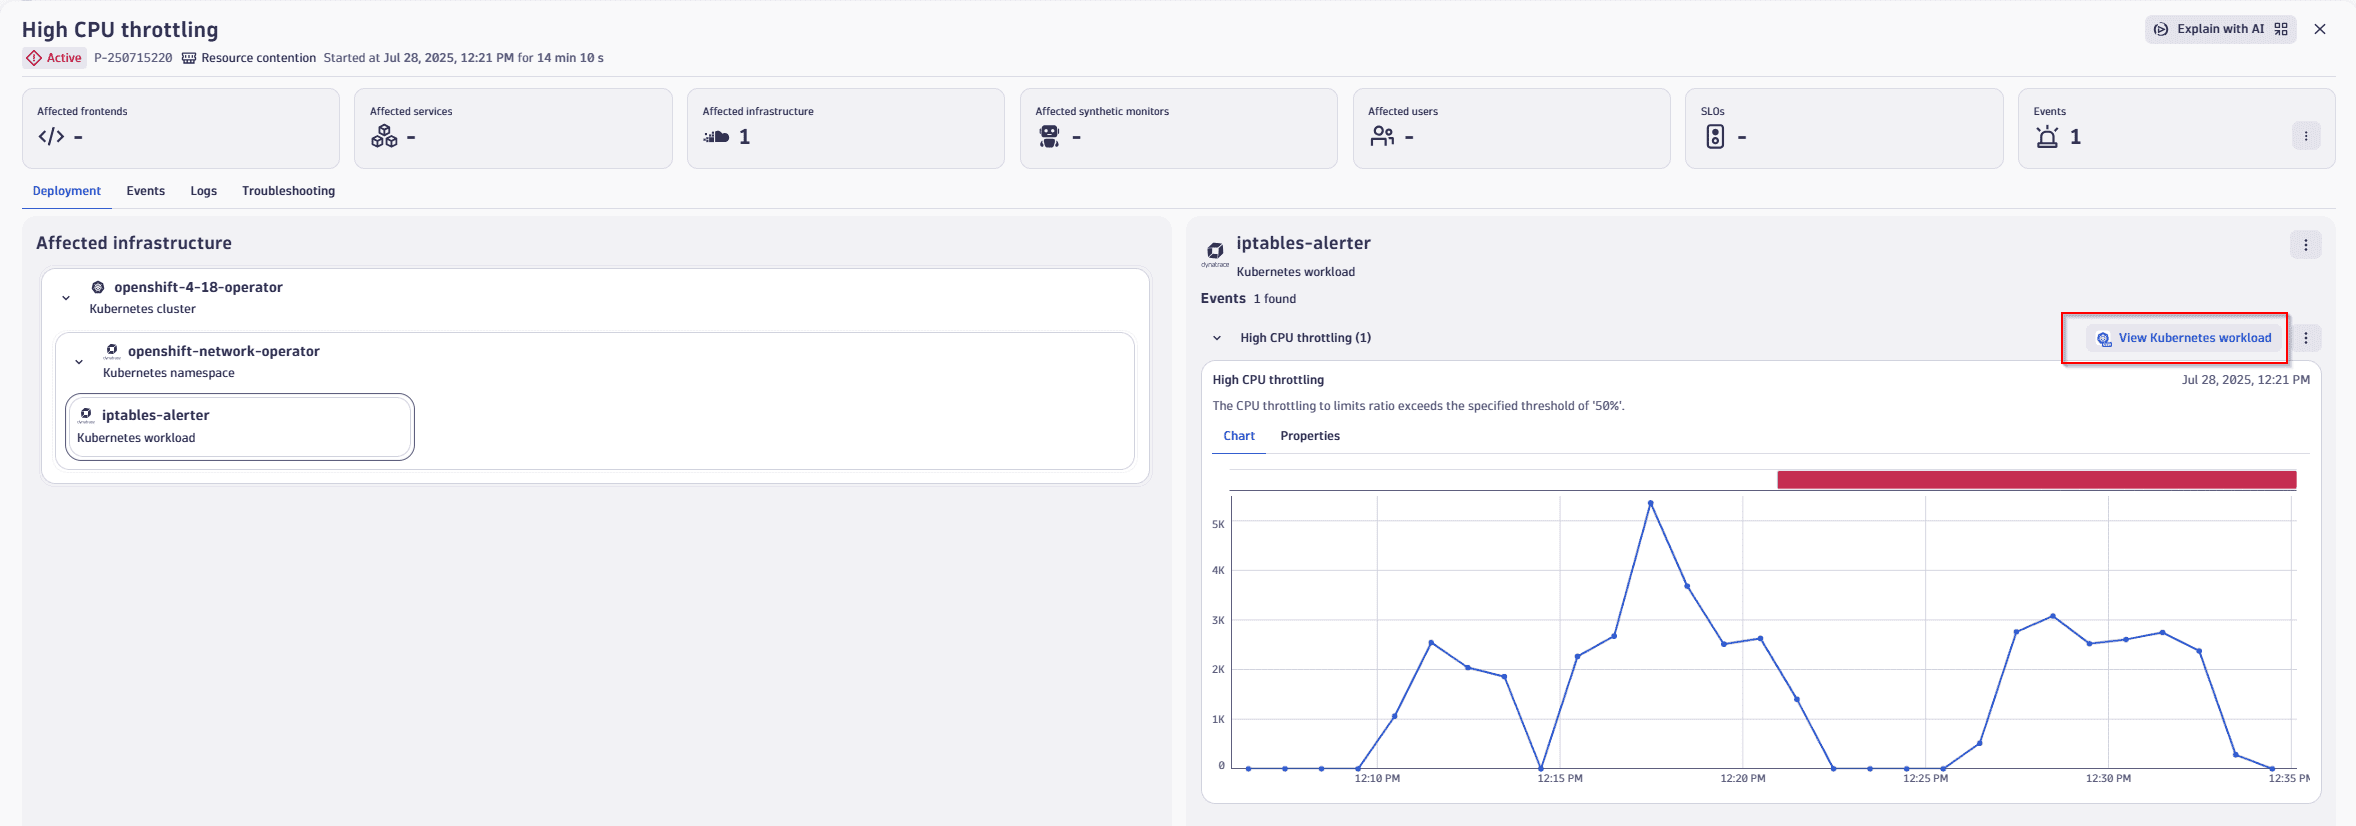
In  Problems, you can directly start the problem investigation with the right drill-downs by using the View … button. This will direct you to the right domain application and put the relevant telemetry data in the app into focus.
For further information, see Triage, investigate, and remediate incidents in the Problems app.
Application Security | Vulnerabilities
Enhance vulnerability prioritization with CISA KEV insights
 Vulnerabilities now integrates with the CISA KEV catalog, helping you identify threats that have been confirmed as actively exploited.
You can now:
- Filter and sort vulnerabilities by KEV status
- View remediation due dates assigned by CISA, where applicable
For details, see Prioritize by CISA KEV catalog.
Digital Experience | RUM Web
Control loading and execution of the RUM JavaScript with defer and async
To reduce parse-blocking JavaScript, you can now manage how the RUM monitoring code is loaded and executed by using the async or defer attributes. These attributes can be applied to the following snippet formats:
Platform | DQL
Select the buckets from which to fetch data directly in the fetch and timeseries commands
You can now use the bucket parameter in the fetch command and the timeseries command to select the buckets from which to fetch data. The new parameter supports lists of multiple bucket names and pattern matching using wildcards.
With the new syntax, a query such as
fetch logs| filter dt.system.bucket == "default_logs" or startsWith(dt.system.bucket, "logs_365_")...
can be replaced with
fetch logs, bucket:{"default_logs", "logs_365_*"}...
Using bucket filters and the new syntax ensures the best query performance.
For details, see DQL Data source commands: fetch and DQL Metric commands: timeseries.
Platform | Grail
Enrich your queries with lookup tables (Preview)
You can now upload and store your custom lookup data in Grail for enriching observability data in your queries with additional context. The new Resource Store API allows you to manage your lookup data stored in Grail. You can upload and parse various text-based formats—including CSV, JSONL, and XML documents—for storing in a Grail-native format.
In DQL, we are introducing the new load command for retrieving data from your lookup files. You can combine it with commands such as lookup to enrich your data during query time:
fetch spans| lookup [ load "/lookups/http_status_codes" ],sourceField: http.response.status_code,lookupField: code
The preview is available to customers of the latest Dynatrace with DPS licensing. For more information, see Lookup data in Grail.
Application Observability | Distributed Traces
Simplify module download for arm64 Linux via multidistro flavor
You can now use the multidistro flavor to download OneAgent modules for both glibc and musl–based Linux systems on arm64.
This enhancement simplifies deployment by allowing a single API call:
/api/v1/deployment/installer/agent/unix/paas/latest?flavor=multidistro&arch=arm
Previously, separate calls were required for flavor=default and flavor=musl. This change reduces complexity and improves automation workflows.
flavor=default and flavor=musl are still available and can be used indefinitely to reduce OneAgent footprint on disk.
Platform
Sort dimensions alphanumerically in the metric selector
A new optional parameter is available for dimension sorting in the metric selector. The default is lexical, which is the default value and sorts dimension values in lexicographic order; the other available option is natural, which detects digits in a dimension and sorts according to their numeric value.
For details, see Metrics API - Metric selector: Sort transformation.
Platform | Dashboards and Notebooks
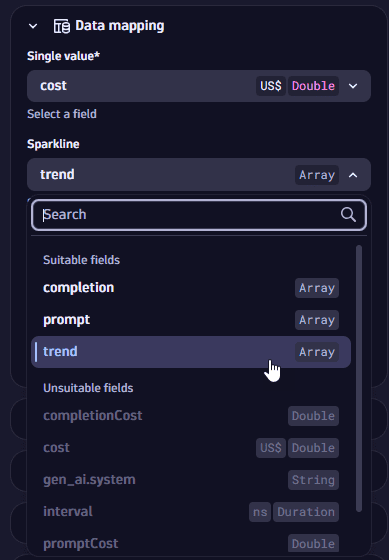
Enhanced data mapping with improved clarity and usability in Dashboards and Notebooks
The Dashboards and Notebooks apps now offer a more intuitive data mapping experience, with enhanced features including:
- Data types and units displayed next to field names
- Fields grouped into
SuitableandUnsuitablecategories - Mandatory fields clearly marked
- Manual selections persisted even if fields become unavailable or unsuitable
Platform | Dashboards
Table settings changes now persist
Changes of column settings (adapting the column width, column sorting, moving columns left/right, hiding columns, and line wrap) are now persisted, even when the Options side panel is closed (view mode).
-
For users with write permissions, these changes are persisted in the document JSON.
-
For users with read-only permissions, the changes are temporary.
Digital Experience
URL structure modernized for JavaScript mapping file APIs
We've deprecated four legacy JavaScript Mapping File APIs and introduced four new ones with a simplified and more consistent URL structure.
What changed
- Old APIs used path parameters to pass values directly in the URL path.
- New APIs now use query parameters, making them easier to construct and read.
- Functionality remains unchanged - only the way parameters are passed has been updated.
New endpoints
| Operation | Old Endpoint | New Endpoint |
|---|---|---|
GET Mapping File |
|
|
PUT Mapping File Content |
|
|
PUT Metadata |
|
|
DELETE Mapping File |
|
|
Platform | OpenPipeline
Metric extraction from Real User Monitoring data now available
Metrics can now be extracted from user.sessions and user.events within OpenPipeline.
Prerequisites: availability of Metrics on Grail DPS capability and Digital Experience DPS capability.
Platform | OpenPipeline
OpenPipeline enriches records with information about the ingest source
All data streams except metrics ingested with OpenPipeline now have their records enriched with a dt.openpipeline.source field containing information about which OpenPipeline ingest source the record originates from.
Platform | Notebooks
Undo/redo functionality added to Notebooks
In addition to versioning, Notebooks now offers Undo and Redo functionality to quickly undo and redo notebook editing changes. This can be very useful when, for example, you run a faulty query and want to revert your changes.
-
The Undo and Redo buttons are in the upper-left of your notebook, in the document header.
 Undo and redo buttons in Notebooks
Note that the
 History button has moved to the left, so you'll find all three buttons in a row.
 -
If you prefer keyboard shortcuts, you can use:
- Undo = Ctrl/Cmd+Z
- Redo = Ctrl/Cmd+Shift+Z
Breaking changes
All
Log ingest via REST API strictly validates request payload size for compressed payloads
Log ingest via REST API now strictly validates the request payload size for compressed payloads.
- Previously, some requests that contained compressed payloads below the size limit of 10 MB, with an uncompressed payload size that exceeded 10 MB, were accepted.
- Now, such requests are rejected with HTTP status code 431. Whether compressed or uncompressed, the payload size must now be below 10 MB.
Fixes and maintenance
Resolved issues in this release
- Added more logging for multi-DC and rack-aware setups. (MGD-5087)
- Kafka headers requested in binary format were sent as a string. Fixed by removing the selection option for BINARY header capturing. (OA-48339)
- Declarative grouping, VMware monitoring, and Process Availability no longer incorrectly accept double parentheses in the condition field. (OA-48636)
- Resolved an issue that caused slow loading of distributed traces in the web UI for on-demand analysis. (MGD-6243)
Dynatrace API
To learn about changes to the Dynatrace API in this release, see Dynatrace API changelog version 1.320.