What's new in Dynatrace SaaS version 1.318
- Release notes
- 10-min read
- Rollout start on Jul 1, 2025
This page showcases new features, changes, and bug fixes in Dynatrace SaaS version 1.318. It contains:
Application Observability | Log Analytics
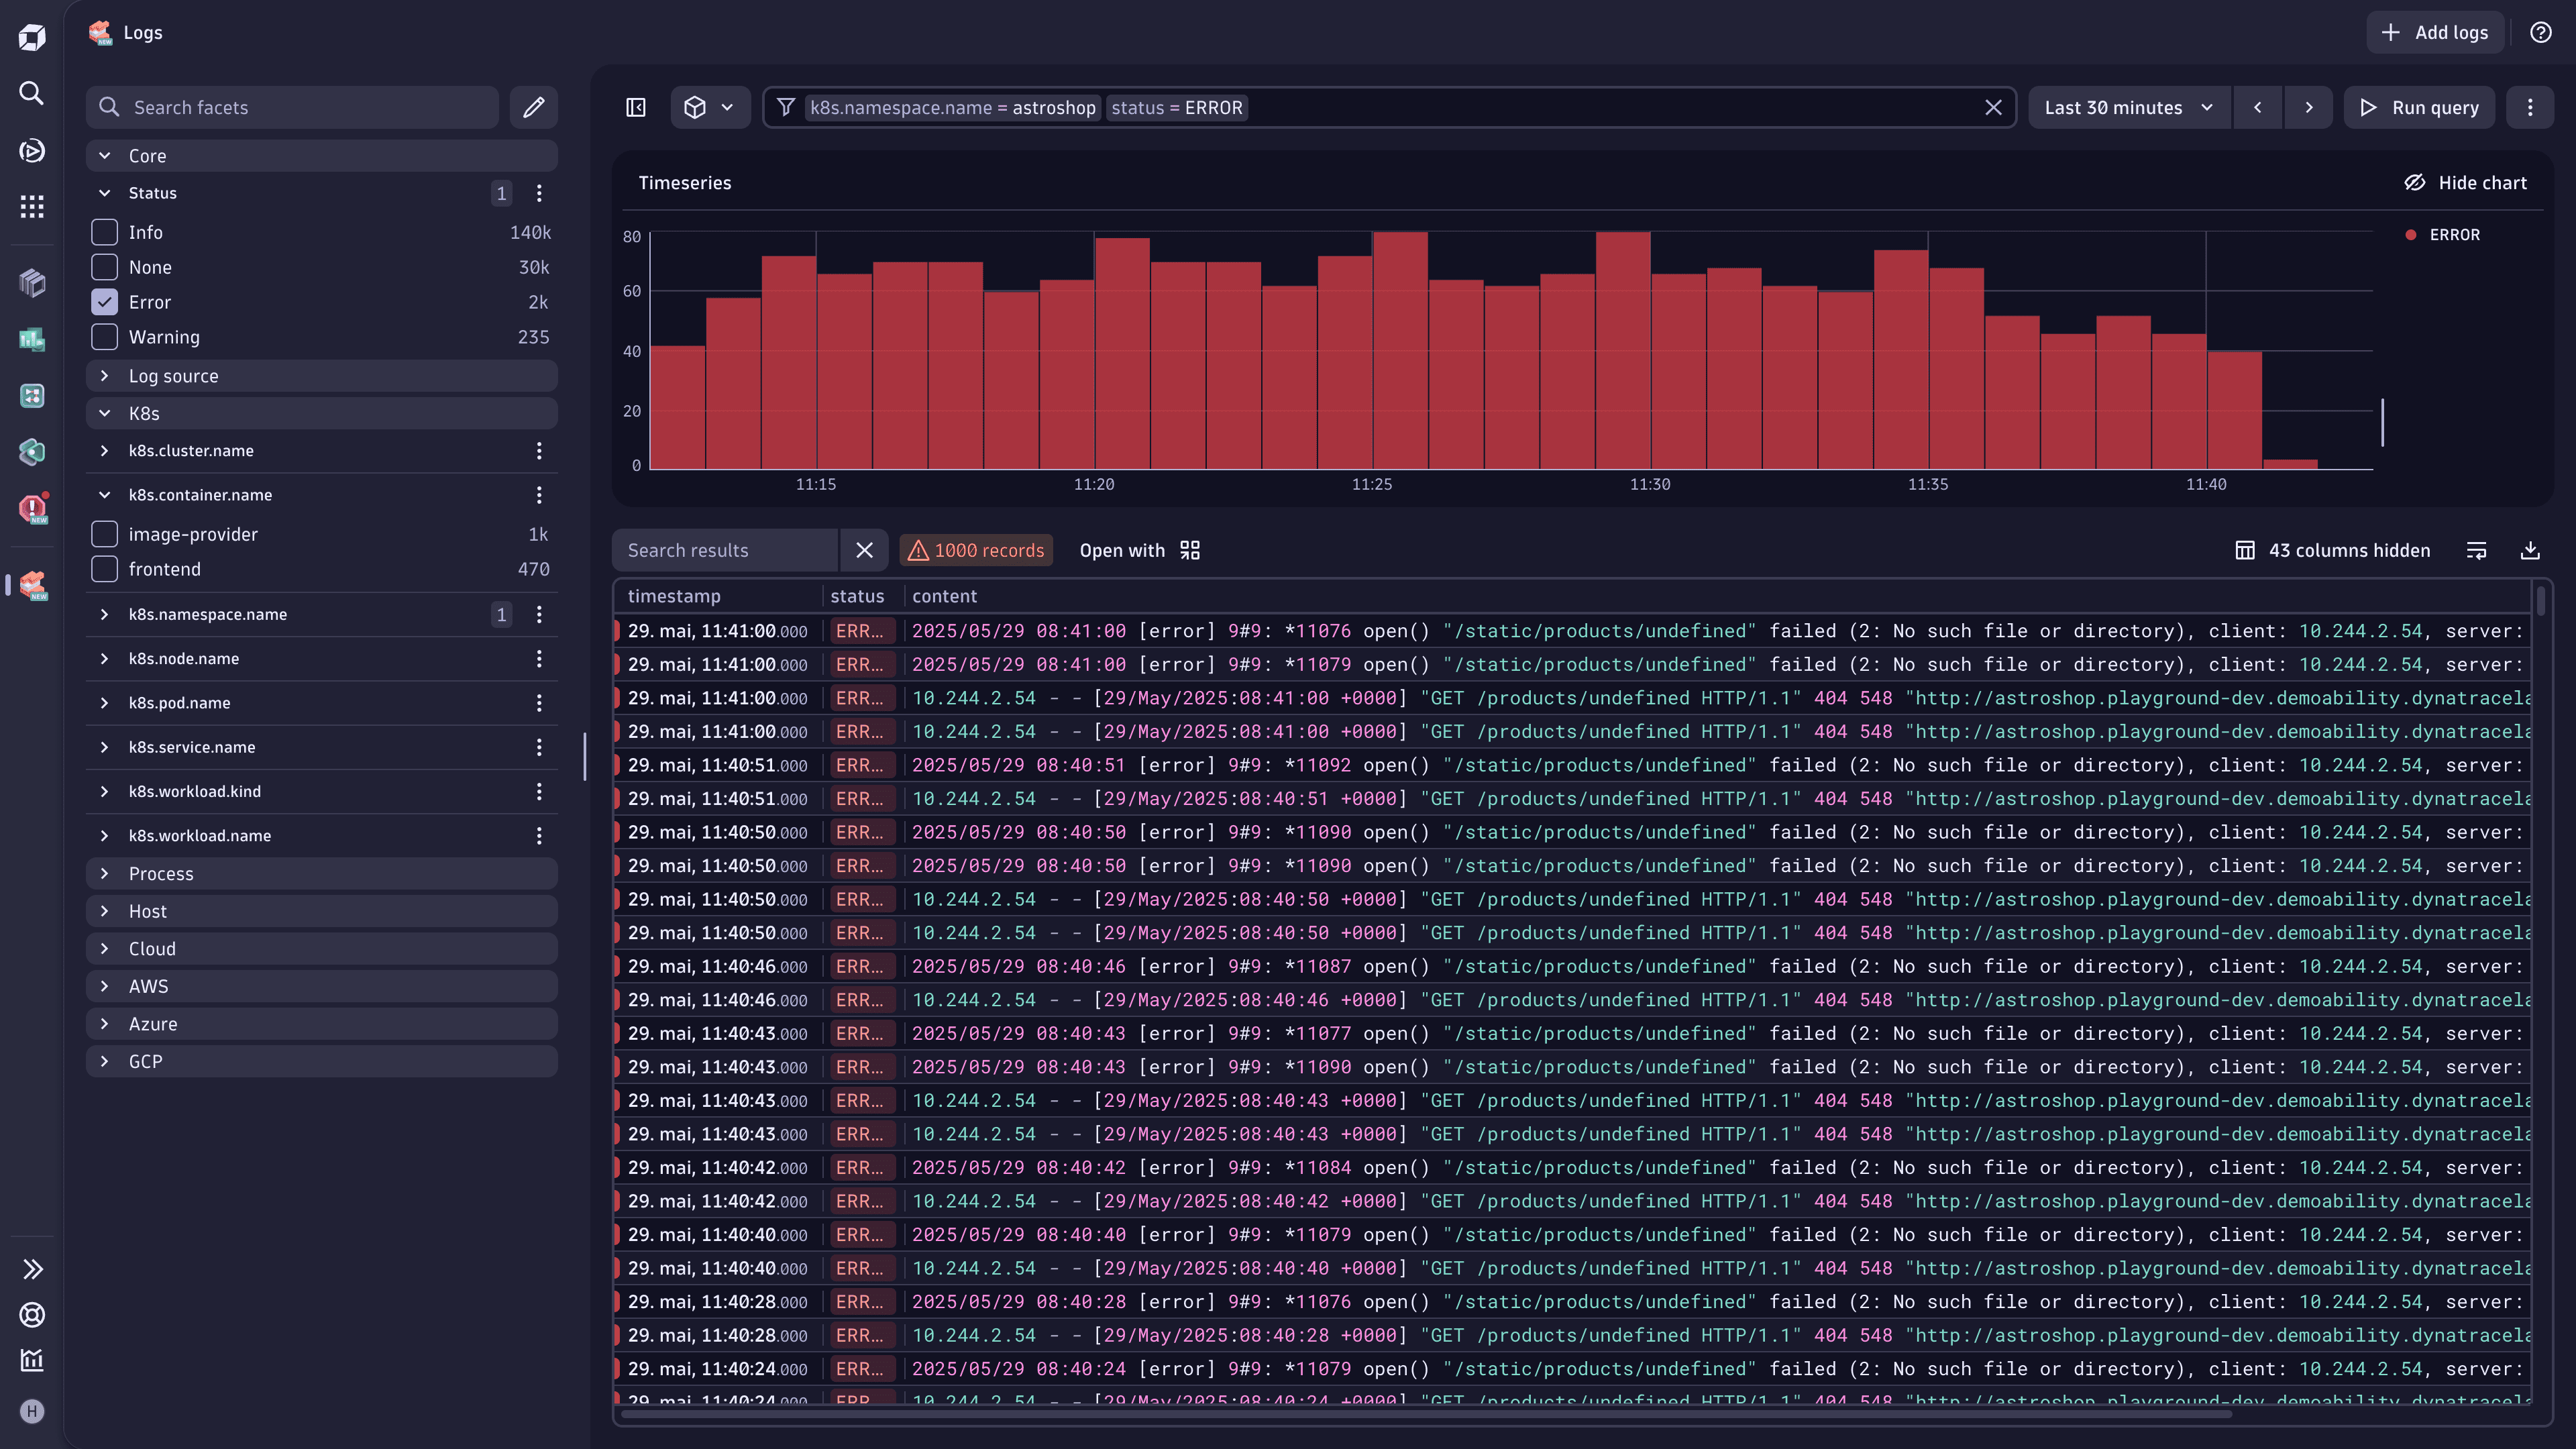
Filter quickly from the sidebar with facets
With the introduction of the sidebar facets, you can now quickly identify and filter the most common attributes. Facets show the grouped attributes by approximate quantity. They work seamlessly in combination with other filters, such as segments and the filter bar.
Feature updates
Software Delivery | Ecosystem
Formatting for email readability
Emails sent through a workflow automation can now be formatted for better readability. See the documentation for the list of supported styles and syntax:
Platform
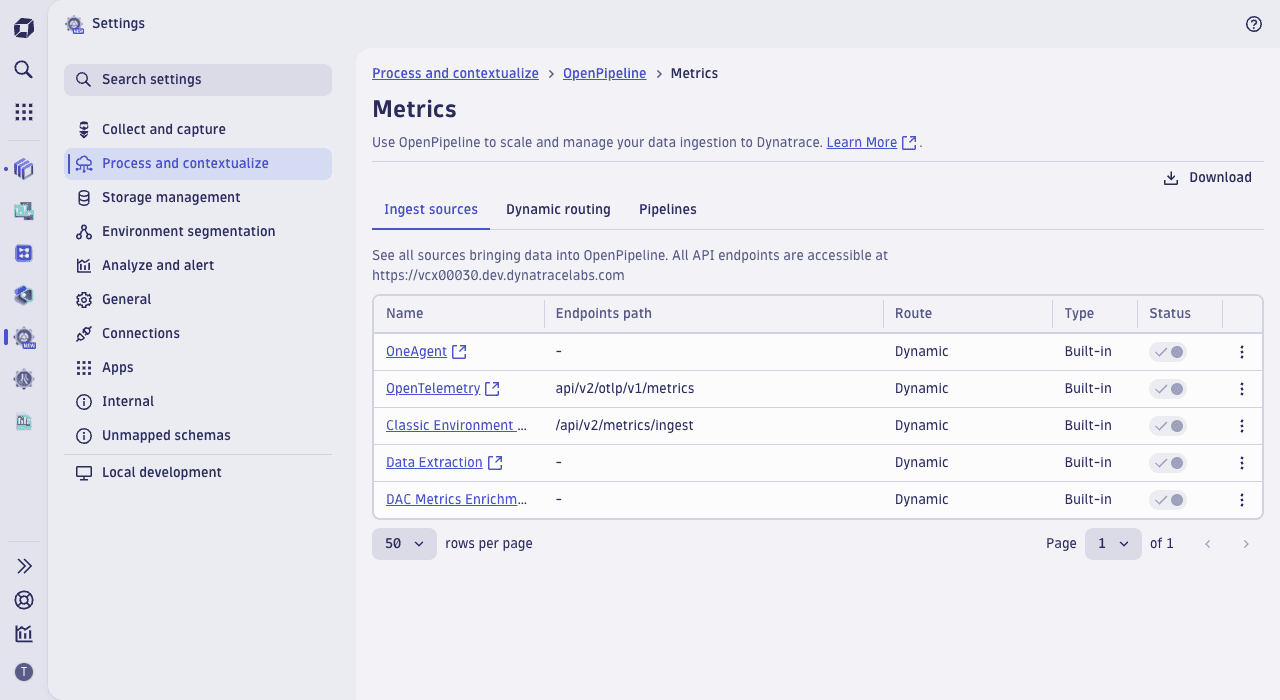
Process and enrich your metrics with additional context at ingest
You can now process and transform your metrics in OpenPipeline, whether they originate from OneAgent or custom sources, or are extracted from logs and spans.
- This allows for renaming fields, adjusting values, and adding attributes to make metrics more meaningful and accessible for different audiences. You can tailor naming, units, and metadata to align with your organization’s structure and terminology, improving clarity and usability across analytics and dashboards.
- By assigning a security context, you can enforce fine-grained, record-level access control, helping you restrict sensitive KPIs or expose just the right data to each team.
Platform
Inspect pipeline configurations in read-only mode
OpenPipeline now allows read-only access, so you can explore built-in pipelines and inspect processor details even if you don't have write permissions.
- With full visibility into pipeline configurations, you can understand how your data is transformed, building trust in data accuracy.
- When issues arise, you can help trace data flows through processors to identify problems like dropped records, misconfigurations, or missing values.
Application Observability | Services
Improved problem investigation
We have streamlined the problem investigation process:
-
In
 Problems, you can now investigate problems more easily via the Analyze Failures or View Service actions.
 -
In
 Services, you can start investigation of a problem by hovering over a health alert chip and selecting Investigate problem in the context menu. As a result, all relevant telemetry of the health alert is put into focus and you are guided to the root cause quickly.
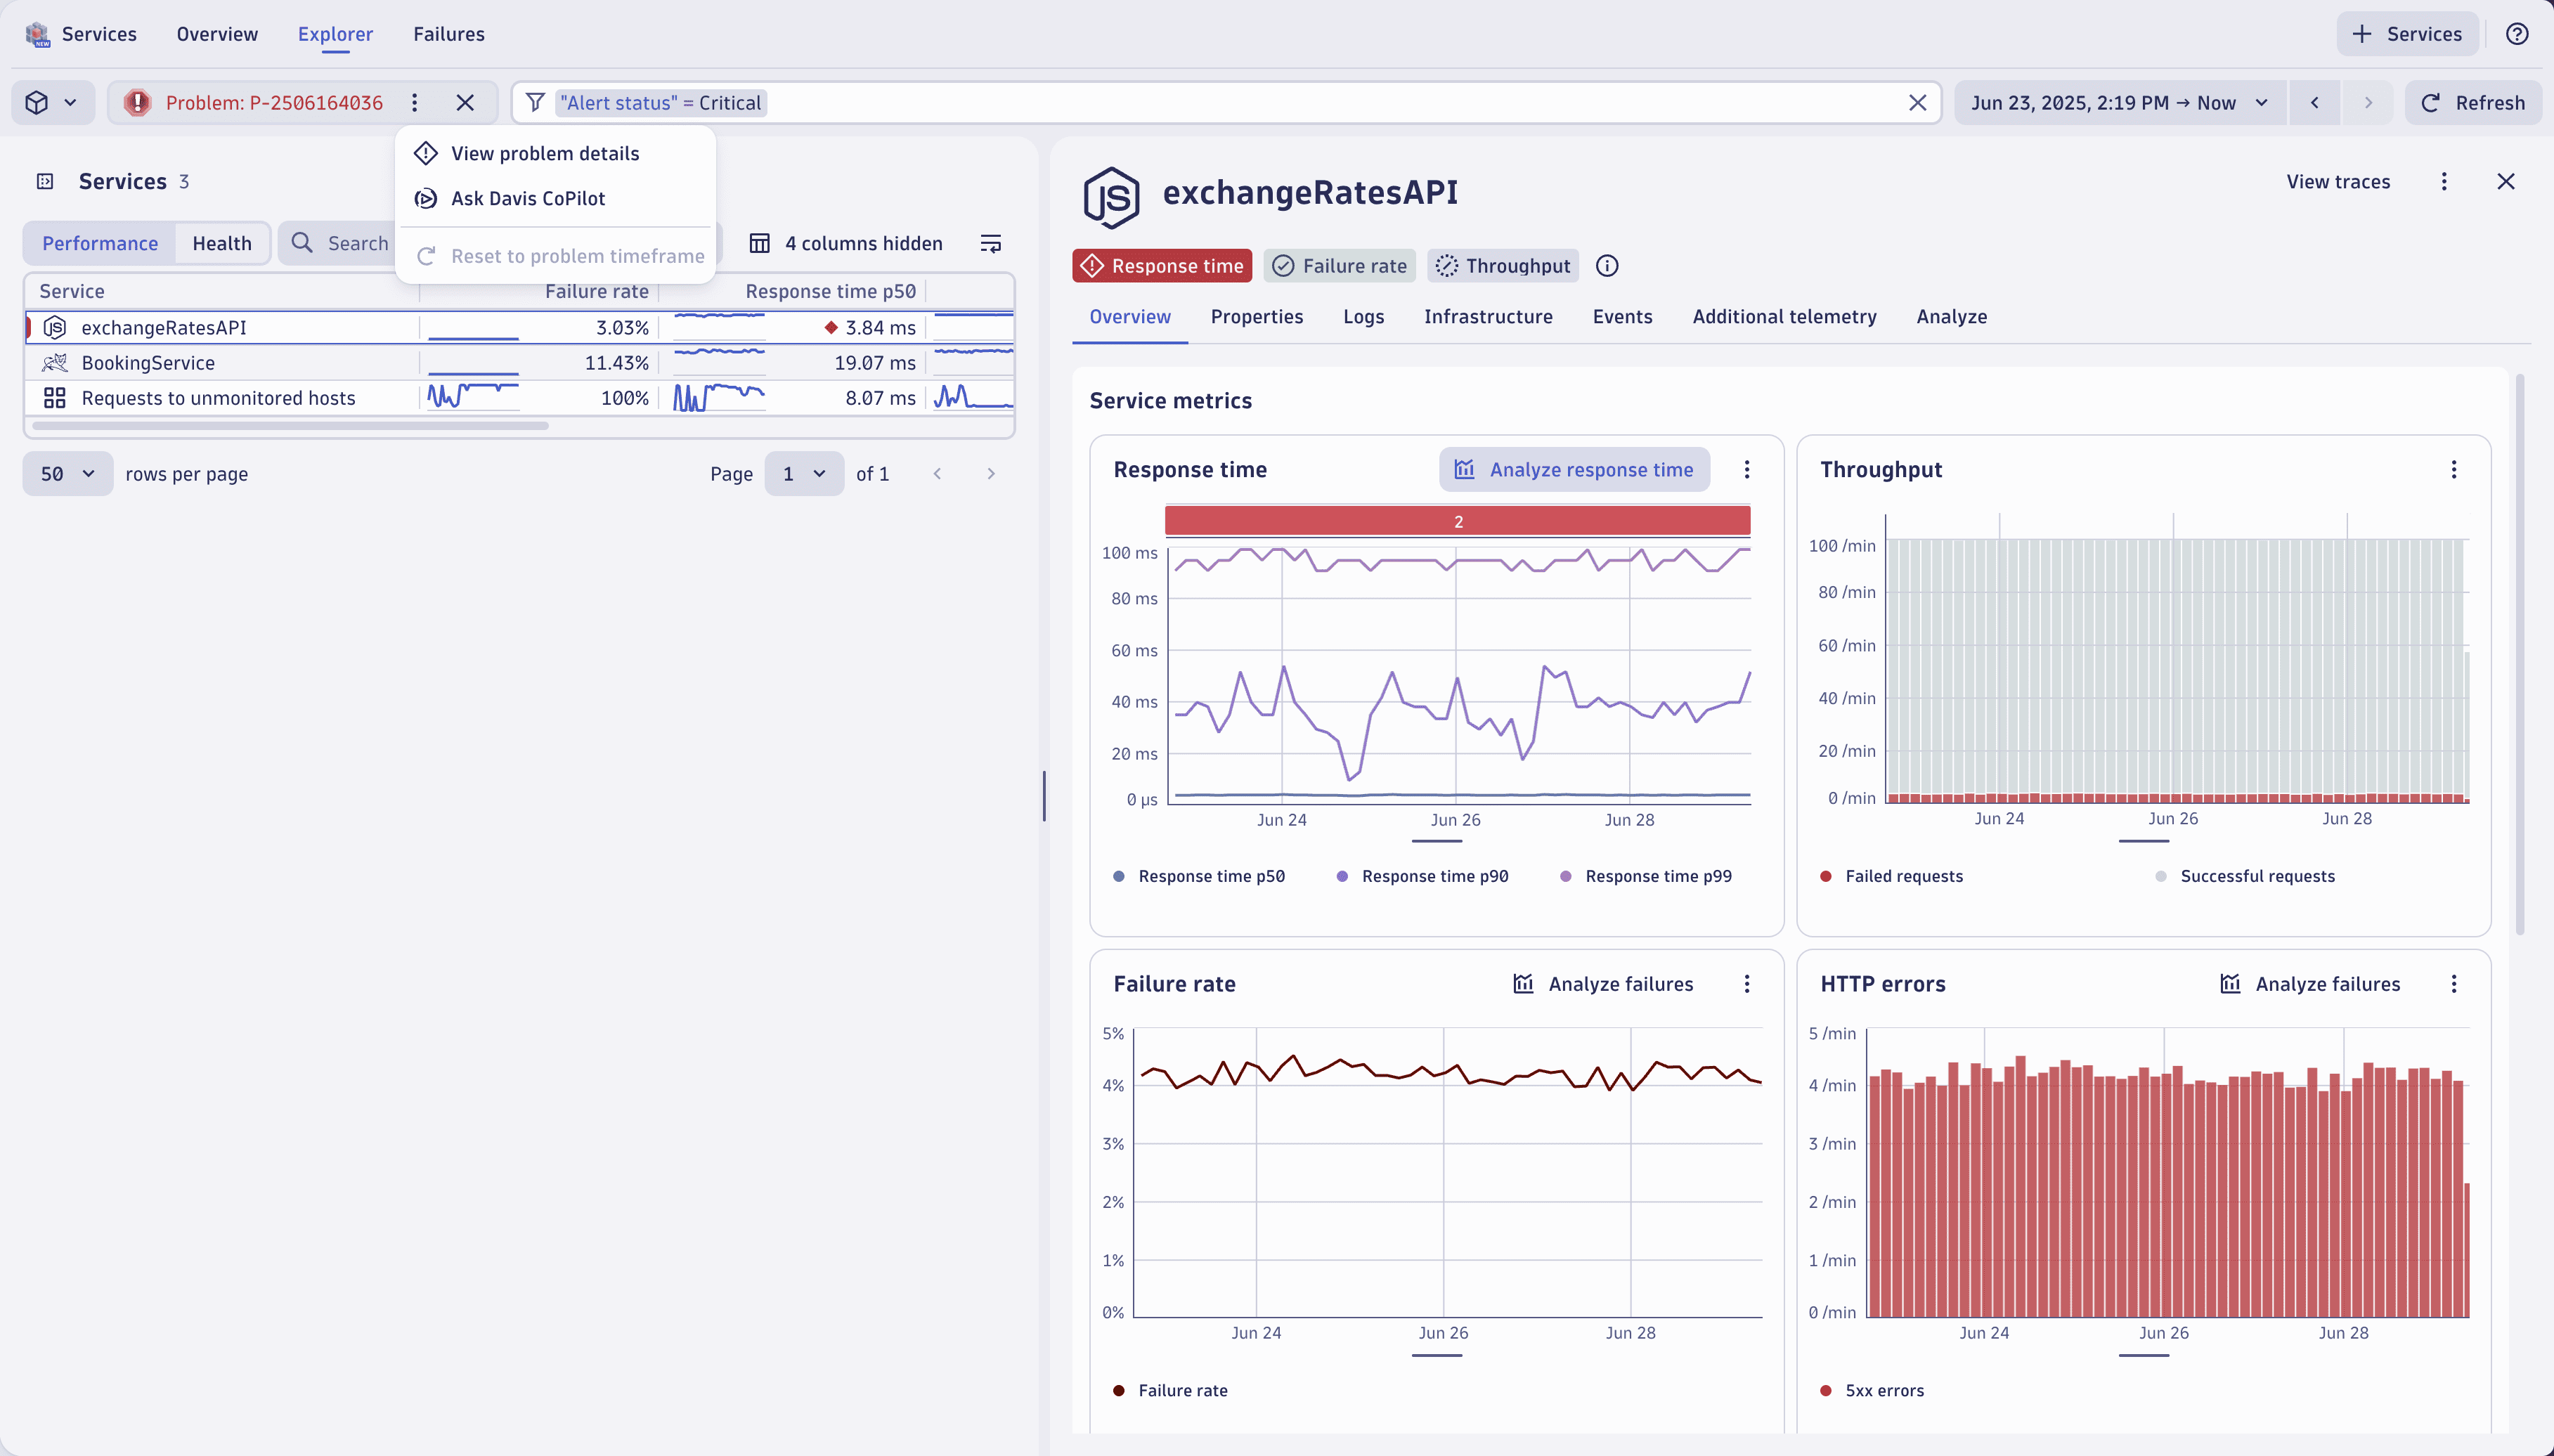 Improved Problem investigation
Platform | Davis
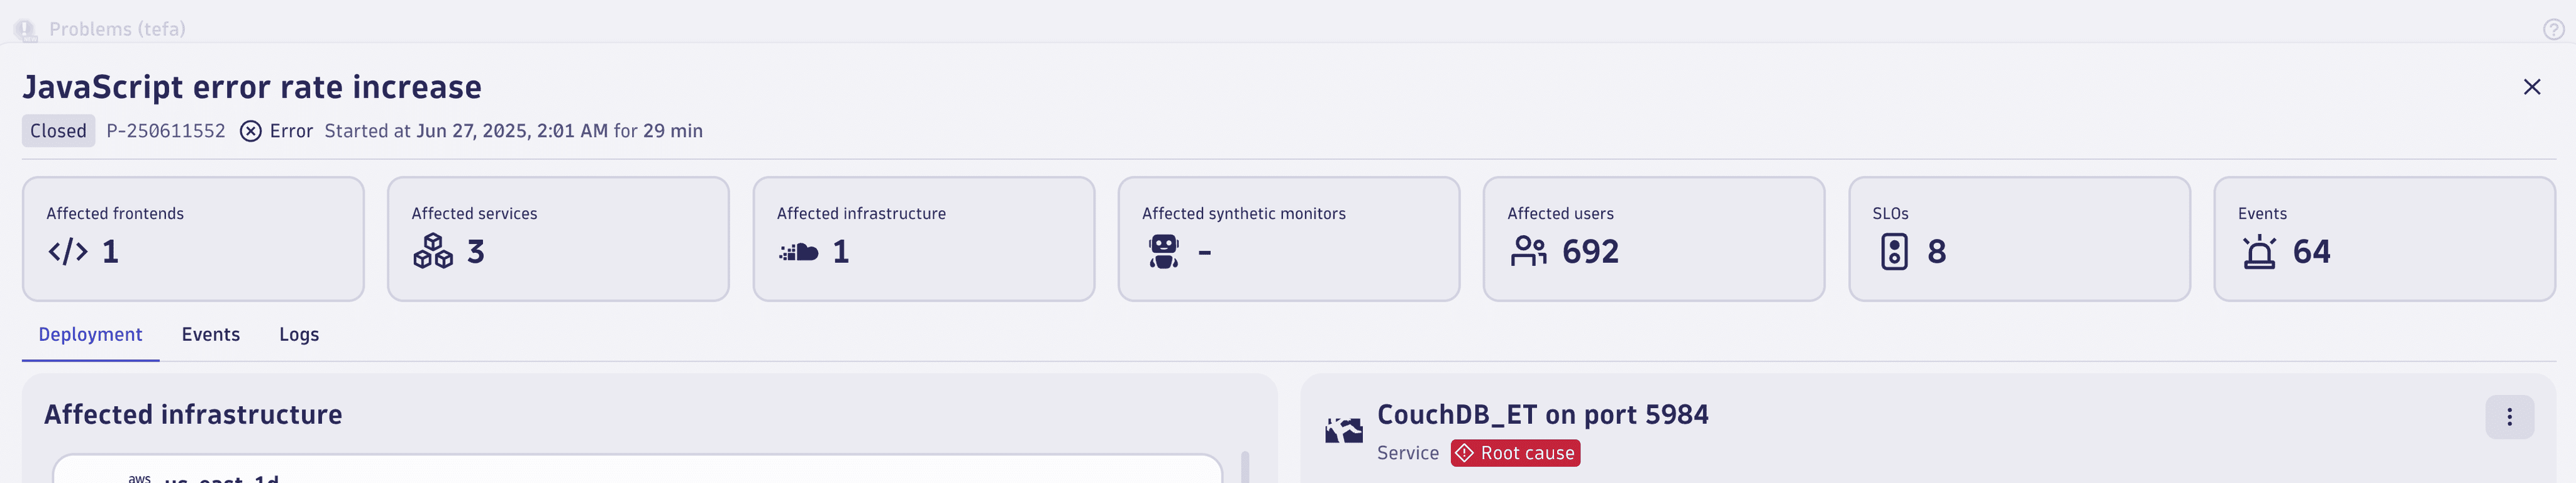
Improved problem incident header
The problem incident header now directly shows the number of front-end applications and services that are affected by an incident, and offers a direct drilldown for the affected entities. The header now also offers a more visual way of showing the different categories of affected entities, such as applications, services, infrastructure components, and real users.
Platform | Davis
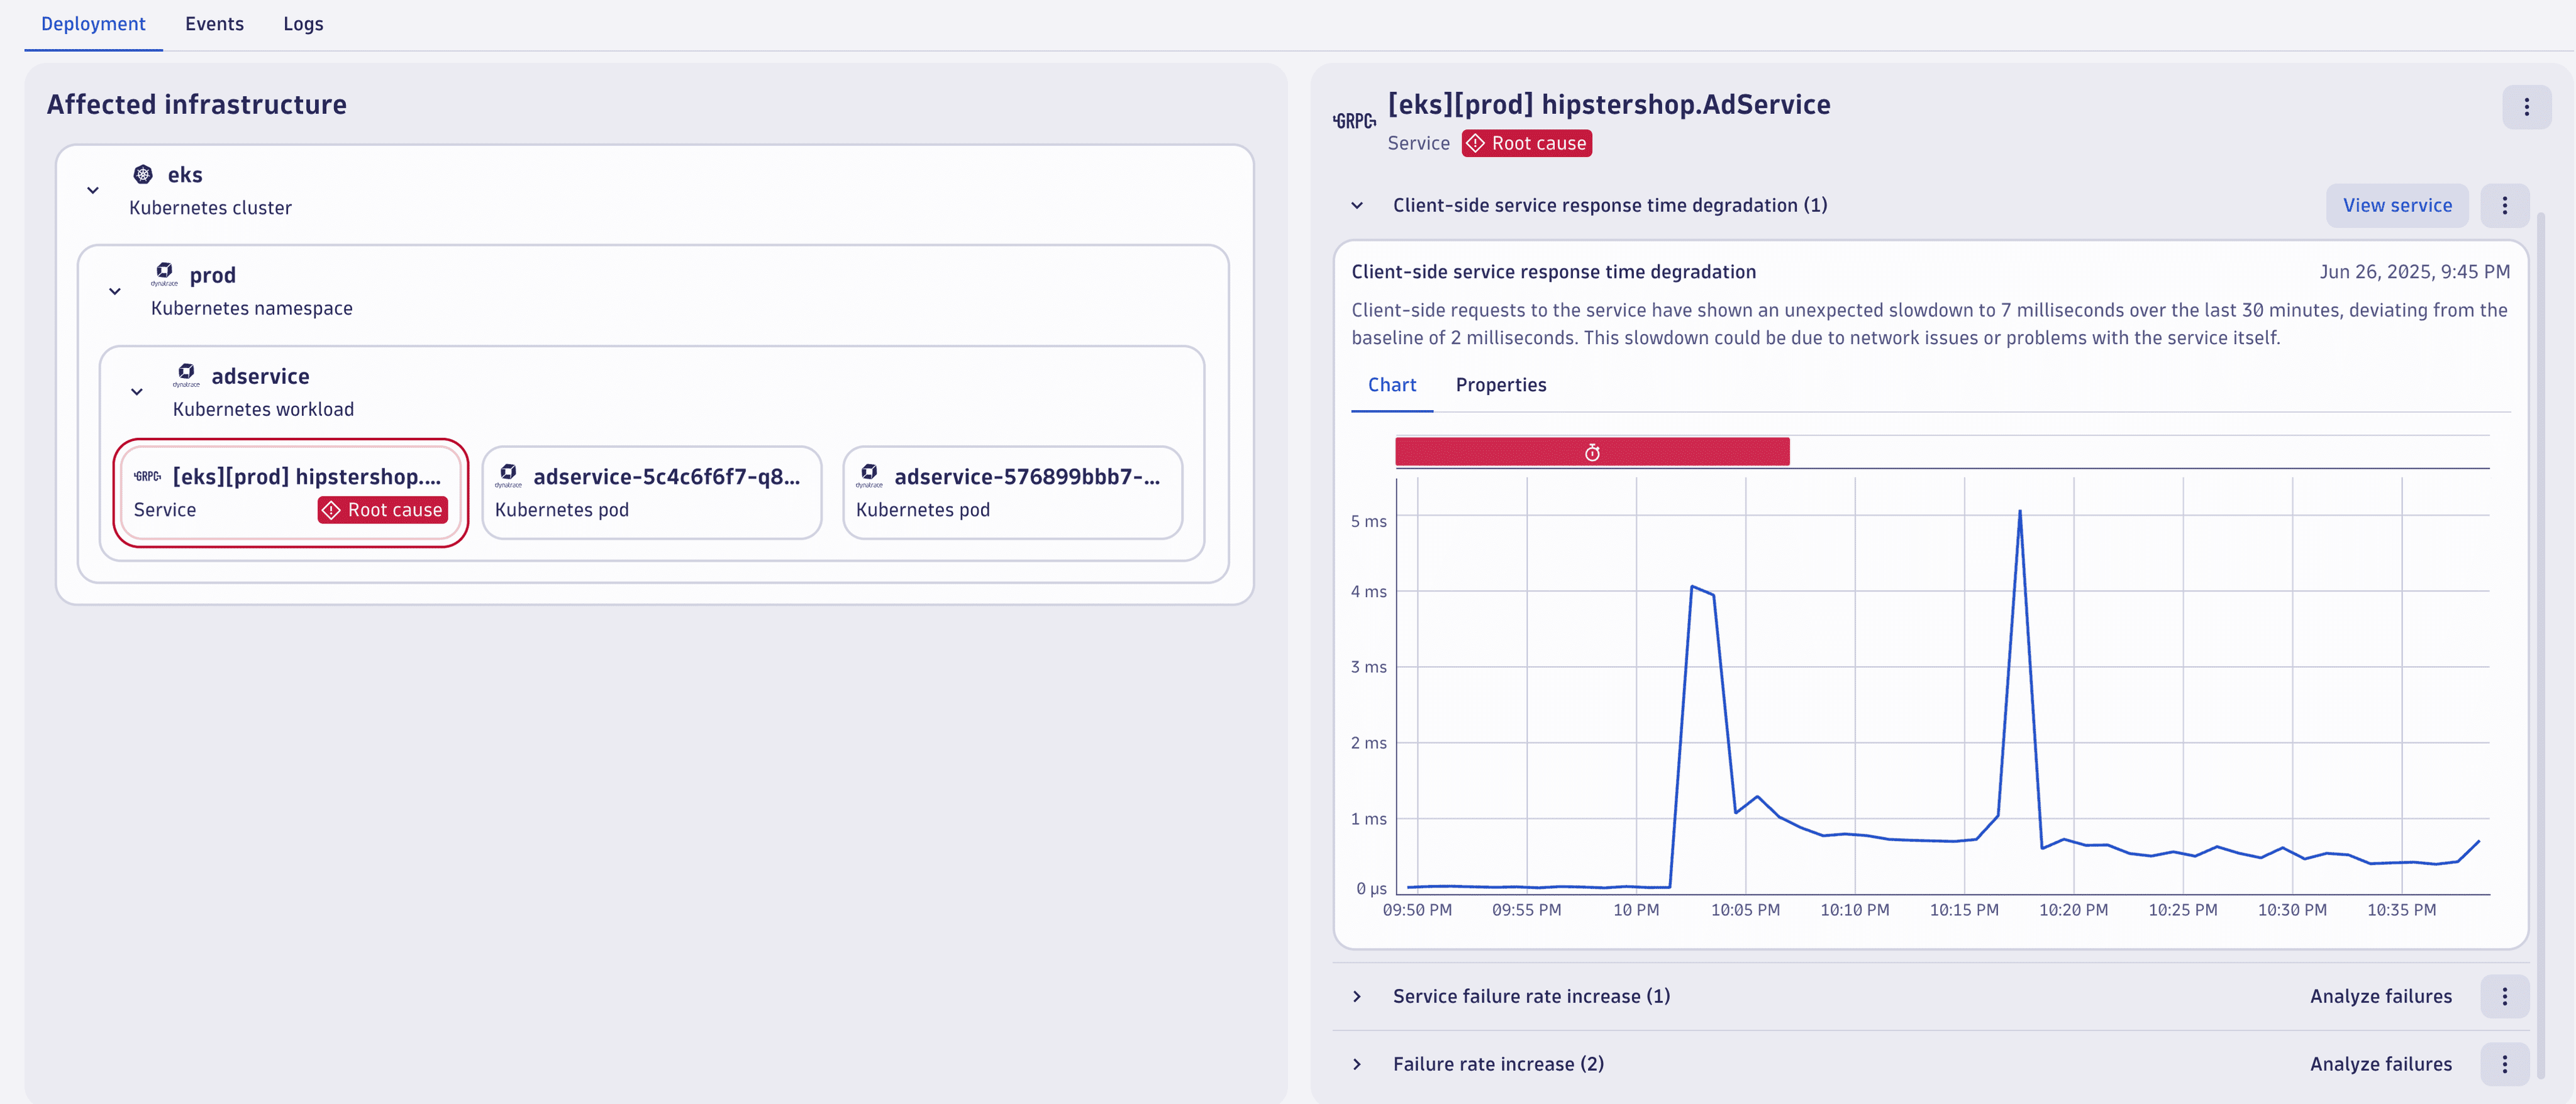
Enhanced Kubernetes deployment diagram
Problems now shows an enhanced Kubernetes deployment architecture diagram with the root-cause component clearly marked and highlighted by the root-cause detection model.
- Ephemeral components were removed to allow focus on the services and workloads running an application.
- Events are now grouped by name, streamlining the troubleshooting process by reducing noise and making it easier to identify recurring patterns.
Platform
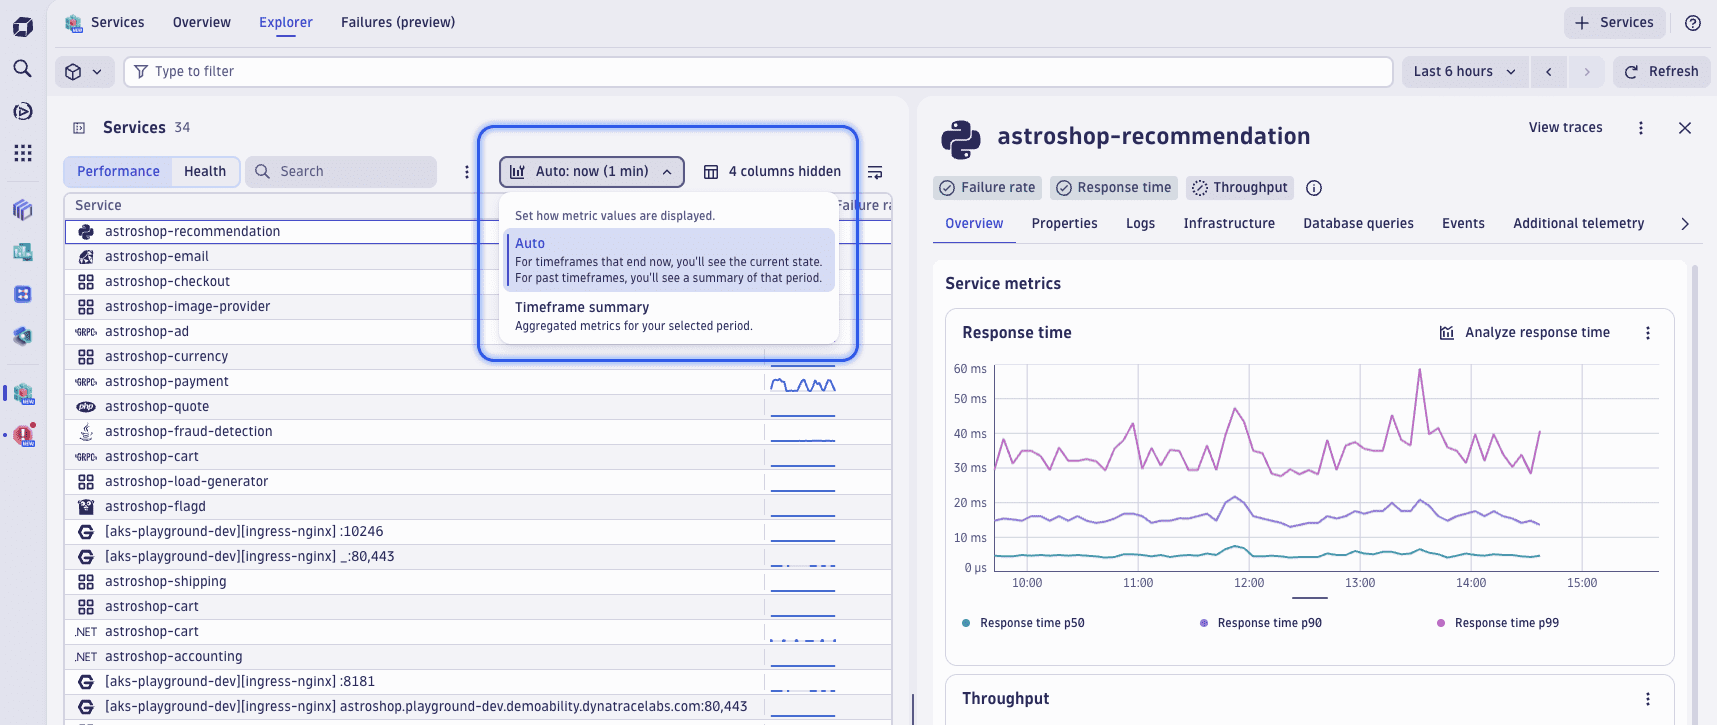
Improved timeframe handling in Observability applications
Many observability apps share a common pattern to filter data via segments and filter bar and to select a timeframe. This has now been standardized and improved to make working with observability telemetry across apps easier and faster.
Additionally, you can now choose between a Now and a Summary state in the observability apps.
- Now of course shows the most current resource and performance metrics.
- Summary shows the metrics aggregated across the whole timeframe, making it more ideal for resource analysis.
Application Observability | Log Analytics
Enhanced filtering possibilities within context menu
The Logs app now offers more filtering options with a context menu from the table and details panel:
- Filtering by
starts withoperator for values longer than 100 characters - Filtering by
greater thanandless thanoperators for numerical values - Removal already used filters
- Support for filtering for values that don't exist in the record
Application Observability | Services
Additional dimensions for calculated service metrics in Grail
The following two additional placeholders used in the Dimension value pattern are now also mapped to distinct dimension keys in Grail:
- IMS:ProgramName
ims.execution.transaction.psb_name - IMS:UserId
ims.message.transaction.user_id
Application Observability | Log Analytics
Added extended records limit in table
You can now retrieve up to 50,000 log records using the limit command in advanced DQL mode. This enhancement gives you more flexibility and visibility when analyzing large volumes of log data.
Software Delivery
Log ingest API now supports JSON Lines format
SaaS version 1.318+ ActiveGate version 1.319+
The Log Ingest API endpoint /logs/ingest now supports the JSON Lines format. The following commonly used JSONL mime types are supported:
application/jsonlapplication/jsonlinesapplication/jsonlines+jsonapplication/x-ndjsonapplication/x-jsonlines
Infrastructure Observability
Nettracer, Availability, and Disk Extension metrics are now fully enriched
Nettracer, Host Availability, Process Availability, and Disk Device Extensions metrics will now be sent via a mintv2 message instead of being forwarded from a pre-existing mintv1 message. As a result, it's now possible to enrich them with all host- and process-level resource attributes available.
Digital Experience | Synthetic
Deprecation and replacement of Location and Node health status metrics
We have deprecated the following Location and Node health status metrics and replaced them with the new self-monitoring metrics.
Classic Dynatrace
| Deprecated Metric | Replacement Metric |
|---|---|
builtin:synthetic.location.health_status | dsfm:synthetic.location.health_status |
builtin:synthetic.location.node.component.healthStatus | dsfm:synthetic.location.node.component.health_status |
Latest Dynatrace
| Deprecated Metric | Replacement Metric |
|---|---|
dt.synthetic.location.health_status | dt.sfm.synthetic.location.health_status |
dt.synthetic.location.node.component.health_status | dt.sfm.synthetic.location.node.component.health_status |
Platform | Account Management
Environment notifications to be replaced by centralized incident updates
Starting with Dynatrace version 1.322, Environment Notifications in Account Management will be deprecated.
To ensure more streamlined and resilient communication, all incident-related updates will be centralized through Health Status.
This change provides:
- Simplified access to incident notifications
- Greater control over notification channels
- Improved reliability, independent of the Dynatrace infrastructure
We encourage all users to visit Health Status and subscribe to updates before the release of Dynatrace version 1.322.
Platform | Dashboards and Notebooks
Explore security events in Dashboards and Notebooks
You can now explore security events in the  Dashboards and
  Notebooks apps.
To try it out
- In Dashboards or Notebooks, create a new dashboard or notebook.
- Select > Security events.
- Select Run to see a table of security events.
For more about your data exploration options in Dashboards and Notebooks, see Explore data.
Breaking changes
Platform
Creating Kubernetes Operator support archives now requires --stdout
Support archives can now only be retrieved using the --stdout command line parameter.
-
Storing them on the pod file system and copying from there using
kubectl cpis no longer supported. -
The
--stdoutparameter is now mandatory. Not using it will result in an error message.The benefit of this change is the removal of dependency on the tar package in the Kubernetes Operator image, and hence, less potential for vulnerabilities.
Note: Windows PowerShell does not support
--stdout. If you need to use this in Windows, use acmd.exeterminal.
Fixes and maintenance
Resolved issues in this release
- Resolved a limit propagation issue that caused entity queries to apply query limits even when filters couldn't be fully optimized, leading to false-negative results. (GRAIL-41799)
- Fixed an issue that prevented the correct event trigger type and user from being set. (RSA-24464)
- Fixed a problem that caused certain service pages to show unnecessary tags. (DAQ-7630)
- Fixed an issue where AWS Lambda Function service was showing incorrect properties when the service was linked to multiple entities. (DAQ-6572)
- Resolved an issue with OneAgent messages not being processed cluster-wide due to a locking issue when many OneAgents of a single environment changed monitoring mode at the same time. (PS-34471)
- The OpenPipeline Events ingestion API no longer accepts empty HTTP request bodies. The JSON payload must have a positive length and contain at least one valid JSON object. If these conditions are not met, the server responds with a 400 status code. (PPX-5831)
- Resolved an issue with
settings:objects:readandsettings:objects:writeIAM permissions that caused policy conditions to be ignored when combined with theenvironment:management-zonecondition. (PS-33948) - Resolved a limit propagation bug that caused entity queries to apply query limits even when filters couldn't be fully optimized, leading to false-negative results. (GRAIL-41799)
Dynatrace API
To learn about changes to the Dynatrace API in this release, see Dynatrace API changelog version 1.318.