Dynatrace SaaS release notes version 1.303
Rollout start: Oct 21, 2024
Announcements
Log attribute becomes a content-like field
Infrastructure Observability | Logs
Starting with Dynatrace version 1.305, the log attribute will be treated in a similar way as content, message, payload and body attribute. These attributes are considered a content attribute of the log message.
Action might be required: If there is no content attribute defined for a given log source, the log attribute will be treated as content. If you have any log processing, log metric, and/or log events rules set on the log attribute, you'll need to update your configuration.
This change will ensure data ingested in through the log attribute that exceeds 2.5 KB isn't trimmed and will be accepted up to 256 KB, which is the default content attribute limit in OpenPipeline. For classic log processing pipeline ingestion, the limits are 250 B for any log attribute and 64 kB for content.
New features and enhancements
Cost Allocation: Host Monitoring and Application Security support
Account Management | Cost Management
The new Cost Allocation feature is now available. This feature provides enhanced financial oversight and budget control by allowing you to:
- Integrate Cost Allocation into your existing Dynatrace Platform Subscription (DPS).
- Monitor costs associated with Host Monitoring, Security Protection, and Security Analytics.
- Access detailed documentation for step-by-step guidance on implementing and utilizing Cost Allocation in your environment.
For more information, see Cost Allocation.
One-click email notifications for active problems
Platform | Davis
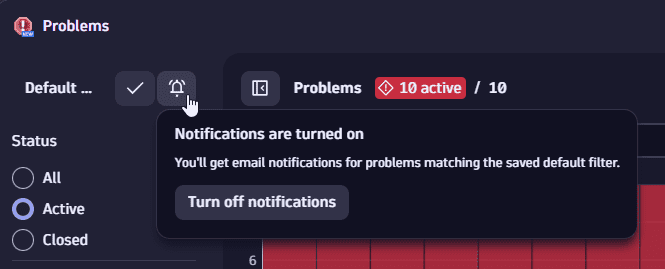
To make it easier for you to receive notifications about active problems, we’ve introduced one-click email notifications in the  Problems app.
- You can set up your own personalized email alerts based on detected issues.
- The default filter is applied to pre-filter all active problems before sending email notifications to your email address.
- This feature is specific to each user and does not affect other users in the same environment.
To set up email notifications for filtered problems using your email address, in  Problems, select the icon.

For details, see Visually notify and automate to speed up remediation.
Dashboards and Notebooks
-
Continuous improvements of visualization options
Platform | Dashboards Platform | Notebooks
In this and future releases, we're extending the customization options of the majority of our data visualizations in both the Dashboards and Notebooks apps. At the same time, we're introducing new unified UI visualization controls across both apps to improve the overall usability of these settings.
Updated DQL functions
Platform | DQL
We added the timezone parameter to the following functions:
We added the locale parameter to the formatTimestamp function.
OpenPipeline: added Drop record processor
Platform | OpenPipeline
With the new Drop record processor (dropProcessor), you can drop an ingested record before it's passed to further stages such as Metric extraction, Data extraction, or Storage. Note that dropped records are not retained.
Kubernetes deployment: additional scopes
Infrastructure Observability | Kubernetes
In addition to the metrics.ingest scope, the data ingest token now includes logs.ingest and openTelemetryTrace.ingest.
-
On the Start monitoring your Kubernetes clusters page, Install Dynatrace Operator section, the Data ingest token > Generate token option creates a token that includes the scopes:
logs.ingestmetrics.ingestopenTelemetryTrace.ingest
-
The Generate access token page now includes template Kubernetes: Data Ingest with the same scopes as above.
-
Previous Dynatrace The Data ingest token generated by the Kubernetes deployment page now contains the same scopes as above.
Tagging worker dashboard (Dashboards Classic)
Previous Dynatrace
The tagging worker process is responsible for assigning tags, management zones, and names to entities based on defined rules. Now you can use the new Tagging worker preset dashboard for Dashboards Classic to:
- Check the runtimes of this worker split for tagging, management zones, and naming rules.
- See the slowest applied rules during the worker run, which is important for scaling rules.
For more about tagging, see Best practices for scaling tagging and management-zone rules.
Service-Level Objectives app
Automations | SLOs
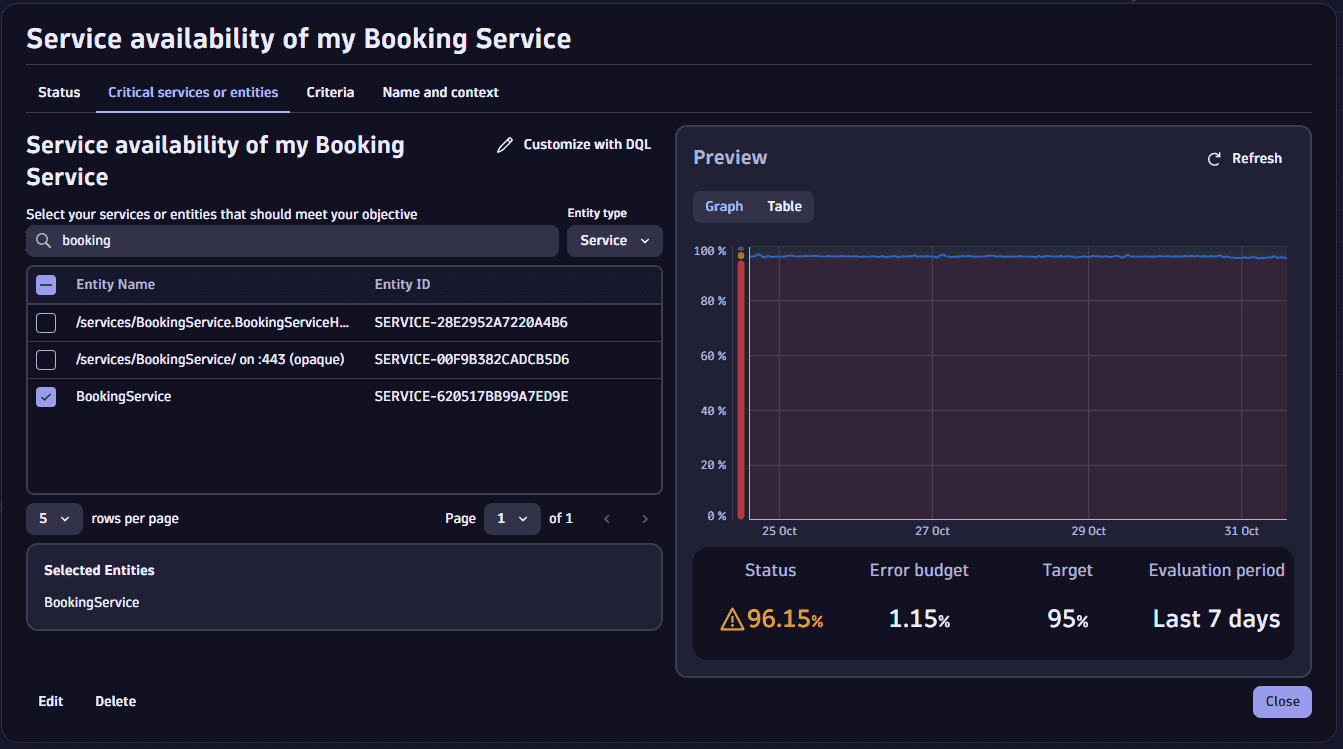
The new ![]() Service-Level Objectives app SLO management functionality is now based on Grail and leverages the next level of flexibility via DQL to define your service-level indicators (SLIs).
Service-Level Objectives app SLO management functionality is now based on Grail and leverages the next level of flexibility via DQL to define your service-level indicators (SLIs).
This release includes a dedicated management table overview and a UI-guided SLO creation wizard with different templates for a head start. But custom DQL can also define the SLI you need independently of whether they're based on metrics, events, or logs.


For details:
- Have a look at the recently published blog post on the new Dynatrace SLO functionalities: SLOs for all data types.
- See the Service-Level Objectives overview documentation.
Please share your feedback in the Dynatrace Community - Feedback channel for the new service-level objectives app.
Services app
Application Observability | Services
Services 
- Enhanced usability, navigation, and onboarding
- Improved Health experience
- New search and filter experience
- Better integration with the Dynatrace Platform. You can seamlessly analyze services in Notebooks, Dashboards, Distributed Tracing, and Kubernetes apps.
- Custom metrics in context for unified services
Services 

Share your feedback in Dynatrace Community!
Distributed Tracing app
Application Observability | Distributed Tracing
We're launching the Distributed Tracing 
- Enhanced data visualization for performance optimization and error analysis, with interactive timeseries and histogram charts that can be integrated in your dashboards.
- Automatic attribute capture and display for both OneAgent and OpenTelemetry ingested spans. In a single dynamic view you can leverage new filtering capabilites, such as facets and the grouping functionality, and analyze traces down to code-level data.
- Query creation and entry point for notebooks.
The previous Dynatrace experience is available side by side and it has been renamed to Distributed Traces (Classic) 
You can discover the Distributed Tracing 
To get started, see Distributed Tracing.
Dynatrace API
To learn about changes to the Dynatrace API in this release, see Dynatrace API changelog version 1.303.
Dynatrace SaaS resolved issues
General Availability (Build 1.303.42)
The 1.303 GA release contains 7 resolved issues.
Dynatrace Cluster
- A unified analysis page will no longer show metric markers for deleted problems. (DI-16748)
- Permissions checks for service extraction is fixed. (TI-14133)
- The `dynakube.yaml` file now uses the latest API version: `dynatrace.com/v1beta2`. (K8S-11176)
- Relationship filters on the Services Classic page now combine multiple values with a logical OR operator. (TI-14422)
- In the dashboard tile "Runtime Application Protection (RAP)" / "Top RAP hosts", incorrect metric `builtin:billing.runtime_vulnerability_analytics.usage_per_host` has been replaced by correct metric `builtin:billing.runtime_application_protection.usage_per_host`. (LIMA-22028)
Infrastructure Monitoring
- Lowered the log verbosity to info. (DOB-917)
User interface
- The OneAgent health heartbeat time format is now correct in the web UI. (TI-14367)