Dynatrace SaaS release notes version 1.294
- Latest Dynatrace
- Release notes
Rollout start: Jun 17, 2024
Want to ask questions or give feedback? Head over to What's New in Dynatrace in the Dynatrace Community.
Product news
- Privacy spotlight: Ensure compliance by hard deleting individual records in Grail
Dynatrace introduces record-level hard deletion to more effectively comply with end-user deletion requests in line with privacy laws. By ensuring only relevant data is efficiently and permanently removed, deletion requests help drive innovation and don’t negatively impact your data quality.
New features and enhancements
New Session Replay extension is available
Digital Experience | Session Replay
A new Session Replay extension is available in the Chrome store: Session Replay browser extension.
The new extension allows proxy loading of resources when replaying a session. This enhances session playback, especially when:
- Font and stylesheet resources are loaded from HTTPS origins
- Resources are loaded from HTTP origins
Improved handling of long-running fetches of requests and traces
Application Observability | Services
To make better use of system resources, we adjusted the handling of a long-running analysis:
- Long-running fetches are visualized better.
- Analysis runs that take too long are stopped.
- Partial results are returned for fetches that have been automatically canceled.
This can reduce the overall load on the Dynatrace system and thus improve performance and system stability.
New preserveFieldsOnFailure and parsingPrerequisite parameters
You can now use the preserveFieldsOnFailure and parsingPrerequisite parameters with the parse command.
New DQL function
Platform | DQL
Now you can include the following functions in your DQL queries:
- exists
Tests if a field exists.
New aggregation functions available to use with DQL timeseries and makeTimeseries commands
Platform | DQL
Now you can use start and end aggregations functions with timeseries and makeTimeseries commands.
Search fields in record list visualization
Platform | Notebooks Platform | Dashboards
The record list visualization now offers a search input in the upper-left corner. This allows you to find and filter for specific field names easily.
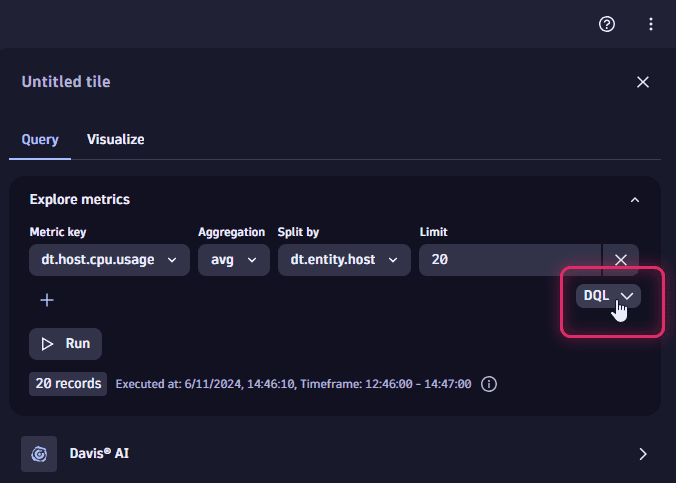
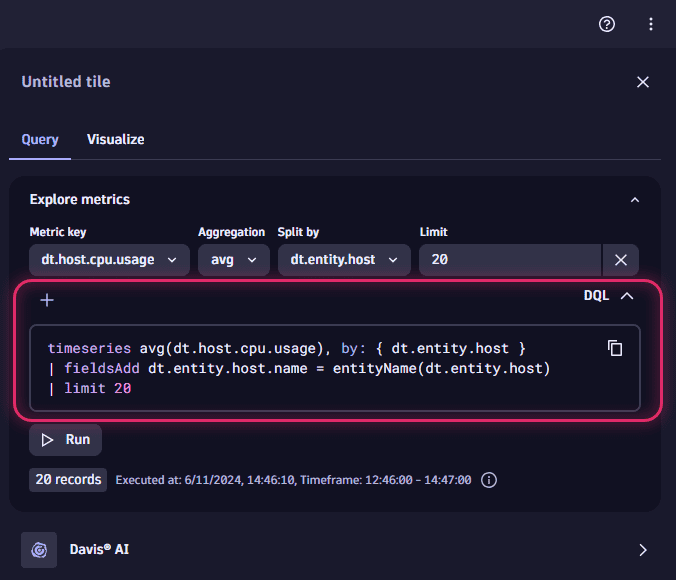
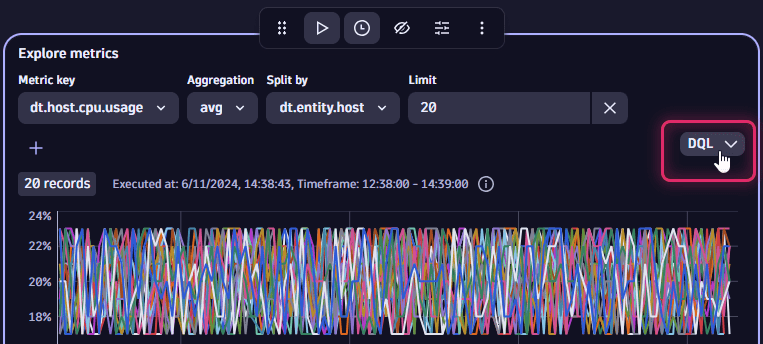
Show DQL query within explore logs and explore metrics
Platform | Notebooks Platform | Dashboards
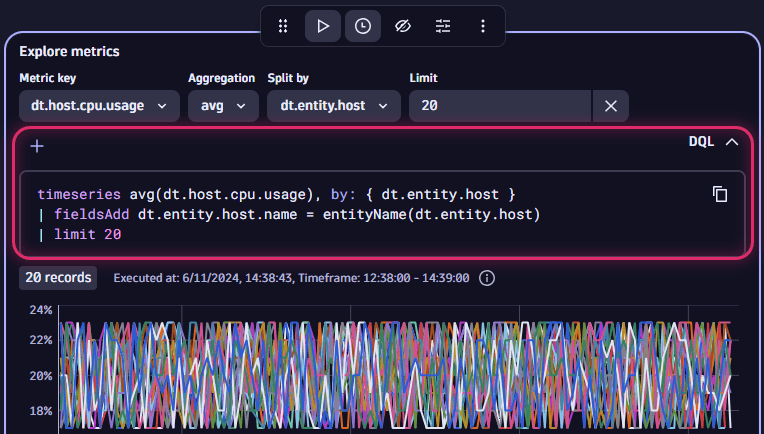
In Explore > Logs and Explore > Metrics, you can now show the underlying DQL query.
Show DQL in Dashboards
Show DQL in Notebooks
Enriched information for software components
Platform | DQL Application Security | Vulnerabilities
Two new software component attributes allow you to query
-
Software component version:
softwareComponentVersion -
Software component file hashes for the Java technology:
softwareComponentFileHashesTo activate the
softwareComponentFileHashesdata, theJava software component hash reportingOneAgent feature needs to be enabled.
Example query:
fetch dt.entity.software_component |fields packageName, softwareComponentVersion, softwareComponentFileHashes
Example result:
{"packageName": "org.yaml:snakeyaml","softwareComponentVersion": "1.23","softwareComponentFileHashes": {"SHA1": "8e08dee1e7527a1e6dee6f227209063383caf4ab"}}
For details on these attributes, see Semantic Dictionary: Software components.
Dynatrace API
To learn about changes to the Dynatrace API in this release, see Dynatrace API changelog version 1.294.
Dynatrace SaaS resolved issues
General Availability (Build 1.294.45)
The 1.294 GA release doesn't contain any user-facing resolved issues.
Update 47 (Build 1.294.47)
This is a cumulative update that contains all previously released updates for the 1.294 release.
Update 52 (Build 1.294.52)
This is a cumulative update that contains all previously released updates for the 1.294 release.
Update 54 (Build 1.294.54)
This cumulative update contains 8 resolved issues and all previously released updates for the 1.294 release.
| Component | Resolved issues |
|---|---|
| Davis | 1 |
| Dynatrace Cluster | 6 |
| Log Monitoring | 1 |
Davis
- It's now possible to see events of problems in Platform apps for problems that are linked to another problem as duplicate. Those problems have the `dt.davis.is_duplicate` flag set to `true`. (DI-14617)
Dynatrace Cluster
- Improved handling of a wildcard in queries for terms with `.` dots inside (like IP addresses). (LOG-7000)
- For 0-duration point-in-time problems, the email notification doesn't stop with 'was open for', but now also reports the duration (0 ms) properly. (DI-14635)
- Fixed a bug that resulted in the creation of Kubernetes service entities without a namespace. (K8S-10030)
- Resolved a problem in which technology tiles on the "Technology overview" page sometimes displayed different instance and process group counts before and after selecting a tile. (HOST-5731)
- Fixed an issue with user session queries containing the DATETIME function combined with MEDIAN, PERCENTILES, or COUNT(DISTINCT) functions. (GRAIL-28503)
- Multiple source entities are no longer being incorrectly extracted from logs. (PPX-2160)
Log Monitoring
- In Logs, on the "Log Viewer" page, when there are more than 100 columns to display in "Advanced mode", table formatting is switched to simple mode for better readability. This applies only to `logs` and not, for example, to `bizevents`. (LOG-7365)