Dynatrace SaaS release notes version 1.256
- Latest Dynatrace
- Release notes
- Published Jan 31, 2020
Rollout start: Dec 6, 2022
New features and enhancements
Support for the Gitlab group endpoint in IssueTracker
Cloud Automation | Release monitoring
For GitLab, when you add an issue-tracking query, you can now enter the /groups API endpoint in the Target URL field to define queries to multiple projects.
More flexibility for muting and unmuting vulnerabilities
Application Security | Vulnerabilities
The Mute button for third-party and code-level vulnerabilities is renamed to Change status.
You can now change the status of a vulnerability by muting, unmuting, or muting it again with a different reason or comment.
New columns for Kubernetes services
Infrastructure Monitoring | Kubernetes
- On the Kubernetes services details page, the Target port name and Target port number columns are merged into Target port.
- On the workload and pod details pages, the Kubernetes services section has a new Ports column.
Schemaless metrics under management zones
Infrastructure Monitoring | Kubernetes
Schemaless built-in metrics are now properly shown under a selected management zone, even without the dimensional rule for metrics.
Meaningful colors for Kubernetes metrics
Infrastructure Monitoring | Kubernetes
Kubernetes metrics now use consistent colors throughout the charts.
Improved Heatmap
The heatmap visualization now offers options for setting thresholds, displaying bucket headings, and showing/hiding a legend.
Extensions 2.0 schema changes
Infrastructure Monitoring | Extensions 2.0
Metric metadata
You can now specify sourceEntityType in the metric metadata.
Unified analysis
- Limits
- Increased actionExpression length to 1500.
- Increased metricSelector length to 1000.
- Increased entitySelectorTemplate length to 500.
- Increased actions list length to 15.
- New cards:
- Metric table
- Injections
- Break line (new line for half-sized cards)
- You can now
- Add card description.
- Display related entity tags in the properties card.
- Set a property as important and display it in the header.
- Exclude charts (summaryChart, detailedChar, and chartAsColumn) from the entities list card.
- Connect data gaps in a chart using linear interpolation.
- Add a sparkline (micro chart) to tables.
For more information on the unified analysis framework, see Extend Dynatrace with domain-specific web UI.
Improved full-trace mechanism for truncated traces
Apps & Microservices | Distributed traces
Search and visibility in the full-trace view have been improved by grouping PurePath® distributed traces of the same trace into a single analysis view and by increasing the number of calls up to 500,000 per distributed trace.
Thread analysis for Node.js
Apps & Microservices | Services
Continuous thread analysis is now available for Node.js. To get started, see Continuous thread analysis for worker threads.
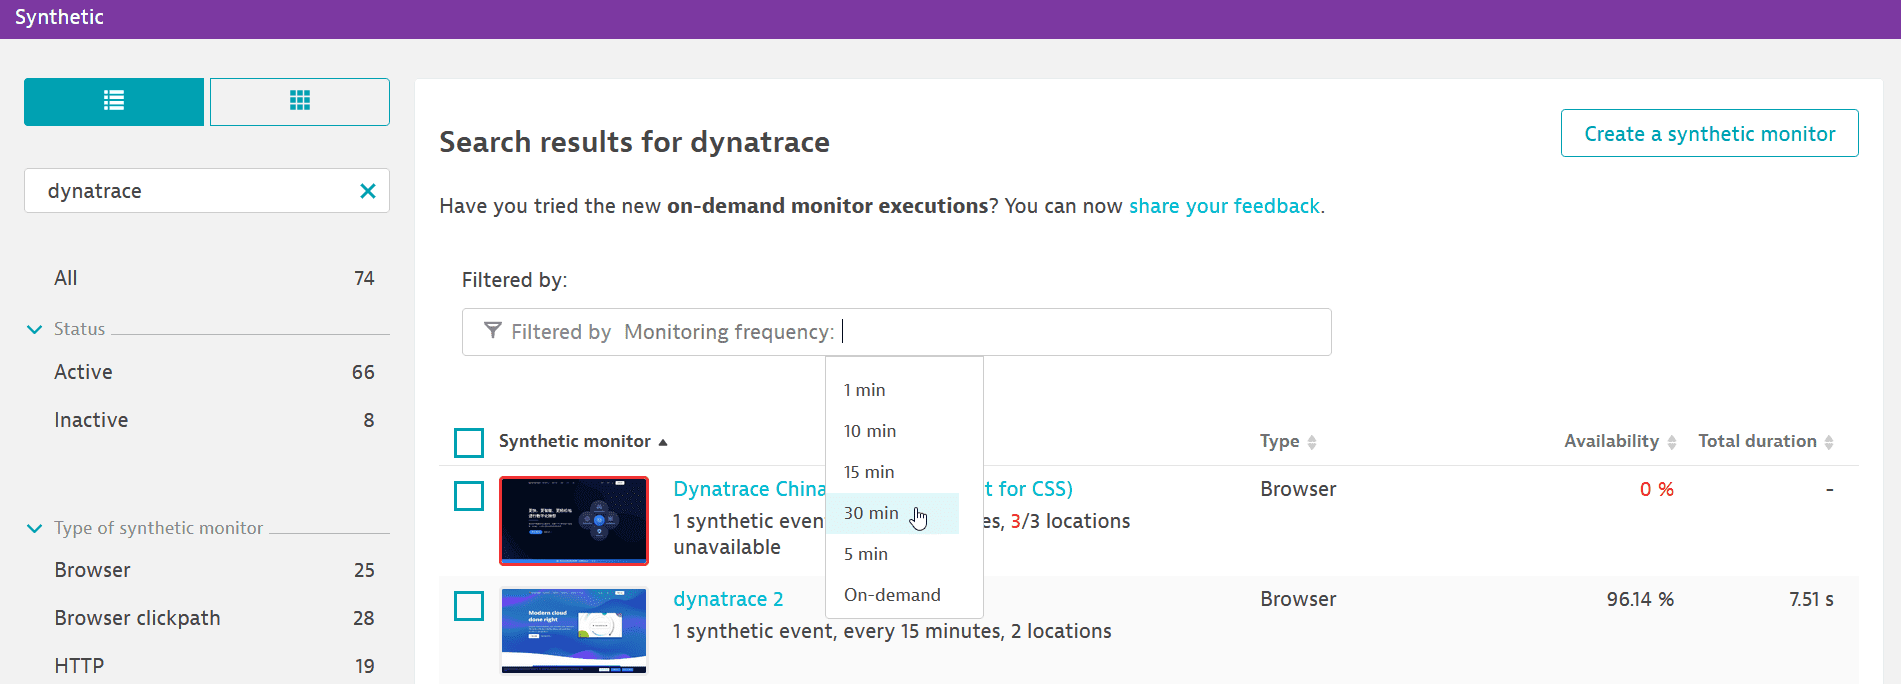
Filter synthetic monitors by frequency
Digital Experience Monitoring | Synthetic Monitoring
The new Monitoring frequency filter on the Synthetic page enables you to filter browser as well as HTTP monitors by frequency; you can view the list of monitors for the selected scheduled frequency or on-demand status. The list values depend on the frequencies applied to the monitors in your environment.

Additional DQL functions
Cross Solutions | DQL
Now you can include the following functions in your DQL queries:
Orchestration project menu entry moved to the Releases page
Cloud Automation | Release monitoring
From now on, you need to navigate to the Releases page to get started with release validation and step into cloud automation.
Dynatrace API
To learn about changes to the Dynatrace API in this release, see Dynatrace API changelog version 1.256.
Resolved issues
General Availability (Build 1.256.97)
The 1.256 GA release contains 8 resolved issues.
Cluster
- Fixed an issue where mobile key user actions were not shown on the User action details page. (APM-391209)
- Improved performance of the Monitoring overview page for hosts by reducing the number of HTTP requests to the server for data. (DMX-2367)
- Fixed an issue in which RUM JavaScript binaries were not delivered to the OneAgent OS module. (RUM-8441)
- Kubernetes entity pages display tags in the header. (APM-391375)
- Fixed the Topping algorithm logic where chart data points for threads could be missing on case a thread is not always one of the top threads during analysis iterations. (TI-4074)
- Fixed an issue with manual problem close, which was reopened immediately afterward. (DAVIS-2852)
- Fixed the group list page in case there are thousands of groups and environments/management zones. (APM-391883)
- Fixed fields query parameter for custom devices and generic entities in the GET an entity API request. (APM-390364)
Update 101 (Build 1.256.101)
This is a cumulative update that contains all previously released updates for the 1.256 release.