Monitor z/OS logs
- Latest Dynatrace
- 4-min read
zRemote module version 1.297+ zDC module version 1.291+
Log analysis is typically one of the first steps in troubleshooting application problems. When a critical issue arises, having the right logs helps you understand what is happening within your applications.
Dynatrace can automatically discover and collect logs from monitored IBM CICS regions and IBM IMS subsystems. All collected logs are enriched with metadata to map them to the entity model of z/OS hosts (logical partitions) and z/OS processes (regions and subsystems). This allows you to extend your root cause analysis for any issue identified by Dynatrace Intelligence causal AI with logs automatically linked to your applications.
To learn more about related use cases, see Log Management and Analytics.
The following log sources are supported:
- CICS module version 1.291+ MSGUSR DD statement for IBM CICS regions
- IMS module version 1.295+ Primary and secondary master terminal for IBM IMS subsystems
Log Management and Analytics requires a license:
- For Dynatrace Platform Subscription, a Log Management and Analytics capability.
- For Dynatrace classic licensing, Davis data units.
Get started
Collection of logs from z/OS requires a Log ingest rule. You can get started by using one of the existing built-in rules.
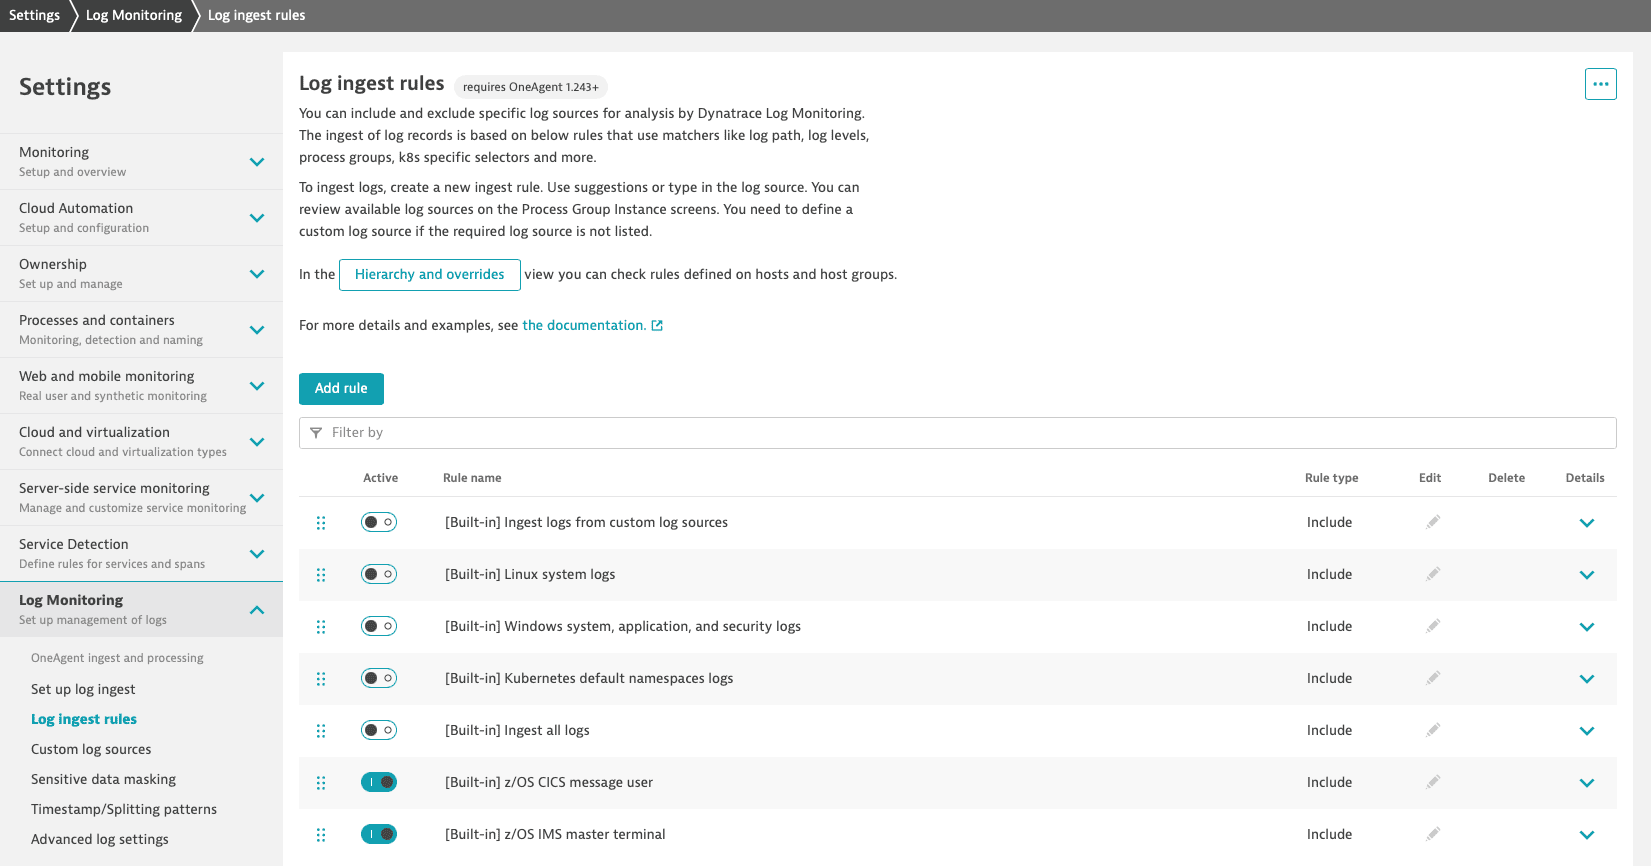
 Activate log ingest rule
Go to Settings and select Log Monitoring > Log ingest rules.
Activate one of the following built-in rules to ingest discovered logs from your IBM CICS regions and IBM IMS subsystems to Dynatrace.
| Rule | Condition | Scope |
|---|---|---|
z/OS CICS message user | Log source is: Log record level is any of: | Environment |
z/OS IMS master terminal | Log source is any of: Log record level is any of: | Environment |
Limit the scope of rules
If necessary, you can limit the scope of a log ingest rule to a specific group of LPARs (hosts group) or LPAR (host) so that logs are ingested only for those.
To do this, define a Log ingest rule with the required scope (host group or host).
Control which logs are ingested
If necessary, you can use attributes to precisely control which logs are ingested.
To do this, define a Log ingest rule with specific attributes so that only logs that match those attributes are ingested. For example, you can use the following attributes.
| Attribute | Description | Search dropdown logic |
|---|---|---|
Log source | Matching is based on a Log source attribute. For CICS, select the | Can be entered manually. No time limit. |
Log record level1 | Matching is based on the level of the log record. It supports the following values: | Can be entered manually. No time limit. |
Log content | Matching is based on the content of the log; wildcards are supported in the form of an asterisk. | Can be entered manually. No time limit. |
Process group | Matching is based on the process group ID. | Entities visible in the last 3 days are listed. |
Log record level attribute, transformed by OneAgent, is different than the log status attribute transformed by the Dynatrace server. Learn more by accessing the Automatic log enrichment page.
 Mask sensitive log data
Configure masking of sensitive data as described in Sensitive data masking in OneAgent.
 Analyze log data
With Dynatrace Log Analytics, you can analyze telemetry data and extend observability use cases for IBM Z mainframes.
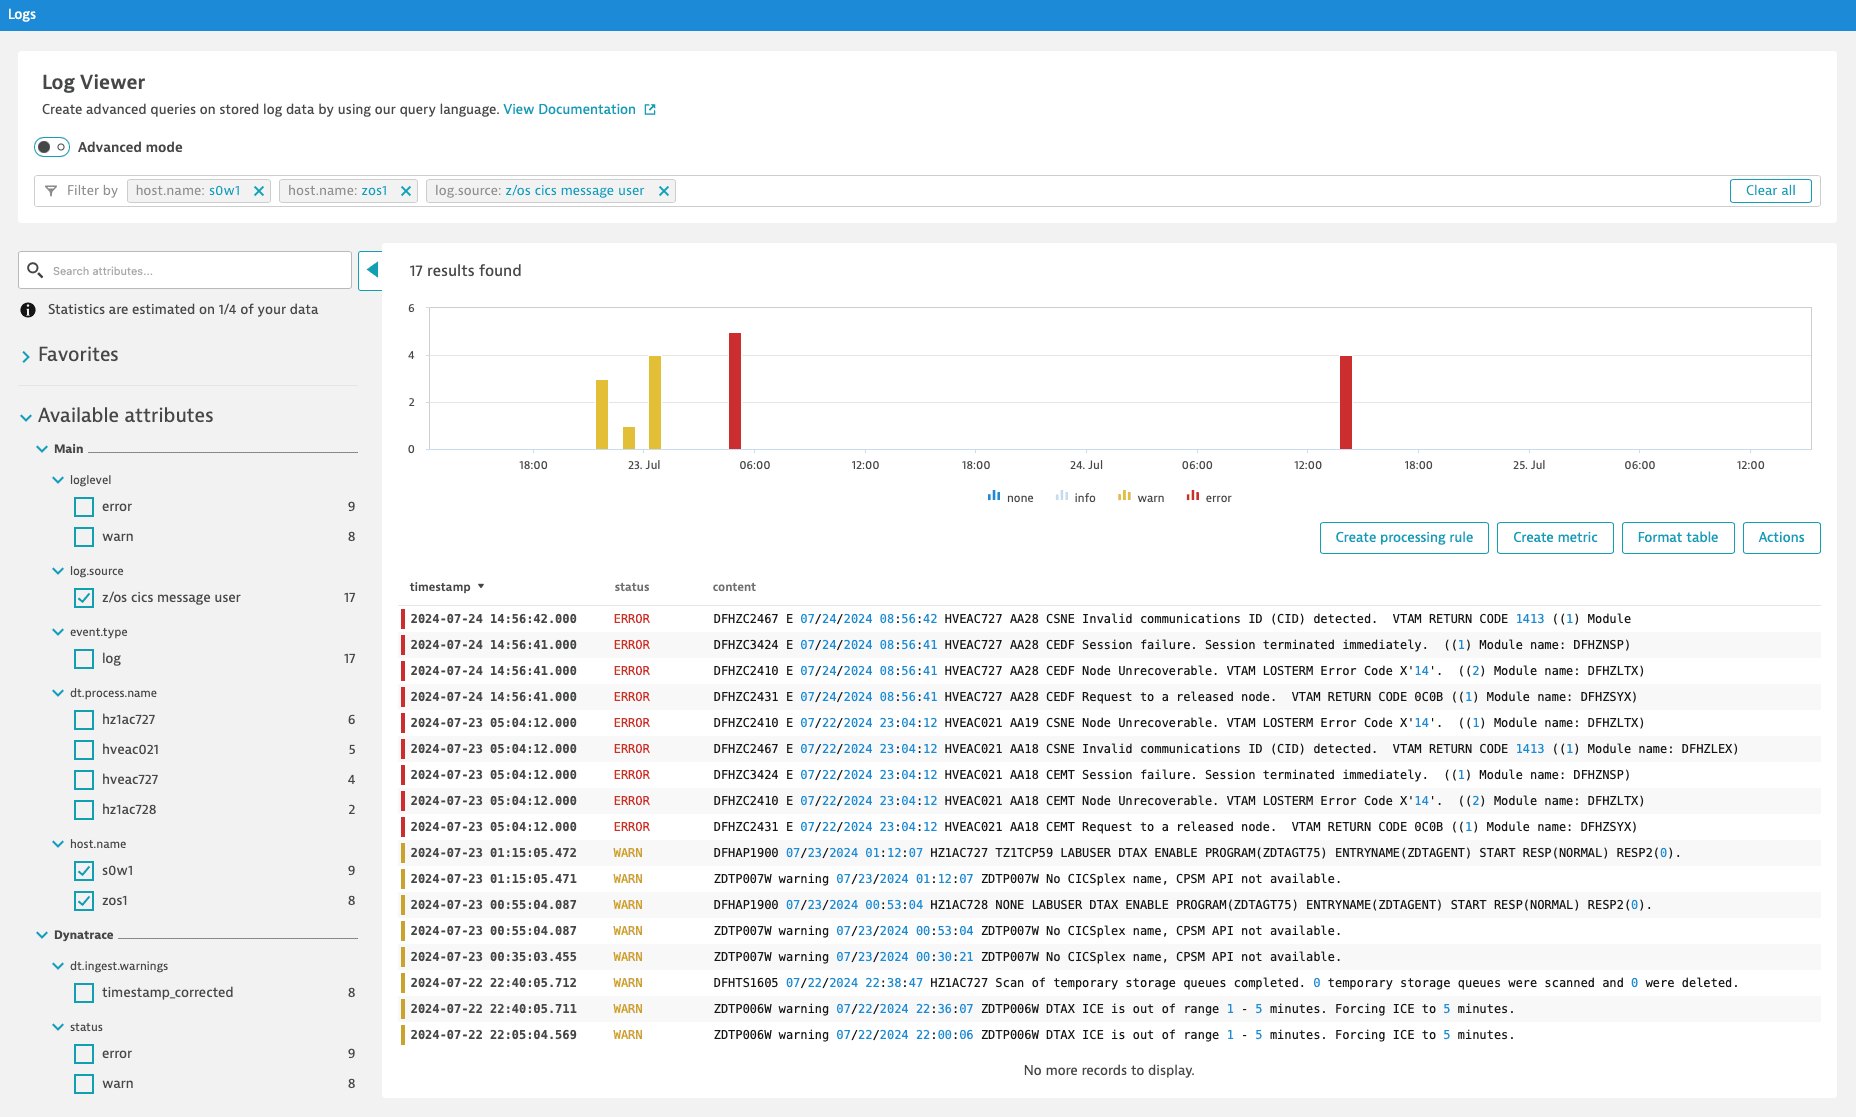
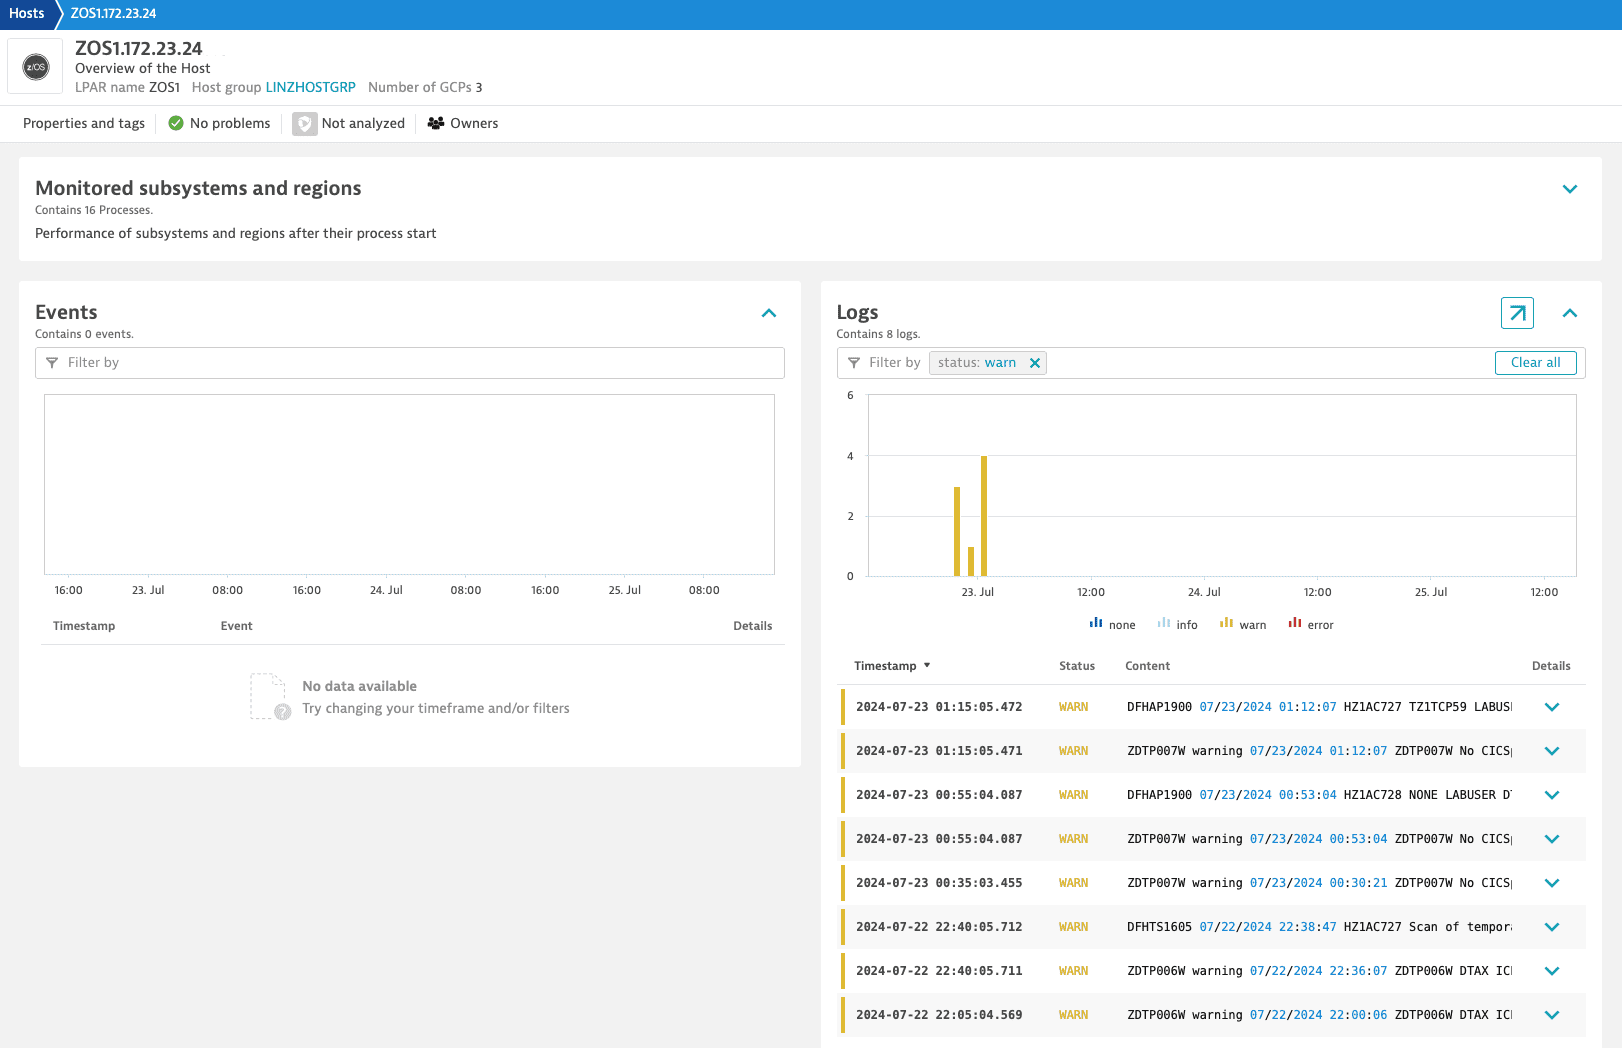
For example, you can quickly investigate specific error log lines in the Log Viewer. Thanks to the enriched log data, the log lines are connected to the respective z/OS Host page.
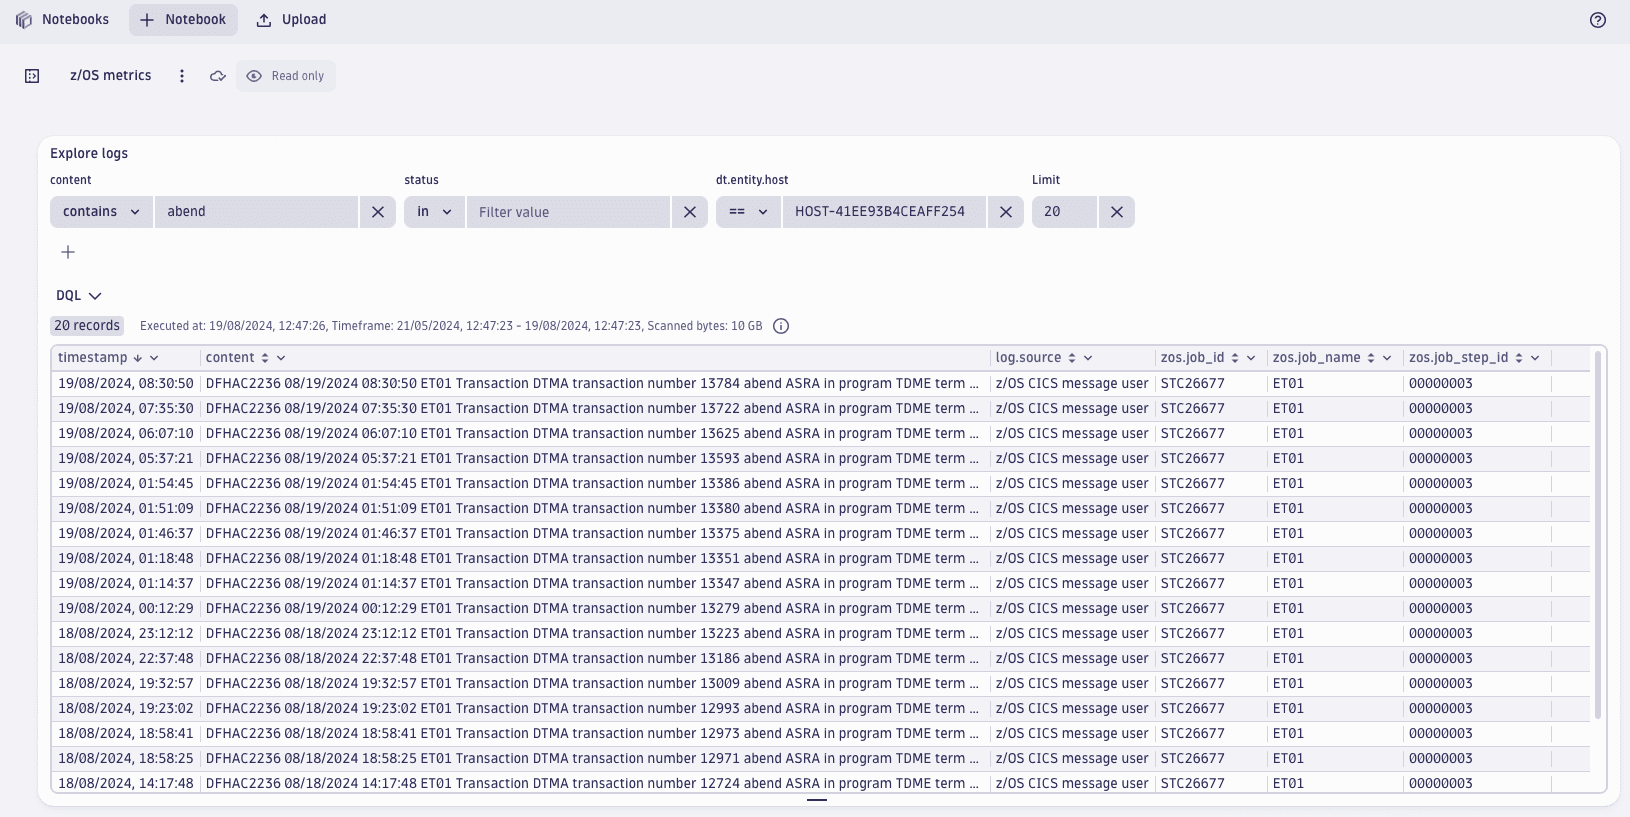
You can also perform advanced queries in Notebooks with the Dynatrace Query Language (DQL). For example, with DQL, you can quickly query all abends or drill down into specific job statistics.
FAQ
Which metadata is added to the ingested z/OS logs?
All ingested logs are enriched with the following metadata: dt.process.name, host.name, log.source, os.name, zos.job_id, zos.job_name, zos_job_step_id, dt.entity.host, dt.entity.process_group, dt.entity.process_group_instance, and dt.source_entity.
This metadata is used to map the logs to the entity model of z/OS processes.