Calculate your consumption of Traces - Ingest & Process (DPS)
- Latest Dynatrace
- Explanation
- 7-min read
This page describes how the Traces - Ingest & Process DPS capability is consumed and billed. For an overview of the capability, including its main features, see Traces - Ingest & Process.
How consumption is calculated: GiB
Billed volume is calculated before transformation in service detection and OpenPipeline. The measured size is independent of the data source or protocol. It is calculated per gibibyte (GiB).
Calculate your consumption
Apply the following calculation to determine your consumption for the Ingest & Process data-usage dimension:
[(GiB ingested via the OpenTelemetry OTLP API) + (GiB ingested via serverless functions) + (GiB of Full-Stack extended ingest, including fullstack-adaptive and fullstack-fixed-rate excess above the included volume)] * (GiB price as per your Rate Card) = consumption
Full-Stack trace volume licensing types
When trace data from full-stack monitored sources exceeds the Full-Stack included trace volume, the excess is billed via Traces – Ingest & Process. Depending on how the excess was generated, it's attributed to one of the two licensing types:
fullstack-adaptive: Trace data managed by Adaptive Traffic Management that exceeds the Full-Stack included trace volume. Typically, this implies trace data captured by OneAgent, but it could also be Envoy configured to use adaptive traffic management as a sampling mechanism.fullstack-fixed-rate: Trace data from full-stack monitored sources that is captured via fixed-rate sampling or from OpenTelemetry instrumentation on full-stack monitored hosts, which exceeds the Full-Stack included trace volume.
Track your consumption
On the environment level, Dynatrace provides pre-made Notebooks for each DPS capability that you can use for detailed analysis. These are available in Account Management (Subscription > Overview > Cost and usage details > Select the capability > Actions > Open details with Notebooks > Select or create Notebook).
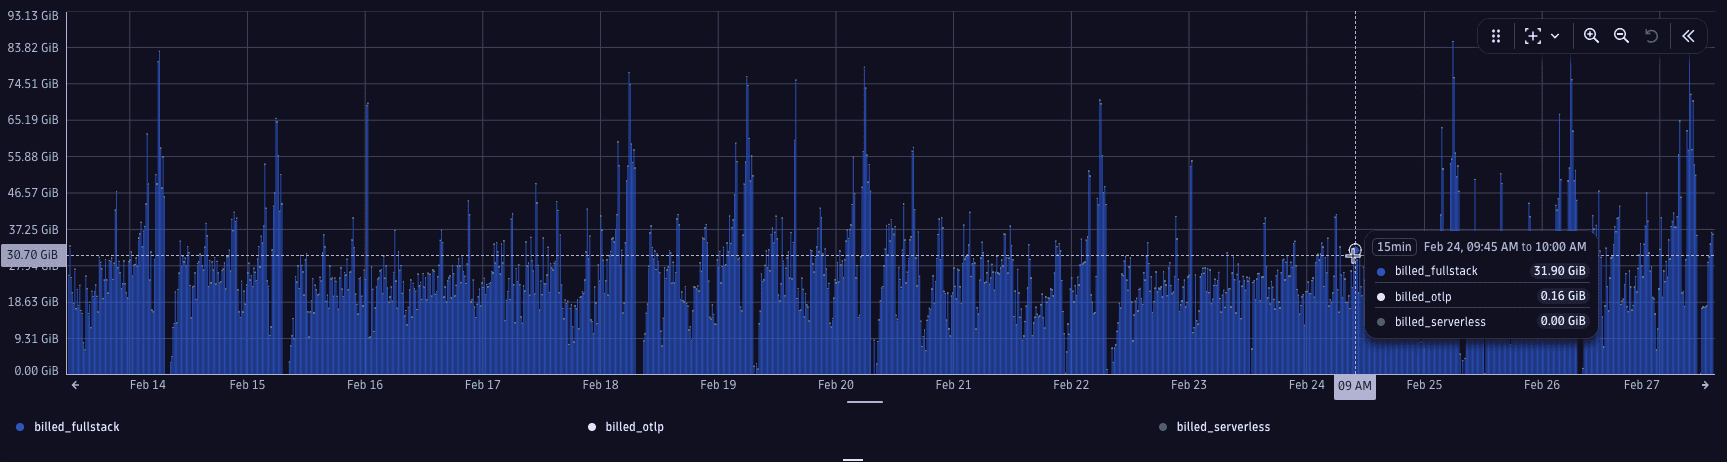
The following chart provides details on Ingest & Process consumption, aggregated into 15-minute increments. When you select a given increment, the info pop-up shows:
- The source of the consumption:
billed_fullstack: Extended ingest from full-stack monitored sources.billed_otlp: Via the OpenTelemetry OTLP API.billed_serverless: Via a serverless function.
- The billed data volume.
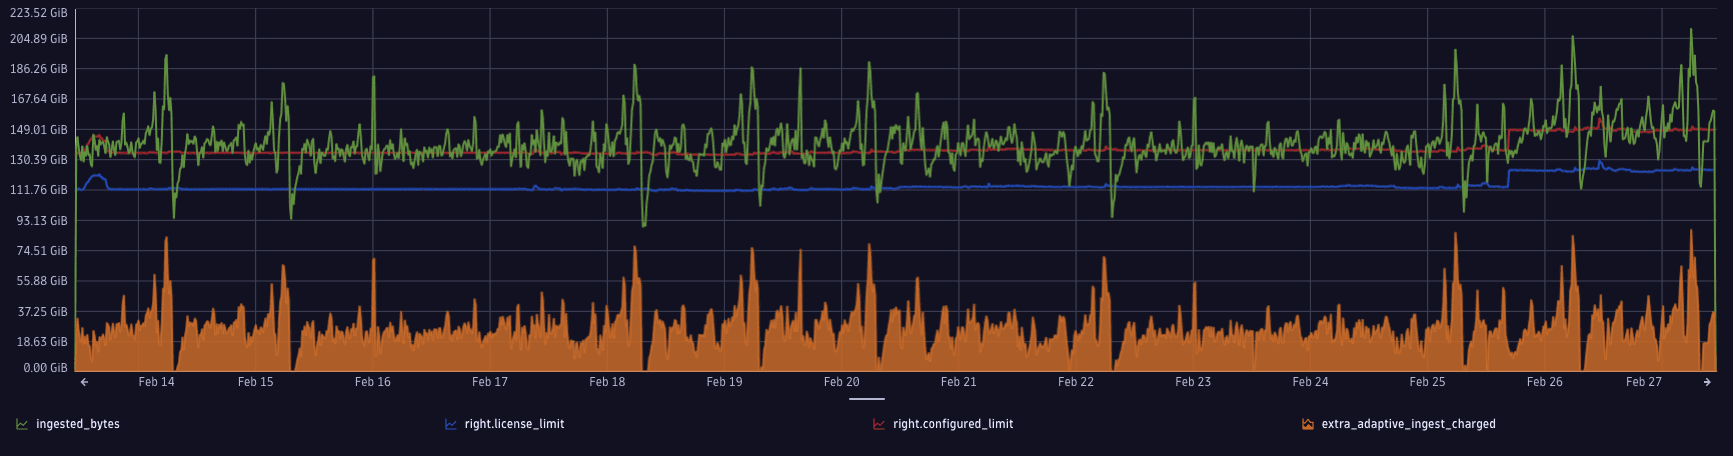
The following chart provides details on Ingest & Process consumption that is triggered by Full-Stack extended ingest.
The four data sources are:
- The included Full-Stack Monitoring volume (blue line).
- The configured Adaptive Traffic Management volume (red line).
- The real ingest (green line).
- The extended trace ingest volume that consumes Ingest & Process (equal to the area between the included volume and the real ingest) (orange line).
This query splits Full-Stack billing into the fullstack-adaptive and fullstack-fixed-rate licensing types described in Full-Stack trace volume licensing types.