Migrate from AWS classic (formerly 'built-in') services to cloud services
- Dynatrace Classic
- How-to guide
- 9-min read
From the AWS overview page, you can access Dynatrace classic services and cloud services for AWS monitoring. Both types of services share the same AWS resources. However, classic services use a predefined set of metrics, so configuring which metrics to monitor, or determining which ones are already monitored, is not supported.
Classic services vs cloud services
As previously mentioned, classic services and cloud services share the same AWS resources. However, cloud services support a wider range of configuration options, such as new metrics and customizable monitored metrics. To give you more customization options, we’ve started the following:
-
Adding more services to the Cloud services section so you can customize which metrics you want to monitor.
-
Adding more metrics for cloud services; not only are they configurable, but you can now monitor much more than before.
-
Replacing the classic services with cloud services that have more configuration options regarding metrics.
If you're using classic services, we recommend migrating to cloud services to take advantage of the wider range of customizable configuration options.
If you're using OneAgent integration for your Lambdas, we recommend Lambda migration. Since the release of Dynatrace version 1.283, we show data for the new Lambda service together with OneAgent data on the Lambda service page.
Impact of the migration
Even though classic and cloud services monitor the same AWS resources on Dynatrace side, they are monitored as two different entities.
-
They have different entity IDs and metric keys.
-
Due to their different implementations, they may detect different numbers of instances. Cloud services show only instances with metrics.
-
Data for each Dynatrace entity type is collected and stored separately.
-
 Breaking change You need to adapt the configuration of dashboards, alerts, and management zones based on entity ID or metric keys with the monitored service type.
You currently have the option to choose from a classic or cloud service to preserve historical data, but be aware of the following:
-
Historical data is persisted on the classic services. If you switch back, monitored data will present gaps for the period in which the resources were monitored via the cloud service.
-
You can’t have both of them turned on simultaneously. Even though on the Dynatrace side they’re two different services, the legacy and new versions monitor the same AWS resource. If you had two versions switched on simultaneously, you would be charged double for polling the same data twice.
-
If you turn on the new version, the classic version is turned off automatically, and vice versa.
-
There is no direct link between
- Entities containing historical and new data.
- Cloud service data and data coming from OneAgent for opaque Amazon RDS—not linked to the new cloud service page with CloudWatch metrics.
-
Logs from Amazon Data Firehose to Amazon RDS are still being linked to the historical data and entity
RELATIONAL_DATABASE_SERVICE. -
Events or problems that would have been auto-detected on the historical (classic) data might not be automatically raised. Alerting rules are not provided for these cloud services:
- Amazon RDS
- Amazon EBS
- AWS Lambda—predefined metric event configuration is provided but needs to be manually enabled.
To monitor cloud services, you need to have Environment ActiveGate configured.
Changes in the UI
Your AWS overview page changes after configuring a new version of a service.
For example, let’s have a look at Amazon EBS.
-
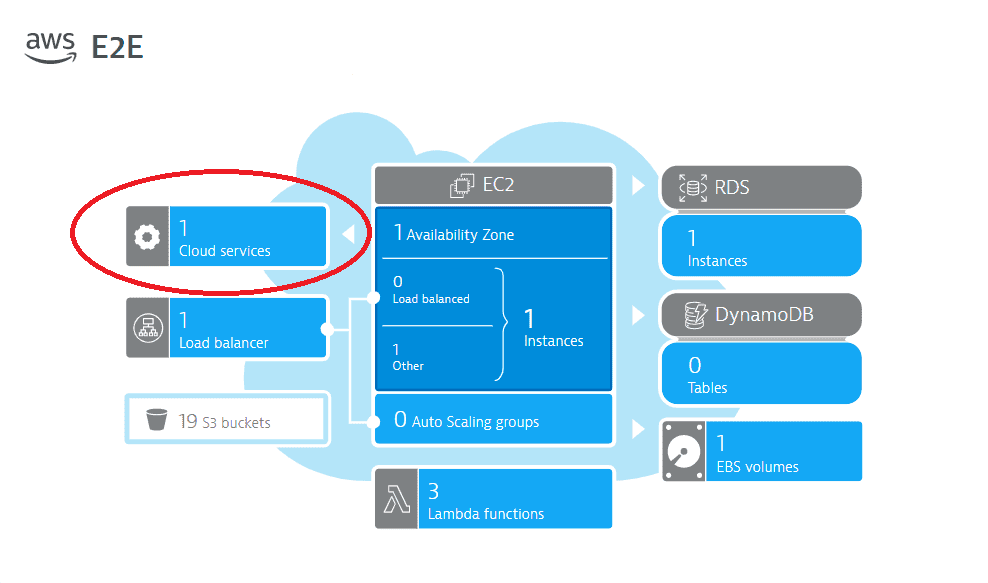
If the legacy Amazon EBS (classic) service is configured, this is what the EBS volumes section of the AWS overview looks like.
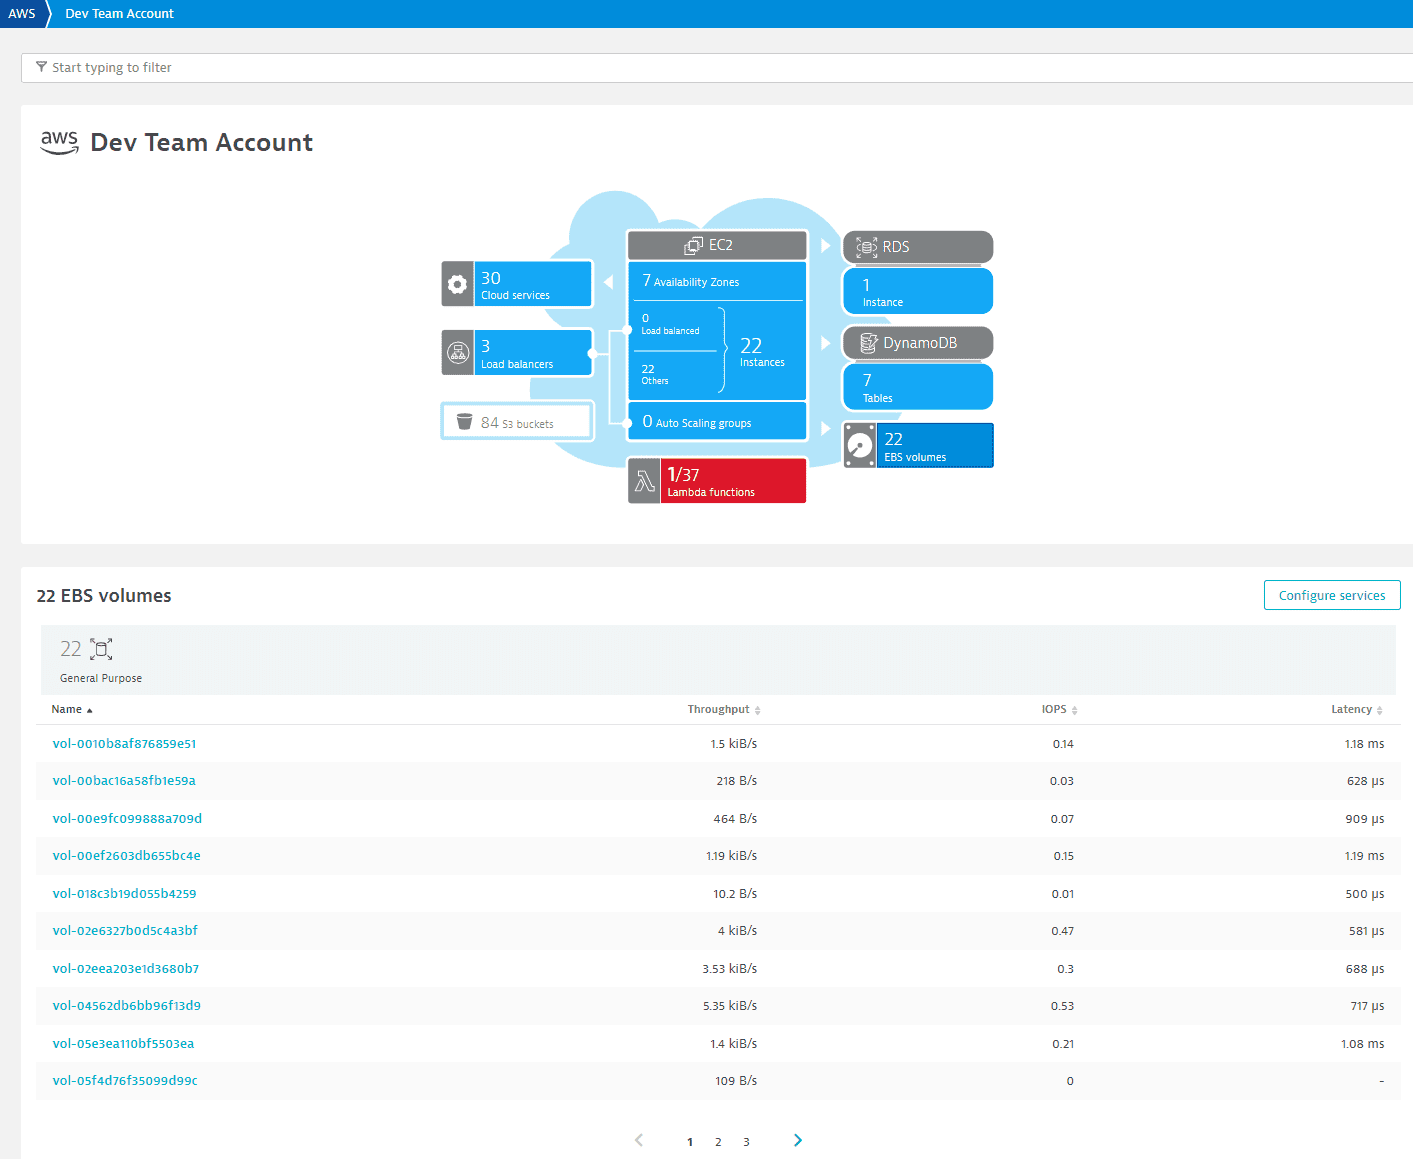 EBS volumes section 1
 -
If the Amazon EBS cloud service is configured, this is what the EBS volumes section of the AWS overview looks like.
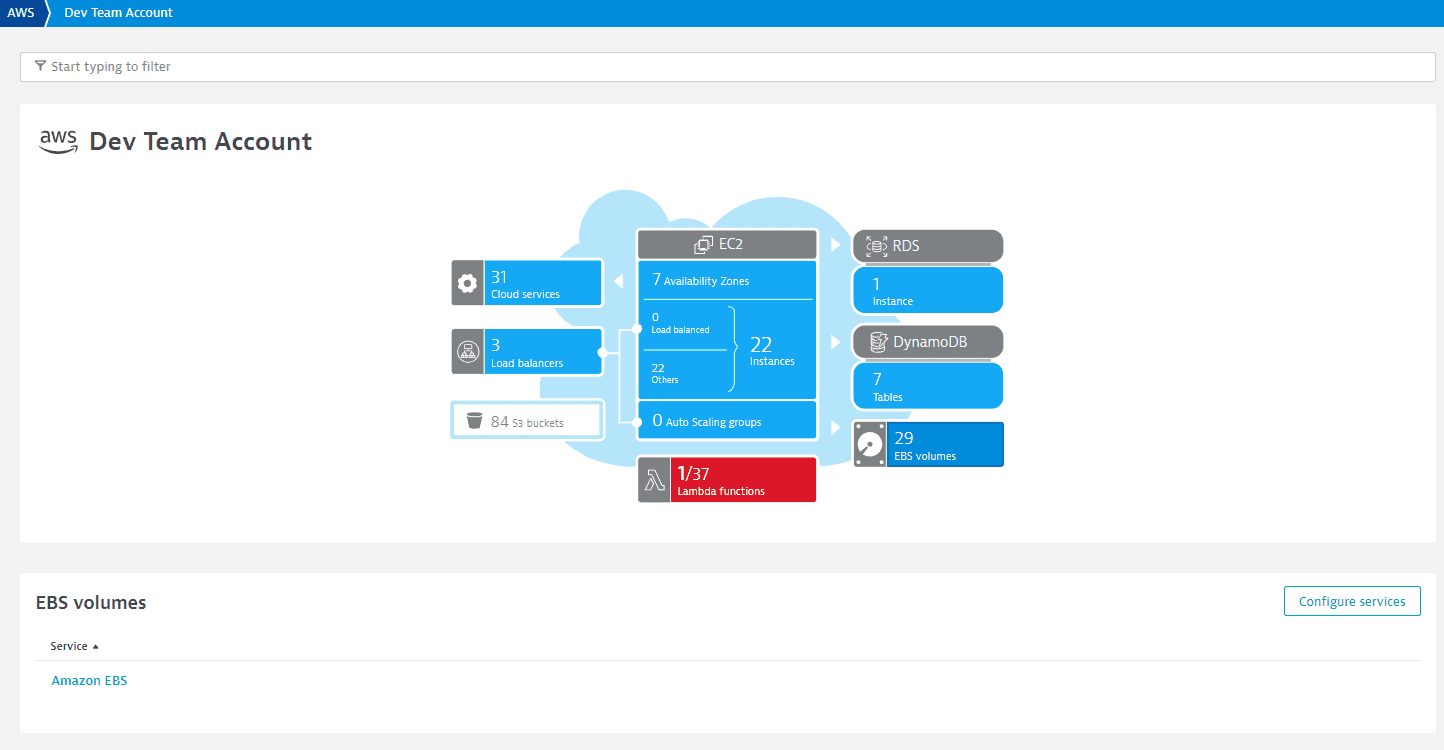 EBS volumes section 2
 -
Select Cloud services to find new overview pages for the services.
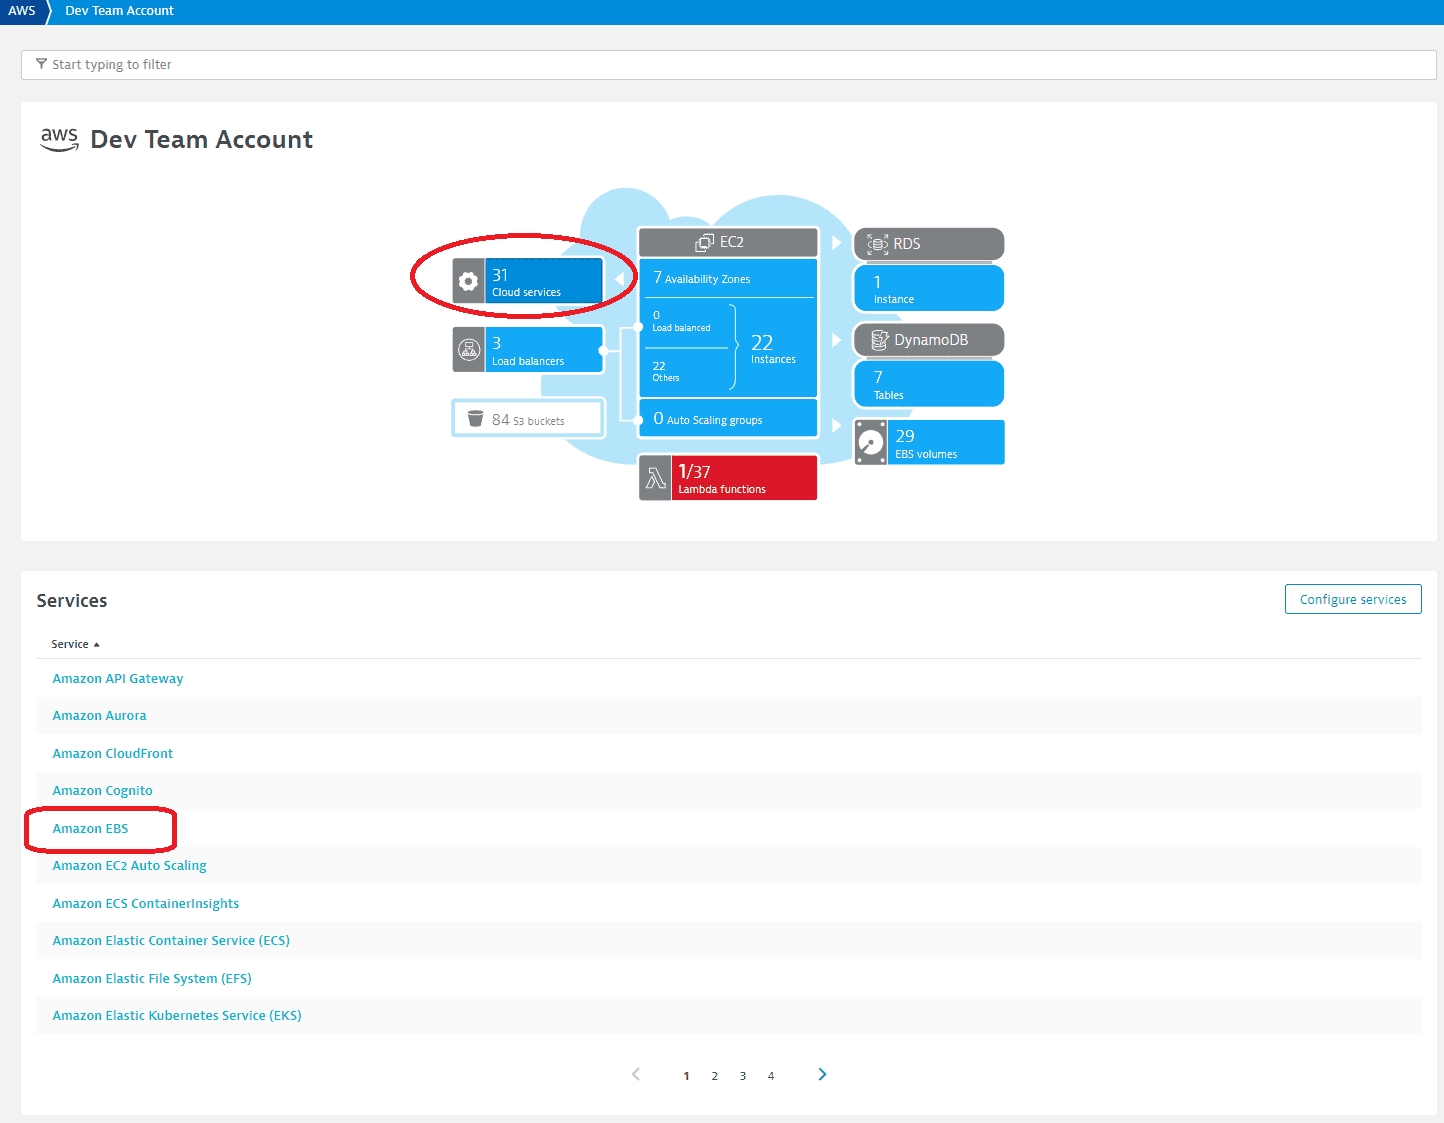 Amazon EBS
 -
Additionally, you can configure metrics for cloud services via the web UI.
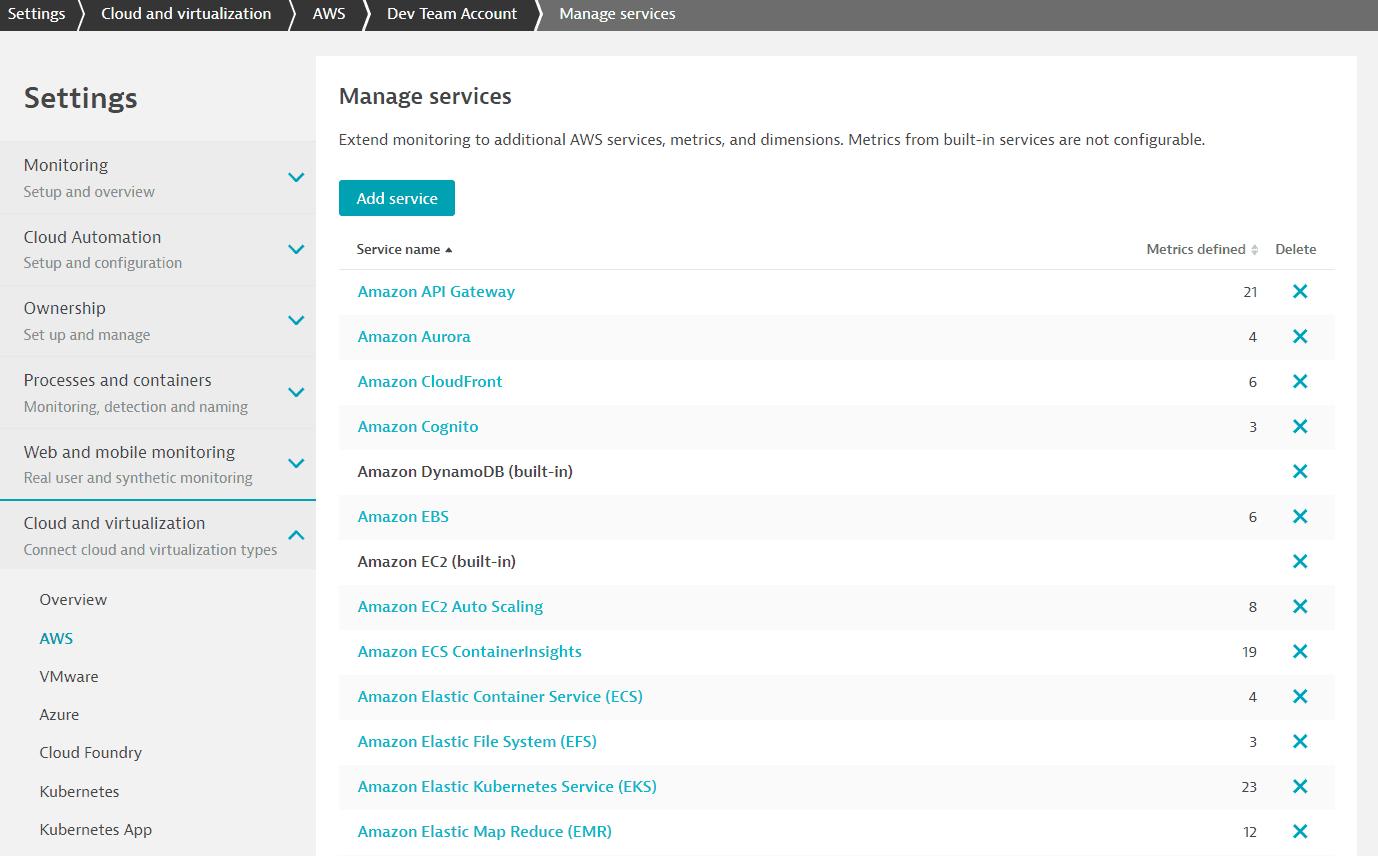 AWS Settings Manage services
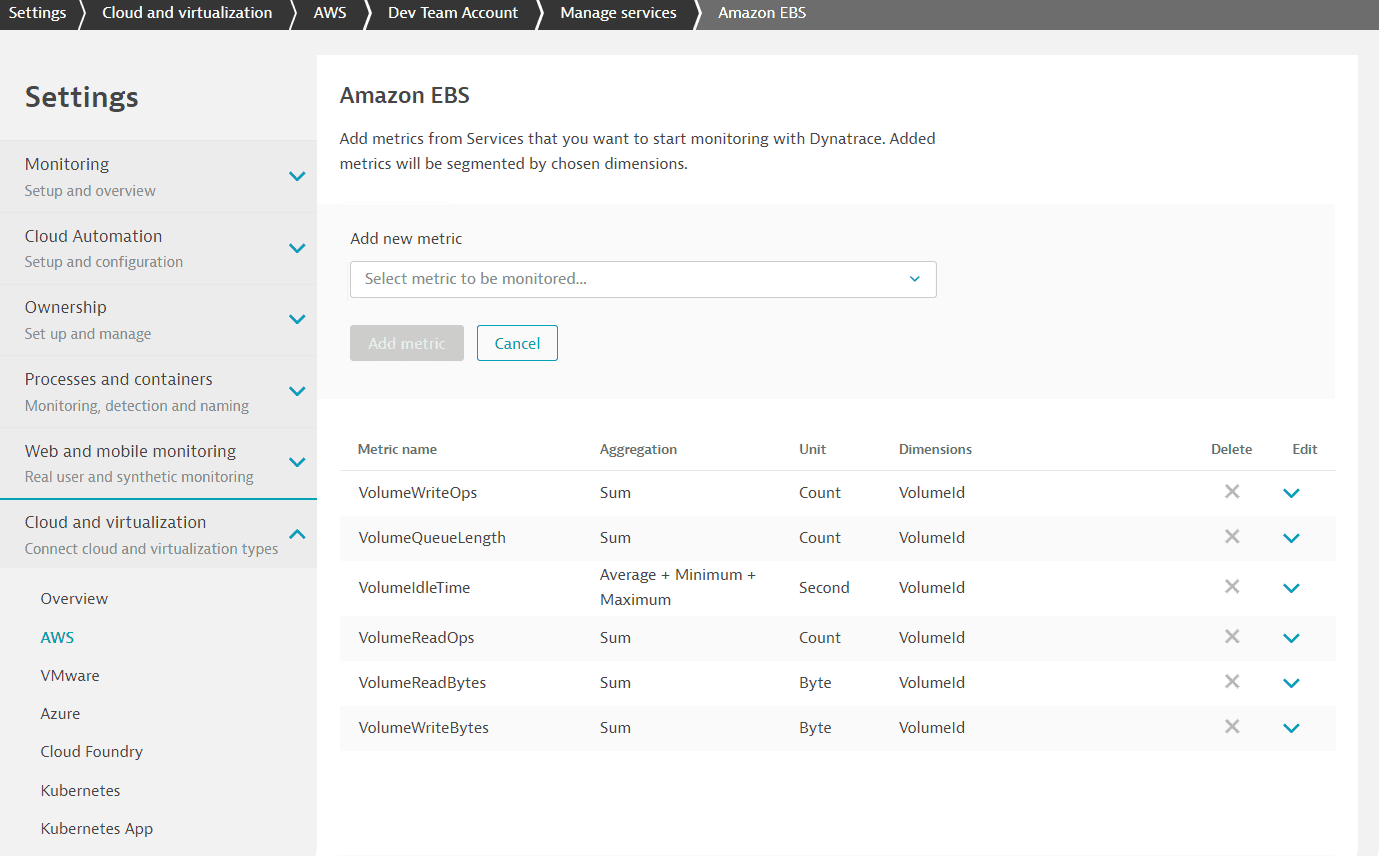 Settings Amazon EBS
Cloud services and their corresponding classic services
Metrics migration
Below you can find tables with classic services metrics and their corresponding cloud services metrics. Empty cells indicate the lack of an identical corresponding metric.
You can find more details about accessing these in Grail on this page.
The ext: prefix is used by metrics from OneAgent extensions and ActiveGate extensions, and also by classic metrics for AWS integration.
Despite the naming similarities, AWS integration metrics are not based on extensions.
Amazon Auto scaling group
| Classic service metric name | Classic service metric key | Cloud service metric name | Cloud service metric key |
|---|---|---|---|
| Number of running EC2 instances (ASG) | builtin:cloud.aws.asg.running | - | - |
| Number of stopped EC2 instances (ASG) | builtin:cloud.aws.asg.stopped | - | - |
| Number of terminated EC2 instances (ASG) | builtin:cloud.aws.asg.terminated | - | - |
Amazon DynamoDB
| Classic service metric name | Classic service metric key | Cloud service metric name | Cloud service metric key |
|---|---|---|---|
| DynamoDB read capacity units | builtin:cloud.aws.dynamo.capacityUnits.consumed.read | ConsumedReadCapacityUnits Sum | ext:cloud.aws.dynamodb.consumedReadCapacityUnitsSum ext:cloud.aws.dynamodb.consumedReadCapacityUnitsByGlobalSecondaryIndexName |
| DynamoDB write capacity units | builtin:cloud.aws.dynamo.capacityUnits.consumed.write | ConsumedWriteCapacityUnits Sum | ext:cloud.aws.dynamodb.consumedWriteCapacityUnitsSum ext:cloud.aws.dynamodb.consumedWriteCapacityUnitsSumByGlobalSecondaryIndexName |
| DynamoDB provisioned read capacity units | builtin:cloud.aws.dynamo.capacityUnits.provisioned.read | ProvisionedReadCapacityUnits Sum | ext:cloud.aws.dynamodb.provisionedReadCapacityUnitsSum ext:cloud.aws.dynamodb.provisionedReadCapacityUnitsSumByGlobalSecondaryIndexName |
| DynamoDB provisioned write capacity units | builtin:cloud.aws.dynamo.capacityUnits.provisioned.write | ProvisionedWriteCapacityUnits Sum | ext:cloud.aws.dynamodb.provisionedWriteCapacityUnitsSum ext:cloud.aws.dynamodb.provisionedWriteCapacityUnitsSumByGlobalSecondaryIndexName |
| DynamoDB read capacity units % | builtin:cloud.aws.dynamo.capacityUnits.read | calculated | 100 * ext:cloud.aws.dynamodb.consumedReadCapacityUnitsSum / ext:cloud.aws.dynamodb.provisionedReadCapacityUnitsSum |
| DynamoDB write capacity units % | builtin:cloud.aws.dynamo.capacityUnits.write | calculated | 100 * ext:cloud.aws.dynamodb.consumedWriteCapacityUnitsSum / ext:cloud.aws.dynamodb.provisionedWriteCapacityUnitsSum |
| DynamoDB number of requests with HTTP 500 status code | builtin:cloud.aws.dynamo.errors.system | SystemErrors Sum (by Operation) | ext:cloud.aws.dynamodb.SystemErrorsSumByOperation |
| DynamoDB number of requests with HTTP 400 status code | builtin:cloud.aws.dynamo.errors.user | UserErrors Sum (by Region) | ext:cloud.aws.dynamodb.UserErrorsSum |
| DynamoDB number of successful request latency for operation | builtin:cloud.aws.dynamo.requests.latency | SuccessfulRequestLatency (by Operation) | ext:cloud.aws.dynamodb.successfulRequestLatencyByOperation |
| DynamoDB number of items returned by operation | builtin:cloud.aws.dynamo.requests.returnedItems | ReturnedItemCount Sum (by Operation) | ext:cloud.aws.dynamodb.returnedItemCountSumByOperation |
| DynamoDB number of throttled requests for operation | builtin:cloud.aws.dynamo.requests.throttled | ThrottledRequests Sum (by Operation) | ext:cloud.aws.dynamodb.ThrottledRequestsSumByOperation |
| DynamoDB number of read throttled events | builtin:cloud.aws.dynamo.throttledEvents.read | ReadThrottleEvents Sum | ext:cloud.aws.dynamodb.ReadThrottleEventsSum ext:cloud.aws.dynamodb.ReadThrottleEventsSumByGlobalSecondaryIndexName |
| DynamoDB number of write throttled events | builtin:cloud.aws.dynamo.throttledEvents.write | WriteThrottleEvents Sum | ext:cloud.aws.dynamodb.WriteThrottleEventsSum ext:cloud.aws.dynamodb.WriteThrottleEventsSumByGlobalSecondaryIndexName |
| Number of tables for AvailabilityZone | builtin:cloud.aws.dynamo.tables | - | - |
Amazon EBS
| Classic service metric name | Classic service metric key | Cloud service metric name | Cloud service metric key |
|---|---|---|---|
| EBS volume read latency | builtin:cloud.aws.ebs.latency.read | - | - |
| EBS volume write latency | builtin:cloud.aws.ebs.latency.write | - | - |
| EBS volume consumed OPS | builtin:cloud.aws.ebs.ops.consumed | VolumeConsumedReadWriteOps Sum | ext:cloud.aws.ebs.volumeConsumedReadWriteOps |
| EBS volume read OPS | builtin:cloud.aws.ebs.ops.read | VolumeReadOps Sum | ext:cloud.aws.ebs.volumeReadOpsSum |
| EBS volume write OPS | builtin:cloud.aws.ebs.ops.write | VolumeWriteOps Sum | ext:cloud.aws.ebs.volumeWriteOpsSum |
| EBS volume throughput % | builtin:cloud.aws.ebs.throughput.percent | VolumeThroughputPercentage | ext:cloud.aws.ebs.volumeThroughputPercentage |
| EBS volume read throughput | builtin:cloud.aws.ebs.throughput.read | calculated | ext:cloud.aws.ebs.volumeReadBytes / ext:cloud.aws.ebs.volumeTotalReadTime |
| EBS volume write throughput | builtin:cloud.aws.ebs.throughput.write | calculated | ext:cloud.aws.ebs.volumeWriteBytes / ext:cloud.aws.ebs.volumeTotalWriteTime |
| EBS volume idle time % | builtin:cloud.aws.ebs.idleTime | - | - |
| EBS volume queue length | builtin:cloud.aws.ebs.queue | VolumeQueueLength Sum | ext:cloud.aws.ebs.volumeQueueLengthSum |
AWS Lambda
| Classic service metric name | Classic service metric key | Cloud service metric name | Cloud service metric key |
|---|---|---|---|
| LambdaFunction concurrent executions count | builtin:cloud.aws.lambda.concExecutions | ConcurrentExecutions Sum | ext:cloud.aws.lambda.concurrentExecutionsSum ext:cloud.aws.lambda.concurrentExecutionsSumByResource ext:cloud.aws.lambda.concurrentExecutionsSumByRegion |
| LambdaFunction code execution time. | builtin:cloud.aws.lambda.duration | Duration | ext:cloud.aws.lambda.duration ext:cloud.aws.lambda.durationByResource ext:cloud.aws.lambda.durationByRegion |
| LambdaFunction number of failed invocations with HTTP 4XX status code | builtin:cloud.aws.lambda.errors | Errors Sum | ext:cloud.aws.lambda.errorsSum ext:cloud.aws.lambda.errorsSumByResource ext:cloud.aws.lambda.errorsSumByRegion |
| LambdaFunction rate of failed invocations to all invocations % | builtin:cloud.aws.lambda.errorsRate | calculated | 100 * ext:cloud.aws.lambda.errorsSum / ext:cloud.aws.lambda.invocationsSum |
| LambdaFunction number of times a function is invoked | builtin:cloud.aws.lambda.invocations | Invocations Sum | ext:cloud.aws.lambda.invocationsSum ext:cloud.aws.lambda.invocationsSumByResource ext:cloud.aws.lambda.invocationsSumByRegion |
| LambdaFunction provisioned concurrent executions count | builtin:cloud.aws.lambda.provConcExecutions | ProvisionedConcurrentExecutions Sum | ext:cloud.aws.lambda.provisionedConcurrentExecutionsSum ext:cloud.aws.lambda.provisionedConcurrentExecutionsSumByResource ext:cloud.aws.lambda.provisionedConcurrentExecutionsSumByRegion |
| LambdaFunction provisioned concurrency invocation count | builtin:cloud.aws.lambda.provConcInvocations | ProvisionedConcurrencyInvocations Sum | ext:cloud.aws.lambda.provisionedConcurrencyInvocationsSum ext:cloud.aws.lambda.provisionedConcurrencyInvocationsSumByResource ext:cloud.aws.lambda.provisionedConcurrencyInvocationsSumByRegion |
| LambdaFunction provisioned concurrency spillover invocation count | builtin:cloud.aws.lambda.provConcSpilloverInvocations | ProvisionedConcurrencySpilloverInvocations Sum | ext:cloud.aws.lambda.provisionedConcurrencySpilloverInvocationsSum ext:cloud.aws.lambda.provisionedConcurrencySpilloverInvocationsSumByResource ext:cloud.aws.lambda.provisionedConcurrencySpilloverInvocationsSumByRegion |
| LambdaFunction throttled function invocation count | builtin:cloud.aws.lambda.throttlers | Throttles Sum | ext:cloud.aws.lambda.throttlesSum ext:cloud.aws.lambda.throttlesSumByResource ext:cloud.aws.lambda.throttlesSumByRegion |
Amazon RDS
| Classic service metric name | Classic service metric key | Cloud service metric name | Cloud service metric key |
|---|---|---|---|
| RDS CPU usage % | builtin:cloud.aws.rds.cpu.usage | CPUUtilization | ext:cloud.aws.rds.cpuUtilization ext:cloud.aws.rds.cpuUtilizationByRegionDatabaseClass ext:cloud.aws.rds.cpuUtilizationByRegionDBClusterIdentifier ext:cloud.aws.rds.cpuUtilizationByRegion ext:cloud.aws.rds.cpuUtilizationByRegionEngineName ext:cloud.aws.rds.cpuUtilizationByRegionDBClusterIdentifierRole |
| RDS read latency | builtin:cloud.aws.rds.latency.read | ReadLatency | ext:cloud.aws.rds.readLatency ext:cloud.aws.rds.readLatencyByRegionDatabaseClass ext:cloud.aws.rds.readLatencyByRegionDBClusterIdentifier ext:cloud.aws.rds.readLatencyByRegion ext:cloud.aws.rds.readLatencyByRegionEngineName ext:cloud.aws.rds.readLatencyByRegionDBClusterIdentifierRole |
| RDS write latency | builtin:cloud.aws.rds.latency.write | WriteLatency | ext:cloud.aws.rds.writeLatency ext:cloud.aws.rds.writeLatencyByRegionDatabaseClass ext:cloud.aws.rds.writeLatencyByRegionDBClusterIdentifier ext:cloud.aws.rds.writeLatencyByRegion ext:cloud.aws.rds.writeLatencyByRegionEngineName ext:cloud.aws.rds.writeLatencyByRegionDBClusterIdentifierRole |
| RDS freeable memory | builtin:cloud.aws.rds.memory.freeable | FreeableMemory | ext:cloud.aws.rds.freeableMemory ext:cloud.aws.rds.freeableMemoryByRegionDatabaseClass ext:cloud.aws.rds.freeableMemoryByRegionDBClusterIdentifier ext:cloud.aws.rds.freeableMemoryByRegion ext:cloud.aws.rds.freeableMemoryByRegionEngineName ext:cloud.aws.rds.freeableMemoryByRegionDBClusterIdentifierRole |
| RDS swap usage | builtin:cloud.aws.rds.memory.swap | SwapUsage | ext:cloud.aws.rds.swapUsage ext:cloud.aws.rds.swapUsageByRegionDatabaseClass ext:cloud.aws.rds.swapUsageByRegionDBClusterIdentifier ext:cloud.aws.rds.swapUsageByRegion ext:cloud.aws.rds.swapUsageByRegionEngineName ext:cloud.aws.rds.swapUsageByRegionDBClusterIdentifierRole |
| RDS network received throughput | builtin:cloud.aws.rds.net.rx | NetworkReceiveThroughput | ext:cloud.aws.rds.networkReceiveThroughput ext:cloud.aws.rds.networkReceiveThroughputByRegionDatabaseClass ext:cloud.aws.rds.networkReceiveThroughputByRegionDBClusterIdentifier ext:cloud.aws.rds.networkReceiveThroughputByRegion ext:cloud.aws.rds.networkReceiveThroughputByRegionEngineName ext:cloud.aws.rds.networkReceiveThroughputByRegionDBClusterIdentifierRole |
| RDS network transmitted throughput | builtin:cloud.aws.rds.net.tx | NetworkTransmitThroughput | ext:cloud.aws.rds.networkTransmitThroughput ext:cloud.aws.rds.networkTransmitThroughputByRegionDatabaseClass ext:cloud.aws.rds.networkTransmitThroughputByRegionDBClusterIdentifier ext:cloud.aws.rds.networkTransmitThroughputByRegion ext:cloud.aws.rds.networkTransmitThroughputByRegionEngineName ext:cloud.aws.rds.networkTransmitThroughputByRegionDBClusterIdentifierRole |
| RDS read IOPS | builtin:cloud.aws.rds.ops.read | ReadIOPS | ext:cloud.aws.rds.readIOPS ext:cloud.aws.rds.readIOPSByRegionDatabaseClass ext:cloud.aws.rds.readIOPSByRegion ext:cloud.aws.rds.readIOPSByRegionEngineName |
| RDS write IOPS | builtin:cloud.aws.rds.ops.write | WriteIOPS | ext:cloud.aws.rds.writeIOPS ext:cloud.aws.rds.writeIOPSByRegionDatabaseClass ext:cloud.aws.rds.writeIOPSByRegion ext:cloud.aws.rds.writeIOPSByRegionEngineName |
| RDS read throughput | builtin:cloud.aws.rds.throughput.read | ReadThroughput | ext:cloud.aws.rds.readThroughput ext:cloud.aws.rds.readThroughputByRegionDatabaseClass ext:cloud.aws.rds.readThroughputByRegion ext:cloud.aws.rds.readThroughputByRegionEngineName |
| RDS write throughput | builtin:cloud.aws.rds.throughput.write | WriteThroughput | ext:cloud.aws.rds.writeThroughput ext:cloud.aws.rds.writeThroughputByRegionDatabaseClass ext:cloud.aws.rds.writeThroughputByRegion ext:cloud.aws.rds.writeThroughputByRegionEngineName |
| RDS connections | builtin:cloud.aws.rds.connections | DatabaseConnections Sum | ext:cloud.aws.rds.databaseConnectionsSumByRegionDatabaseClass ext:cloud.aws.rds.databaseConnectionsSumByRegionDBClusterIdentifier ext:cloud.aws.rds.databaseConnectionsSumByRegion ext:cloud.aws.rds.databaseConnectionsSumByRegionEngineName ext:cloud.aws.rds.databaseConnectionsSumByRegionDBClusterIdentifierRole |
| RDS free storage space % | builtin:cloud.aws.rds.free | - | - |
| RDS restarts | builtin:cloud.aws.rds.restarts | - | - |