Azure Storage Accounts (built-in)
For information about differences between classic services and other services, see Migrate from Azure classic (formerly "built-in") services to cloud services.
Dynatrace ingests metrics from Azure Metrics API for Azure Storage Accounts. You can view metrics for each service instance, split metrics into multiple dimensions, and create custom charts that you can pin to your dashboards.
Prerequisites
- Environment ActiveGate
- To disable monitoring of built-in services, you need Environment ActiveGate version 1.245+ and Dynatrace version 1.247+.
This service monitors Storage Accounts (Microsoft.Storage/storageAccounts). You can find the already monitored resources on the Azure overview page in Storage accounts section.
The Storage, StorageV2 and BlobStorage service types are supported. To monitor resources of the Microsoft.ClassicStorage/storageAccounts type, check Storage Account Classic and the Cloud services section on the Azure overview page.
This service monitors the same Azure resources as Azure Storage Account and Azure Storage Blob/File/Queue Services from Cloud services section. For more customizable monitoring switch to the latter ones. The historical (built-in) and new versions can't be switched on at the same time.
Enable monitoring
To learn how to enable service monitoring, see Enable service monitoring.
View service metrics
You can view Azure service metrics in your Dynatrace environment on the Azure subscription page or on your own dashboard.
Values in the table depend upon the selected timeframe. For more details, see Troubleshoot timeframe comparison for Azure monitoring setup).
View metrics on the Azure account page
To access metrics on the Azure account page
-
Go to Azure or Azure Classic (latest Dynatrace).
-
Choose the Azure subscription.
-
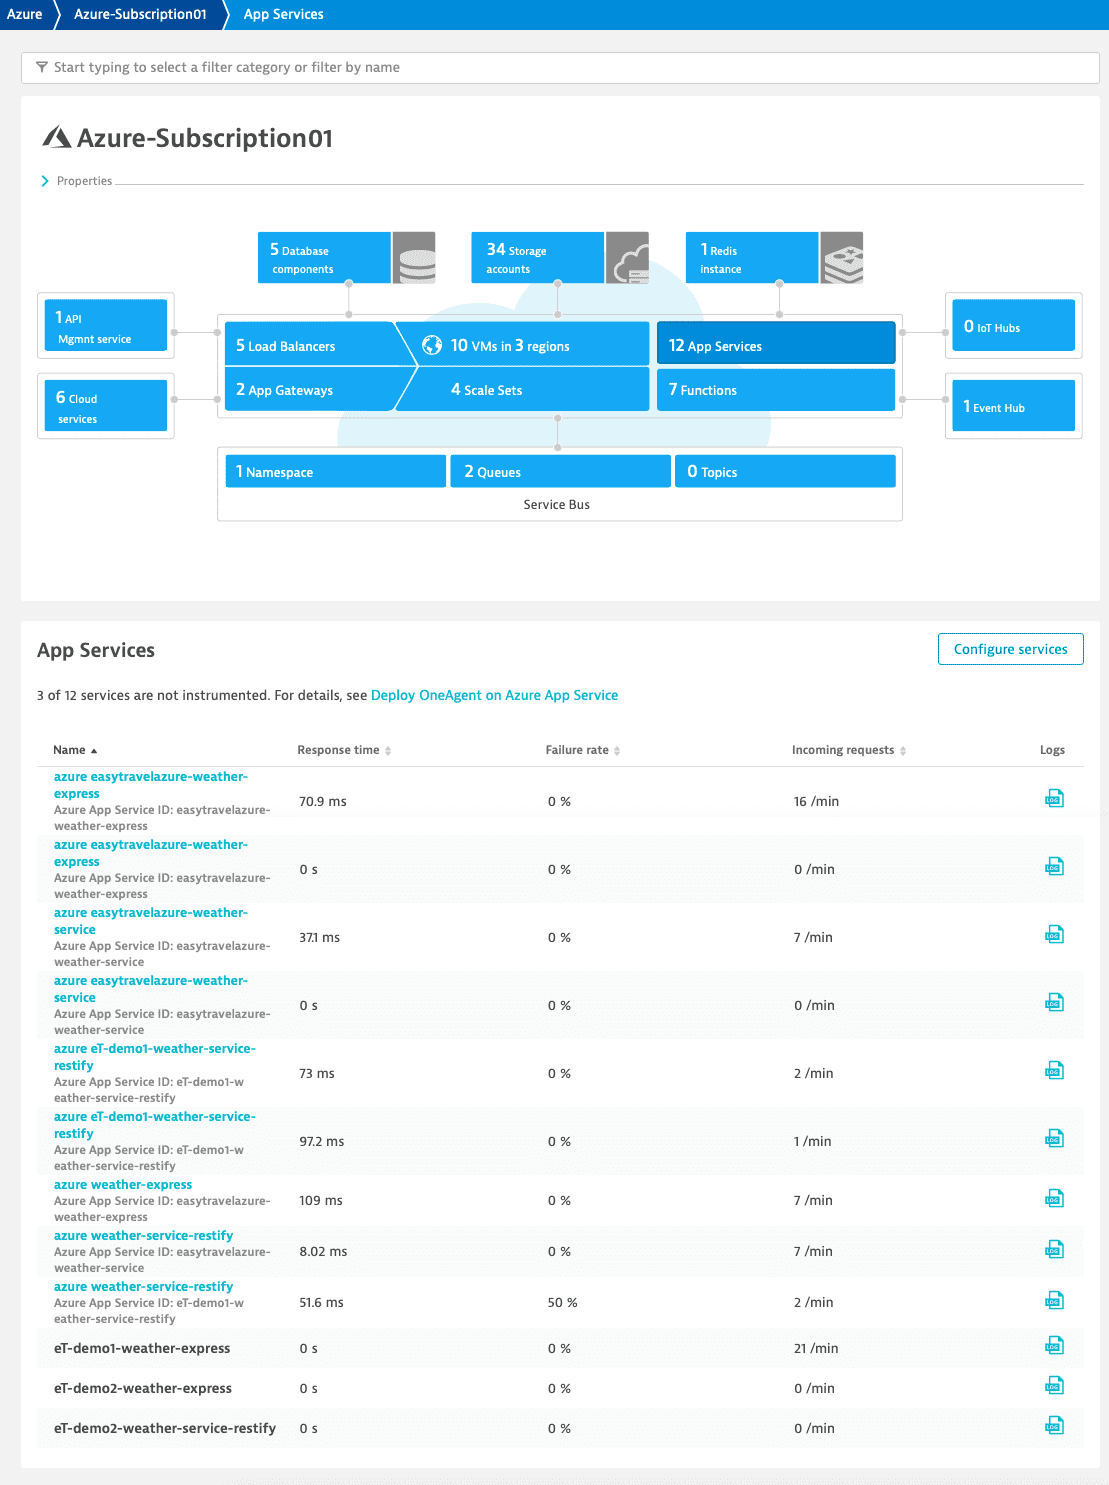
Select the service whose metrics you want to check. Metrics for the selected service are visible under the infographic in the service section, similarly to the example below.

View metrics on a dashboard
You can create your own dashboard for viewing Azure service metrics. For information on how to create dashboards, see Create and edit Dynatrace dashboards.
Available metrics
Transactions count
E2E success latency
Server success latency
Egress bytes
Ingress bytes
Blob capacity
Blob container count
Blob count
Transactions count
E2E success latency
Server success latency
Egress bytes
Ingress bytes
File capacity
File share count
File count
Transactions count
E2E success latency
Server success latency
Egress bytes
Ingress bytes
Queue capacity
Queue count
Queue message count
Transactions count
Server success latency
E2E success latency
Egress bytes
Ingress bytes
Table capacity
Table count
Table entity count
Additional notes
Azure Storage Accounts (built-in)monitors the same Azure resources asAzure Storage AccountandAzure Storage Blob/File/Queue ServicesfromCloud servicessection. For more customizable monitoring switch to the latter ones. The built-in and generic versions can't be switched on simultaneously:- Enabling the built-in version will disable all of the generic versions.
- Enabling any of the generic versions will disable the built-in version.