Upgrade from calculated service metrics to Grail
- Dynatrace Classic
- Upgrade guide
- 11-min read
This guide explains how to upgrade your existing calculated service metrics to Grail, so you can smoothly transition to Latest Dynatrace.
Why upgrade?
- Use metrics in more places: Most existing metrics are upgraded automatically to Grail, where they can be leveraged in the new
 Dashboards or
  Notebooks, or analyzed in apps such as the Services app.
 - Get more powerful dimensions: Upgraded metrics gain new dimensions that make them more powerful and easier to use in Dashboards. For details, see Calculated service metrics.
What is not changing?
- Metrics created using the Classic calculated service metrics feature remain accessible via Dashboards Classic and the Classic Multidimensional analysis.
- Calculated service metrics continue to consume your license like custom metrics. There are no changes to billing.
- You are not billed twice. When a calculated service metric is converted to Grail, you're only billed for the Classic metric or the Grail metric, not both—even if the metric is available for both Dynatrace Classic and Latest Dynatrace.
What will you do?
- Learn which Classic calculated service metrics are automatically converted to Grail.
- Manually convert Classic calculated service metrics using a toggle on the Calculated service metrics page.
- Use OpenPipeline or DQL queries to recreate the output of Classic calculated service metrics that can't be converted.
Before you begin
Prerequisites
- Access to Notebooks or Dashboards to test and validate your converted DQL queries.
Prior knowledge
- Familiarity with Metrics Classic and metric selector syntax.
- Basic understanding of Grail and DQL.
- Familiarity with creating DQL queries in Notebooks or Dashboards.
- Familiarity with metric cardinality, which is used to determine if a Classic calculated service metric can be converted to Grail. For more information, see How to upgrade below.
How to upgrade
Metrics are automatically converted or can be manually converted based on their cardinality. If the metric cardinality is within the limits (see Automatically converted metrics), it is converted automatically; if the cardinality exceeds the limits, it must be converted manually.
Cardinality is based on the number of distinct dimensions created by a metric; measurements are taken in five-minute windows and stored for two weeks. The metric's cardinality is defined as the maximum number of distinct dimensions it creates in any of these five-minute windows. If the calculated service metric is written for more than one service, cardinality is calculated on a per-service basis.
Dynatrace lets you configure a maximum number of dimension values for Classic metrics. Classic calculated metrics support at most 100 dimension values, and you can select fewer depending on your configuration.
Find your metric's cardinality
For metrics that are not automatically converted to Grail, you can find the metric's cardinality by running the following expression in  Data Explorer.
dsfm:server.metrics.calculated_metrics.number_of_values:filter(eq(metric_key, "calc:service.<your_metric_key>")):splitBy(metric_key):max
Replace <your_metric_key> with the key of your calculated service metric.
Grail calculated service metrics can have a maximum cardinality of 2000 within any 5-minute window (whether in the past two weeks, or since the last metric change). You can lower this cardinality by reducing metric splitting.
If your Classic calculated service metric is converted to Grail metrics and then its cardinality exceeds this limit, the metric won't be forwarded to Grail. The rejection will be visible in the Metric & Dimensions Usage + Rejections ready-made dashboard. Incoming data won't be stored in Grail until the cardinality returns below the limit.
Automatically converted metrics
The following Classic calculated service metrics are automatically converted to Grail metrics:
-
Classic calculated service metrics that don't have Split by dimension enabled.
-
Classic calculated service metrics that meet all of the following criteria:
- The number of metric dimension values is less than the configured maximum.
- The metric cardinality is less than 500 within any 5-minute window in the past two weeks
- The metric has existed for longer than two weeks.
Manually convert metrics
For most Classic calculated service metrics with a high cardinality, these are not automatically converted to Grail metrics because doing so might significantly increase your metric consumption.
You can either manually convert the metric or use OpenPipeline or DQL in Notebooks to effectively replicate the metric.
-
Any metric whose cardinality exceeds the configured maximum. Because Grail stores the metric's full dimension cardinality rather than capping it at the configured maximum, converting such a metric may increase the number of stored metric data points and Metrics powered by Grail consumption compared to Classic metric consumption.
-
Any metric whose cardinality has exceeded 500 in any 5-minute window in the past two weeks. Many high-cardinality metrics are used for one-off reporting without the need for a long-term historical analysis. If you don't need long-term analysis, many of these metrics can be recreated with DQL queries in
Notebooks.
To manually convert an eligible Classic calculated service metric:
- Go to Settings Classic > Server-side service monitoring > Calculated service metrics.
- Choose the calculated service metric you want to configure.
- Optional Select to open the metric's details and edit its settings, and then select Save metric.
- Toggle the option to enable the metric being sent to Grail.
- Select Save changes.
Metrics that can't be converted
Classic calculated metrics with a cardinality exceeding 2,000 can't be converted to Grail calculated metrics.
These can be recreated in OpenPipeline, see Extract metrics from spans and distributed traces, or with DQL in Notebooks if long-term historical analysis is not required.
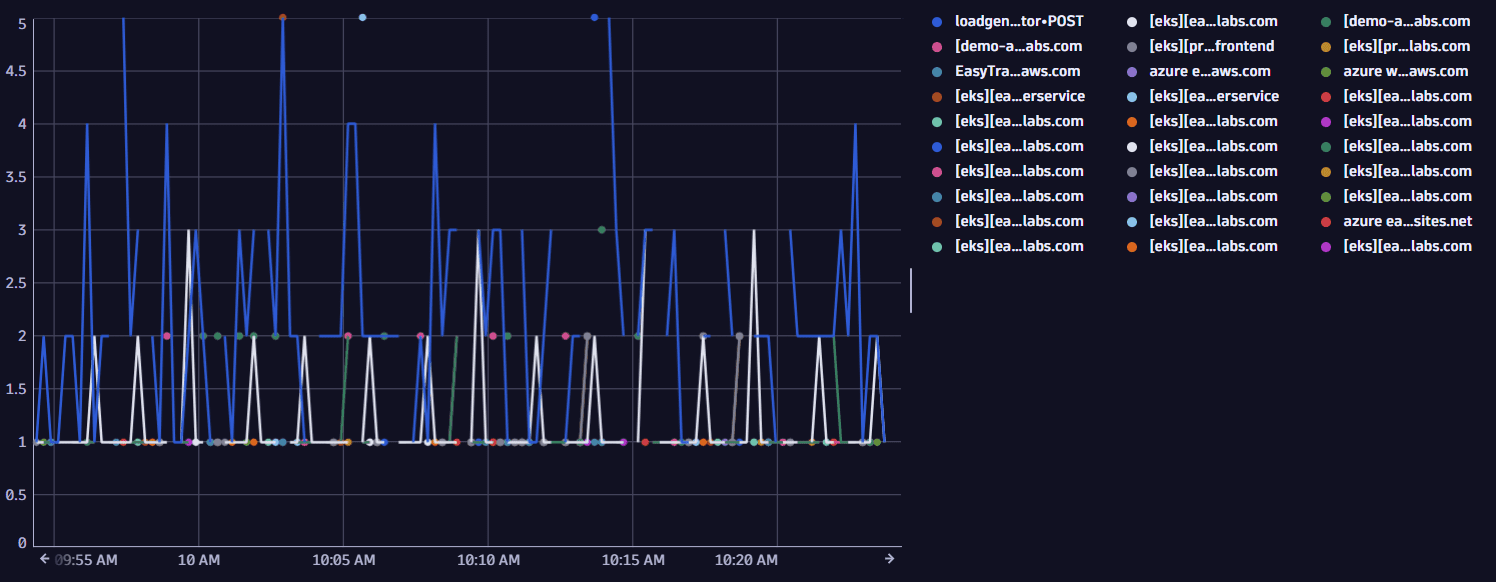
Top 30 web requests
The DQL query returns the top 30 web requests on endpoints where the services returned a 5xx response code. The timeseries should also be split by the server address to distinguish between the different servers.
Upgrading the metric to Grail is not recommended because the combination of endpoint.name and server.address has a high cardinality.
fetch spans| filter http.response.status_code >= 500 and http.response.status_code <= 599 and request.is_root_span == true| fieldsAdd entityName(dt.entity.service) // adds dt.entity.service.name// calculate multiplicity factor for every span based on sampling and aggregation| fieldsAdd sampling.probability = (power(2, 56) - coalesce(sampling.threshold, 0)) * power(2, -56)| fieldsAdd sampling.multiplicity = 1/sampling.probability| fieldsAdd multiplicity = coalesce(sampling.multiplicity, 1)* coalesce(aggregation.count, 1)* dt.system.sampling_ratio| makeTimeseries { count = count()}, by: { dt.entity.service.name, dt.entity.service, endpoint.name, server.address}// only show top 30 timeseries| sort arraySum(`count`) desc | limit 30
Sample output
Top database statements per service
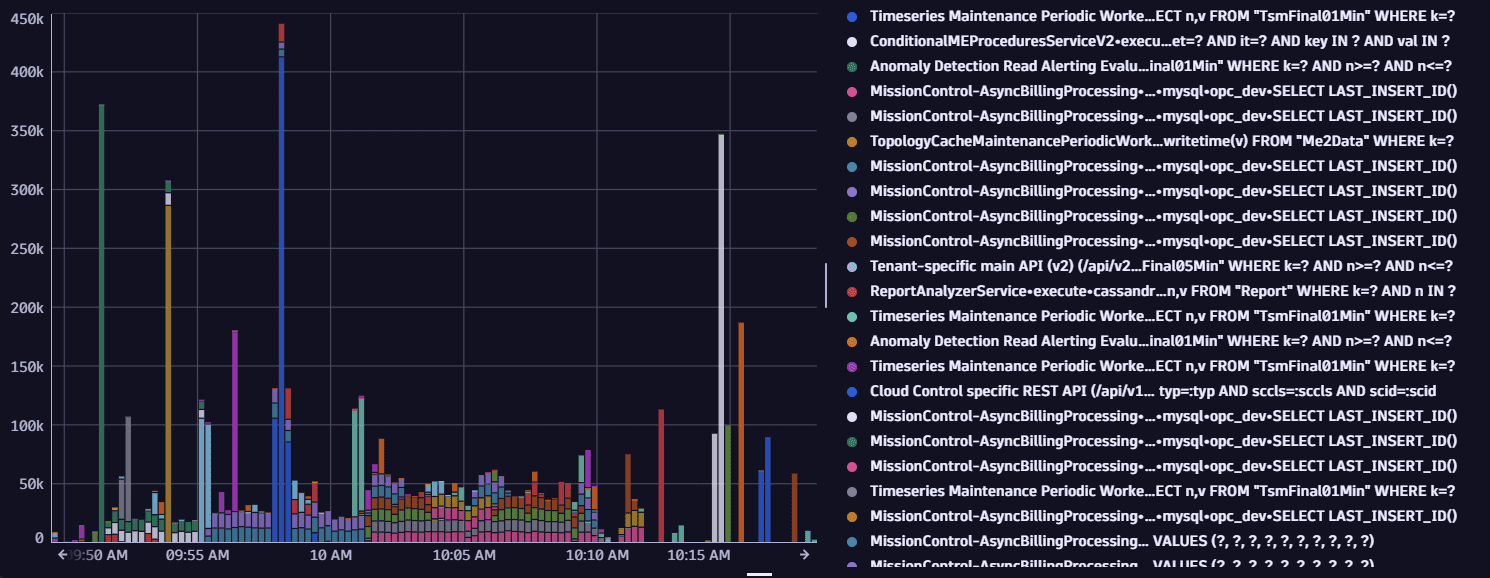
The DQL query returns the top 30 database statements executed in the environment over time.
Upgrading the metric to Grail is not recommended because db.query.text has a high cardinality.
fetch spans// filter for database spans| filter span.kind == "client" and isNotNull(db.namespace)| fieldsAdd entityName(dt.entity.service) // adds dt.entity.service.name// calculate multiplicity factor for every span based on sampling and aggregation| fieldsAdd sampling.probability = (power(2, 56) - coalesce(sampling.threshold, 0)) * power(2, -56)| fieldsAdd sampling.multiplicity = 1/sampling.probability| fieldsAdd multiplicity = coalesce(sampling.multiplicity, 1)* coalesce(aggregation.count, 1)* dt.system.sampling_ratio| makeTimeseries { db_calls = sum(multiplicity) }, by: { dt.entity.service.name, code.function, db.system, db.namespace, db.query.text }// only show top 30 timeseries| sort arraySum(`db_calls`) desc | limit 30
This DQL query also takes into account span sampling, aggregation, and extrapolation to get the real number of calls.
Sample output
Exception count by type (Exception frequency)
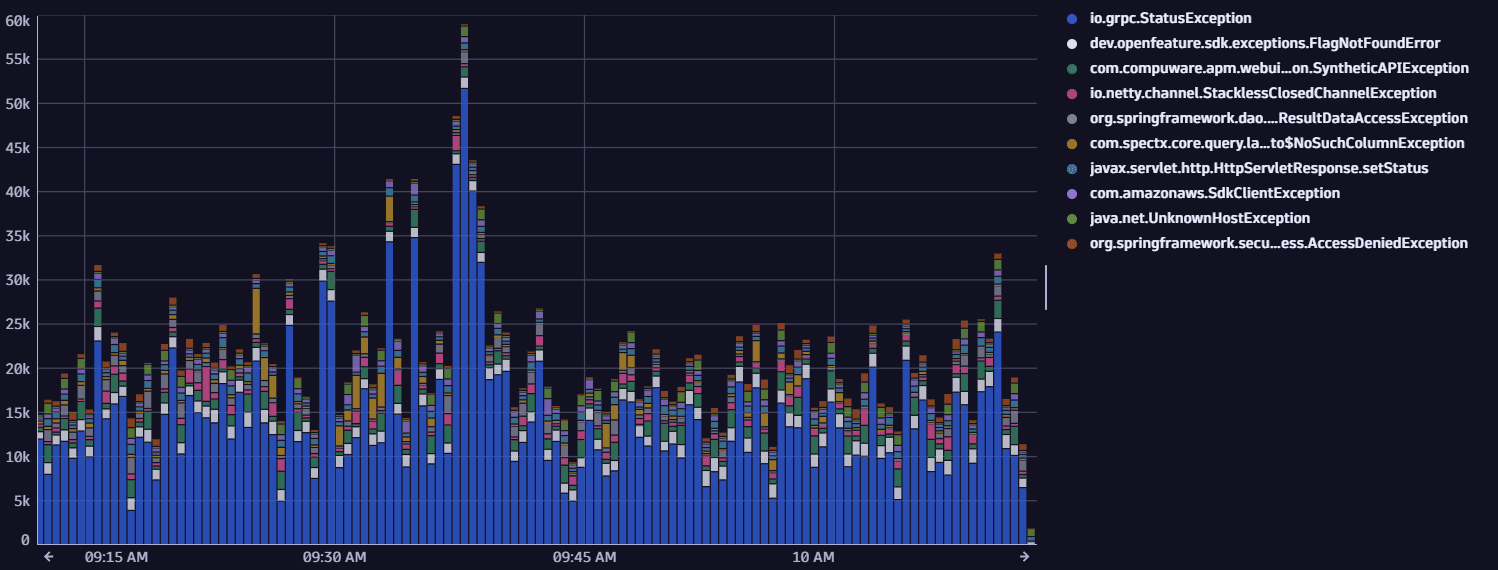
The DQL query returns the top 10 exception classes that happen in the environment over time.
Upgrading the metric to Grail is not recommended because of the high cardinality due to the exception type splitting.
fetch spans// only spans which contain a span event of type "exception"| filter iAny(span.events[][span_event.name] == "exception")// make exception type top level attribute| expand span.events | fieldsFlatten span.events, fields: { exception.type }| makeTimeseries cnt=count(), by: { exception.type }// only show top 10 timeseries| sort arraySum(cnt) desc | limit 10
This DQL query doesn't take into account sampling, aggregation, and extrapolation. For more details, refer to the database example or Advanced Tracing Analytics powered by Grail.
Sample output
Requests of a specific service split by service instance
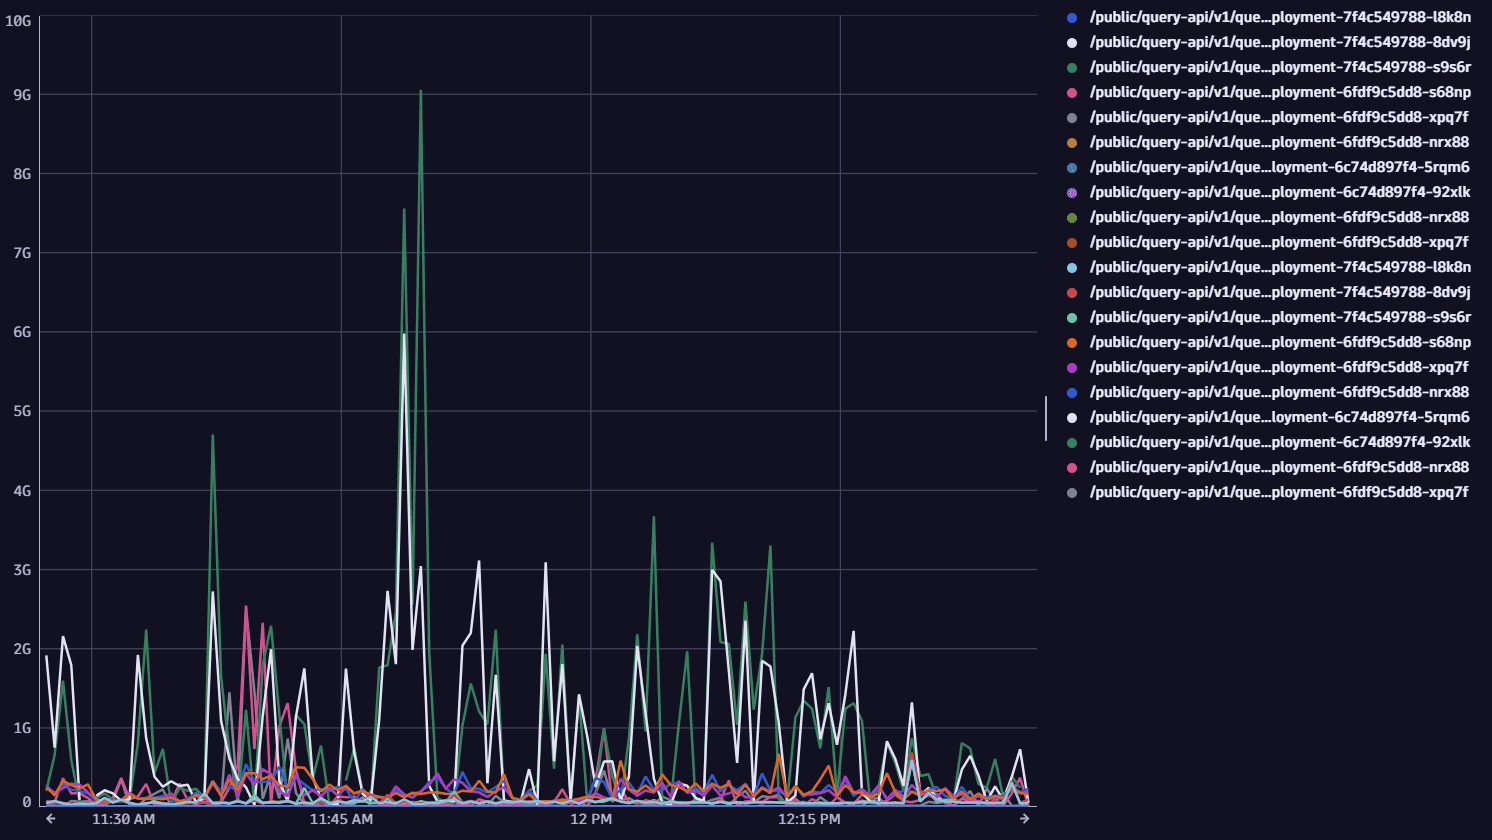
The DQL query returns the top 10 requests on service instances over time. A service instance is the combination of the service and the host or Kubernetes pod, respectively.
Upgrading the metric to Grail is not recommended because of the high cardinality due to the service instance splitting.
fetch spans// filter specific service| filter dt.entity.service == "SERVICE-20E42C3D8D3E0C62"// filter only for request root spans| filter request.is_root_span == true| makeTimeseries { requests=count(), avg(duration) }, by: { url.path, dt.entity.host, k8s.pod.name }// only show top 10 timeseries| sort arraySum(requests) desc | limit 10
This DQL query doesn't take into account sampling, aggregation, and extrapolation. For more details, refer to the database example or Advanced Tracing Analytics powered by Grail.
Sample output
Drilldown on top 10 URLs with fine-granular conditions
The DQL query returns the top 10 URLs with most failed attempts on wallet-services if a payment is involved. Payments are indicated by the request attribute PaidAmount.
Upgrading the metric to Grail is not recommended because of the high cardinality due to URL splitting.
fetch spans// filter for "failed requests"| filter isNotNull(endpoint.name) and request.is_failed == true// conditions on service display name and request attribute| filter contains(entityName(dt.entity.service), "wallet-service")| filter exists(request_attribute.PaidAmount)// count requests and split by service and url| makeTimeseries failed_request_count=count(), by: { dt.entity.service, url.full }// only show top 10 timeseries| sort arraySum(failed_request_count) desc | limit 10
This DQL query doesn't take into account sampling, aggregation, and extrapolation. For more details, refer to the database example or Advanced Tracing Analytics powered by Grail.
Sample output
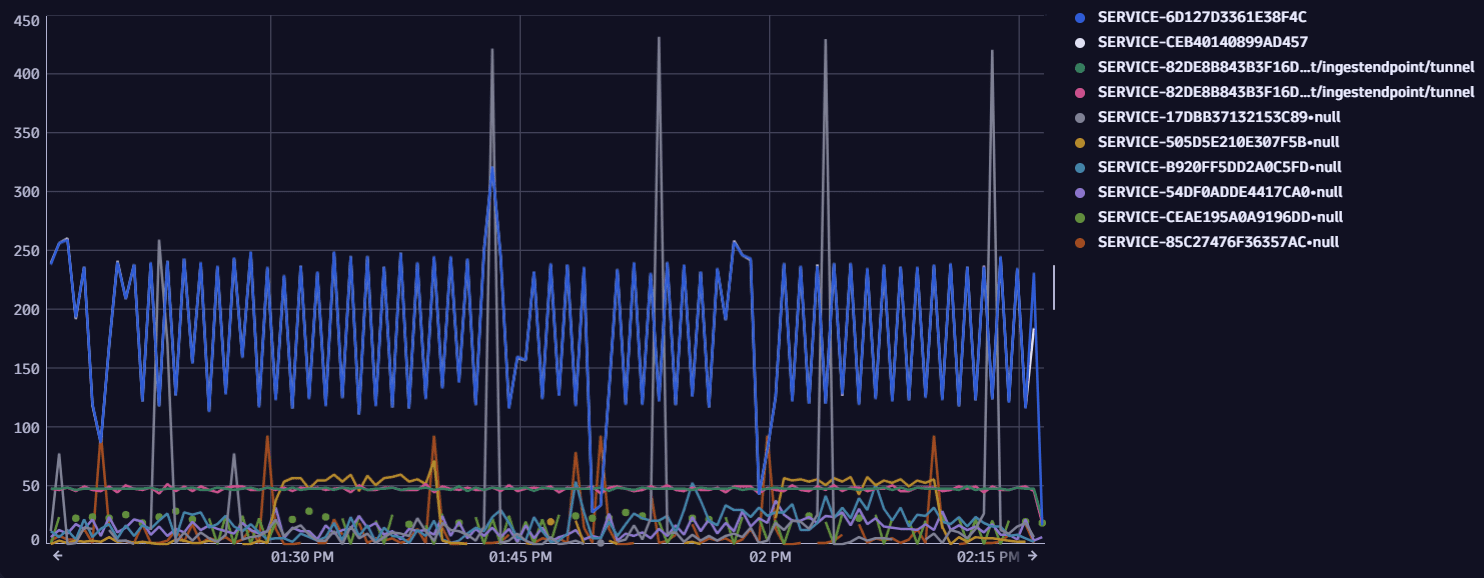
After metric conversion
Once your metric is converted, it is stored in Grail with a corresponding service.xxx metric key that preserves the Classic calculated service's metric key.
For details, see Calculated service metrics.
You can open these service metrics either via Settings Classic or directly in Notebooks:
- Go to Settings Classic > Server-side service monitoring > Calculated service metrics.
- Choose the calculated service metric from the list and select Open with.
- Select Notebooks.
- In Select destination, choose a notebook and then select Confirm.
- Notebooks opens with the calculated service metric data displayed. You can choose how to visualize the data from the options.
Some calculated service metrics may need manual adjustments to display correctly, especially failure rate metrics and request count metrics. For these, we always recommend opening via Settings Classic, as it automatically generates a DQL query you can use right away. Two examples are given below.
Failure rate metrics
In Grail, these metrics count the number of failed and successful requests by using an additional Boolean dimension "failed" (true or false). The failure rate needs to be calculated using DQL.
For example, here is a DQL query for the AEM content failure rate metric. It calculates the percentage of failed requests by dividing the number of failed requests per minute by the total number of requests per minute.
timeseries {failedNum = sum(service.aemcontentfailurerate, default: 0.0, filter: failed == true),totalNum = sum(service.aemcontentfailurerate)},by: { dt.smartscape.service }, union:true| fieldsAdd failure_rate = (failedNum[] / totalNum[]) * 100| fieldsRemove totalNum, failedNum
Request count metrics
Classic metrics used a datatype that combined a counter with a rolling average functionality. This datatype does not exist in Grail. To chart a rolling average in Grail correctly requires an additional DQL parameter.
timeseries {avg(service.wkndrequestcount, rollup: sum)}