Event analysis and correlation
- Latest Dynatrace
- Explanation
- 9-min read
Events represent different types of singular anomalies, such as a metric breaching a threshold, baseline degradations, or point-in-time events, such as process crashes. Dynatrace also detects and processes informational events such as new software deployments, configuration changes, and other event types.
Dynatrace ingests and stores events from multiple sources. Those events can trigger root cause analysis, an automation, or serve as raw data for dashboards and reports. Together with logs, metrics, and traces, events provide the input for root cause and impact analysis.
Event correlation
Event correlation automates the analysis of the flood of individual events coming from thousands of various sources and tools. It supports events coming from OneAgent, external alerting tools, cloud platforms, and hundreds of observability integrations available through Dynatrace Hub.
The goal of event correlation is to extract problems from incoming events and derive actionable insights, allowing your teams to remediate incidents quickly.
Event processing and analysis
Event processing and analysis in Dynatrace is a multi-step process that, from incoming events, raises problems, showing the root cause and business impact. It includes the following steps:
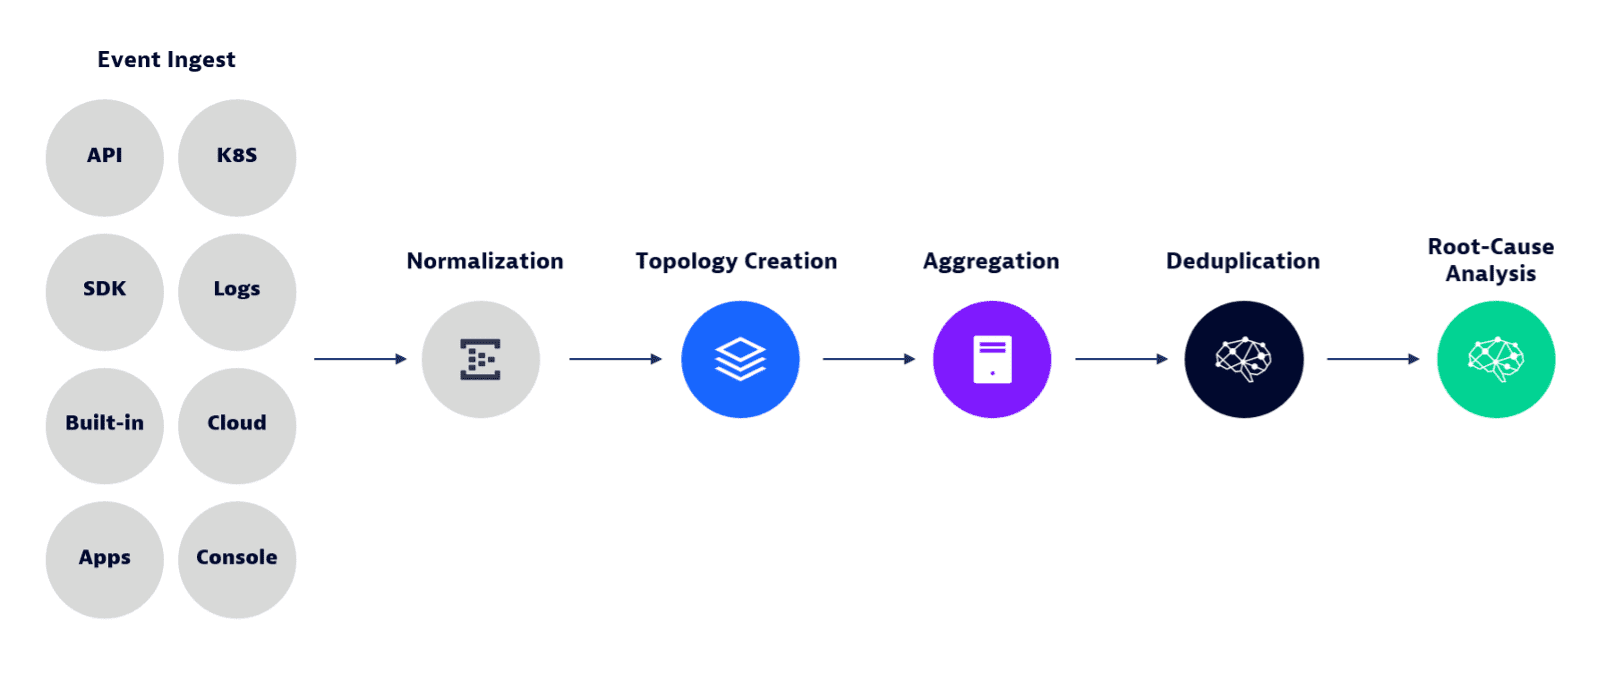
Event ingestion
As a full-stack observability platform, Dynatrace offers a wide spectrum of event sources, including OneAgent, built-in integrations, and ingestion from third-party tools. For more information, see Ingest data. Latest Dynatrace also offers OpenPipeline for your ingestion purposes. For more information, see OpenPipeline.
Event normalization
Event normalization transforms all ingested events into the same semantic format, which enables Davis AI to correlate this data.
In event normalization, basic event property constraints are evaluated to make sure, for example, that:
- Event creation time is valid
- Event type is valid
- Names of event properties are unique
Normalization also ensures that incoming event properties are mapped correctly to the Dynatrace Semantic Dictionary.
If the event source attached references to existing entities, normalization ensures that these references are correctly mapped to your Smartscape topology.
Topology creation
Smartscape topology is a real-time representation of all the causal relationships within a running software environment, including deployment information as well as highly dynamic trace relationships. The topology is automatically created and updated from ingested data such as metrics, events, logs, and traces.
All the built-in technology support in Dynatrace comes with automatic topology creation capabilities—you don't have to configure anything manually. Moreover, you can use custom topology extraction to automatically create the topology and relationships from ingested data such as events. Custom topology creation works independently from OneAgent and doesn't even require a running OneAgent instance. You can easily implement your own domain-specific models based on the ingested data.
To learn how to implement a custom topology model, see Custom topology model.
Aggregation
Aggregation collects and routes all incoming data from various sources into a single location. For example, it consolidates events, logs, metrics, and traces of a Kubernetes workload and presents it in a single workload-related location.
Dynatrace aggregates data on top of the dynamically created topology. Every observed entity has a dedicated entity page summarizing all collected data in a single location, ensuring a consistent view of data from multiple sources.
Additionally, the topology enables dynamic listing of all related entities in that view. For example, a host can show a list of disks, network interfaces, and process group instances running on the host.
Deduplication
Deduplication attempts to group multiple events into a unified problem where all the events share the same root cause. For example, a single failing backend service can cause hundreds of upstream services to report violation events. Deduplication automatically groups all those events into a single problem. By default, Dynatrace deduplicates events on source, over time, and on causal topology.
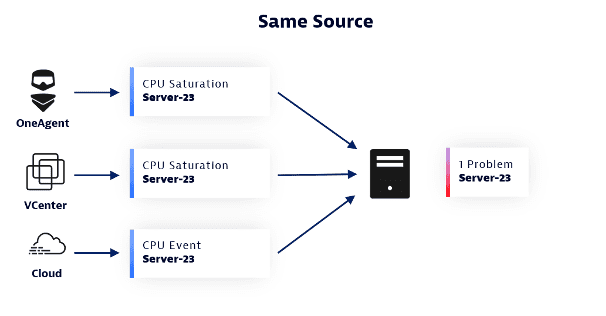
Deduplication on event source
In deduplication on event source, events are grouped when they are of the same semantic type and from the same source. (Note that "source" here means the monitored entity reporting the event, not the tool that captured the event).
The image below shows an example where three different tools report three events of the CPU saturation semantic type from the same source (Server-23) at the same time. In this case, Davis AI deduplicates all three events into a single problem. The same logic applies to all entity types in Dynatrace.
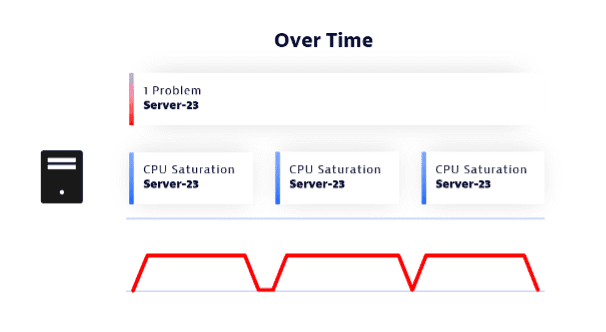
Deduplication over time
In deduplication over time, events are grouped when they are of the same type and from the same source, but with slightly different start times.
Dynatrace anomaly detection offers a 3-out-of-5-minutes observation time window to keep events active during detected anomalies. The observation window prevents noise from multiple single events in case of anomaly fluctuation. You can adapt the sensitivity of the observation window. Increasing sensitivity produces more noise, decreasing leads to events that stay open for longer. Deduplication over times further reduces the event noise by grouping the same violation events into a single problem.
The image below shows an example in which three CPU saturation events fluctuate over time. Davis AI deduplicates them into a single problem.
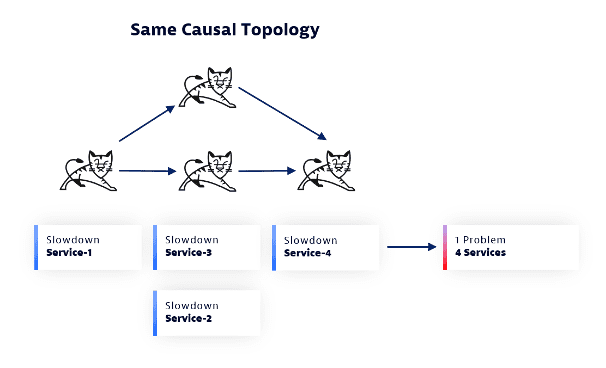
Deduplication over the causal topology
In deduplication over the causal topology, events are grouped if they were reported for the same situation. The "same situation" here means that all those event sources are part of a causal graph within the Smartscape topology. The causal graph can include the vertical deployment software stack or the horizontal service-to-service call relationships.
The image below shows an example where a frontend service, directly and indirectly, calls three other services. All those services show a slowdown event around the same time. Davis AI analyzes the causal topology of those four services and concludes that the four events belong to the same anomaly, so Davis AI groups the four events into a single problem.
Note that the causal topology can span hundreds of entities where their events vary over time due to individual observation windows and load situation.
Deduplication of events based on the causal topology is a highly sophisticated process that, due to its nature, already belongs to the root cause analysis step.
Custom-defined event correlation
While event correlation and deduplication are fully automatic, some use cases require more fine-grained control of deduplication. To achieve that, you can use Davis control properties of ingested events. For example, dt.event.allow_davis_merge defines whether Davis can merge events into a larger problem. Such properties are agnostic to the ingestion channel. See the list of available properties below.
Property
Type
Description
dt.event.allow_davis_merge
Boolean
The event can be merged into an existing problem (true), or a new problem must be created for it (false).
dt.event.allow_frequent_issue_detection
Boolean
Davis frequent issue detection is active (true) or inactive (false).
If frequent issue detection is active, Davis can mute frequently occurring events, preventing event noise.
dt.event.allow_entity_remapping
Boolean
Event remapping is active (true) or inactive (false).
If remapping is active, Davis can remap the incoming event to a new entity type extracted from event properties.
dt.event.is_rootcause_relevant
Boolean
Davis can (true) or can't (false) consider the event in root cause analysis.
dt.event.suppress_problem
Boolean
Problems suppression is active (true) or (false) inactive.
If suppression is active, Davis doesn't raise a problem and doesn't trigger event correlation and deduplication for the event. The event is stored and visualized in Dynatrace, but no problem is raised and analyzed based on it.
dt.event.timeout
String
The timeout (in minutes) of the event. It defines the time period until a refresh must arrive from the event source. If no refresh is received, the event is closed with the change reason TIMED_OUT.
Additionally, the processing of events can be influenced by the event sender or the source using event.davis field defined in the Semantic Dictionary. For more information, see Semantic Dictionary.
Root cause analysis
Root cause analysis automatically evaluates all captured and ingested information and highlights entities within the causal topology identified as the root cause of a complex situation.
During the analysis, Davis AI traverses the causal topology, visits each affected entity, and evaluates all the findings, such as events and their severities. In addition, Davis root cause detection triggers on-demand analyses of metrics from the affected entities to identify abnormal behavior by automatically detecting metric change points.
Metric change point detection not only confirms or rejects metric-based events, but also discovers additional unknowns in metrics without an active custom alert.
After all related problems are identified, a ranking algorithm identifies the highest-ranking root cause candidate. The highest-ranking entity, along with its vertical stack, is presented as the root cause of the problem.
In the latest Dynatrace, a Davis problem in Grail might, in some cases, have more affected entities compared to the corresponding problem in the previous Dynatrace. This current approach provides a more detailed and accurate representation of the problem's impact.
- In the previous Dynatrace, during root cause analysis, any change point findings on entities without events were not treated as an affected entity.
- In the latest Dynatrace, all change point findings are ingested to Grail as Davis events.
This difference can become apparent when, for example, comparing health tile results in Dashboards Classic to the corresponding results in the latest Dynatrace.
Business impact
In addition to finding the root cause of the problem, Davis traverses the causal graph in reverse to find all affected entry point applications and services. These entry points are also part of the affected topology and are touch points for real user experience.
Business impact analysis shows the number of potentially affected real users (collected from the incoming traces), the number of traces, and their service endpoints. It also provides a statistical evaluation of how strongly the individual endpoint and user actions are affected by the problem.