Troubleshoot common health problems of Kubernetes workloads
Latest Dynatrace
Even with a reliable infrastructure, issues can arise, leading to service degradation or, in worst-case scenarios, user-facing errors. Kubernetes experience offers a suite of tools to visualize and troubleshoot issues, helping to catch problems before they escalate.
This guide is tailored for Ops, DevOps, and DevSecOps professionals managing Kubernetes clusters. A basic understanding of Kubernetes concepts such as resource requests/limits, pods, and nodes is assumed, though expertise in Dynatrace or cluster management is not required.
Scenario
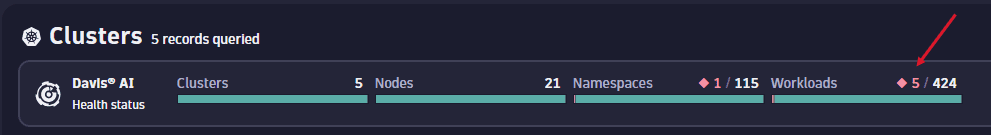
- Error or warning indicators appear for clusters and workloads in the Kubernetes app.
- The Davis AI health status displays yellow or red for certain workloads, nodes, or clusters.
Prerequisites
- Access to a Kubernetes cluster.
- New Kubernetes experience configured.
Identify and troubleshoot health issues
The following steps will guide you through the phases of identifying problematic workloads on your clusters and the process of remediation.

Identify problematic workloads

Analyze workload problems

Resolve workload problems

Investigate infrequent workload problems
Identify problematic workloads
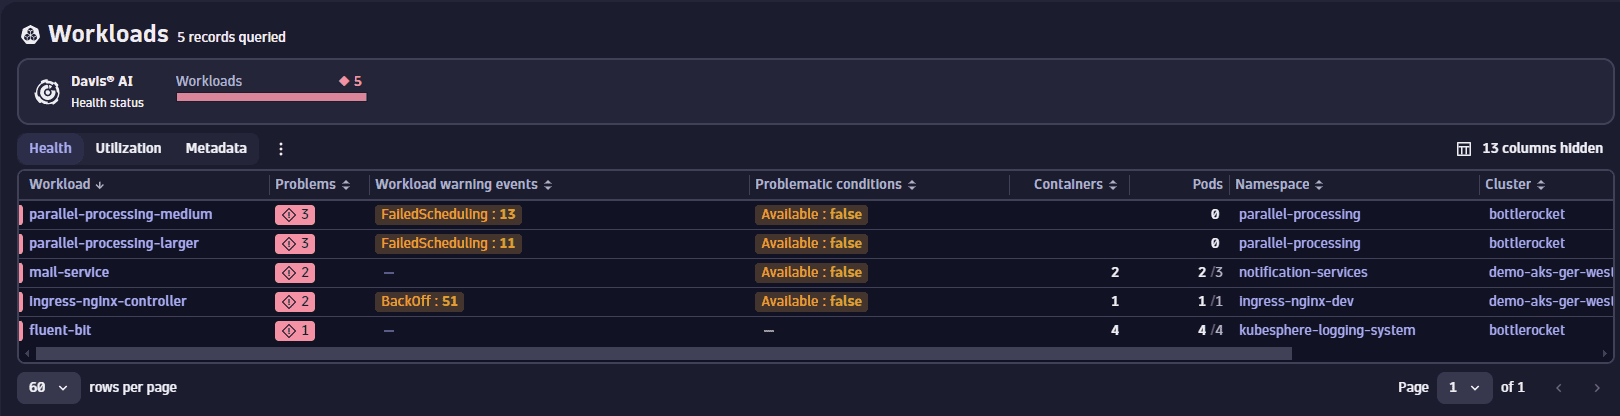
Select the red number within the workload tile to apply a filter displaying all currently unhealthy workloads across your monitored clusters.
Among the listed workloads, you can see that ingress-nginx-controller is displaying signs of trouble. Given the significant impact a malfunctioning ingress controller can have, we select it for a more detailed investigation.
Analyze workload problems
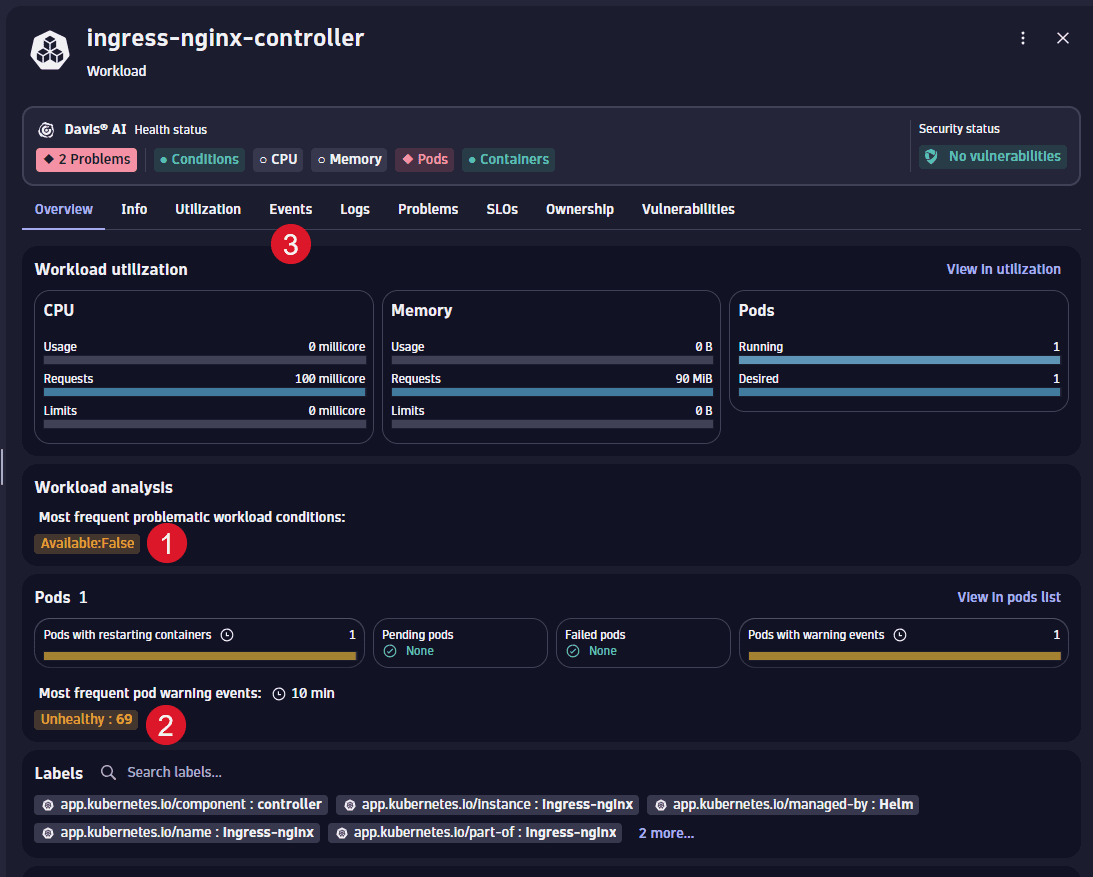
We've identified an important workload displaying problems that are causing it to be unhealthy. To understand the underlying issues better, we'll take a closer look at this workload.
The overview of the workload highlights several high-level issues it's facing:
- The workload is currently unavailable.
- Recent events, within the last 10 minutes, indicate numerous instances of pod being unhealthy, likely contributing to the workload's unavailability.
- To gain more insights, we proceed to analyze the specific events related to the workload.
The events tab presents a graph displaying the number of recent events by type, alongside a table detailing these events.
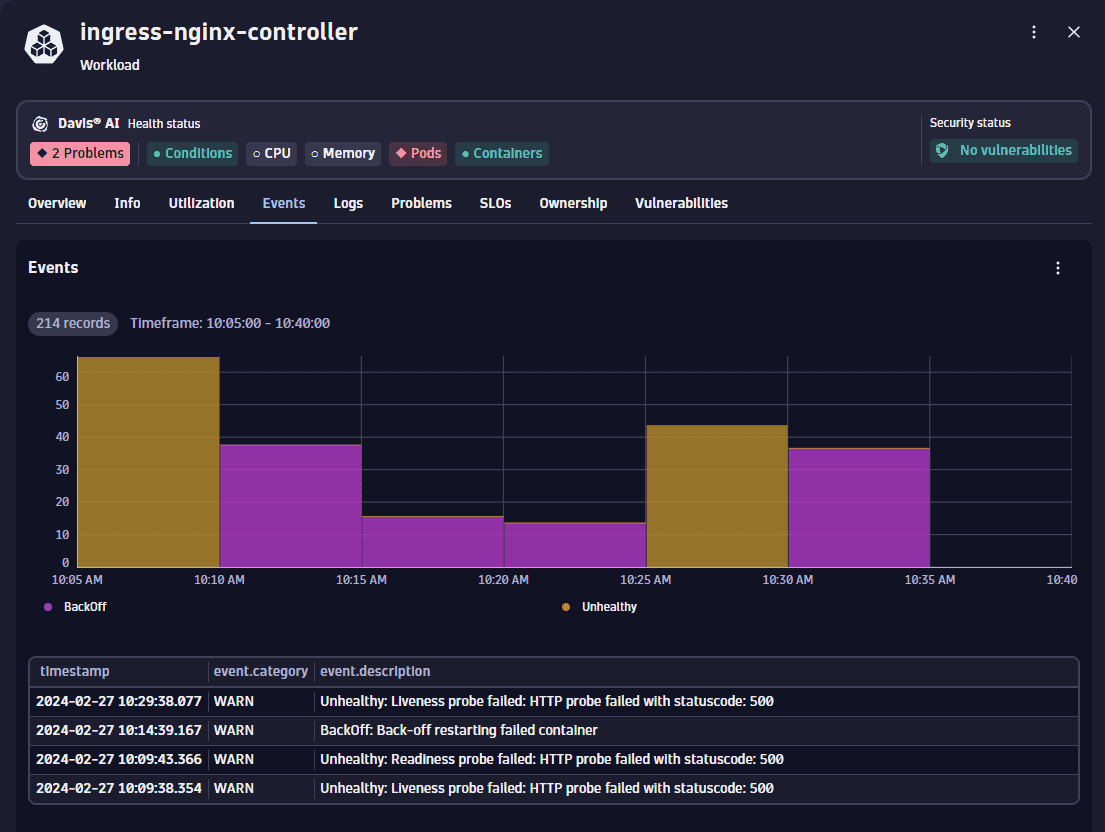
Two primary event types are observed: Unhealthy and Backoff. The Backoff events typically follow Unhealthy events, triggered when Kubernetes attempts to restart a pod due to a failed liveness probe.
A detailed examination of the Unhealthy events reveals important insights. Specifically, the event descriptions indicate that the endpoints for the readiness and liveness probes are returning HTTP 500 errors. This suggests the server inside the pod is starting but encounters issues. Conversely, a connect timeout error would imply the server isn't launching at all.
To get to the root cause of these liveness probe failures, we switch to the logs tab for an in-depth review of the container's logs.
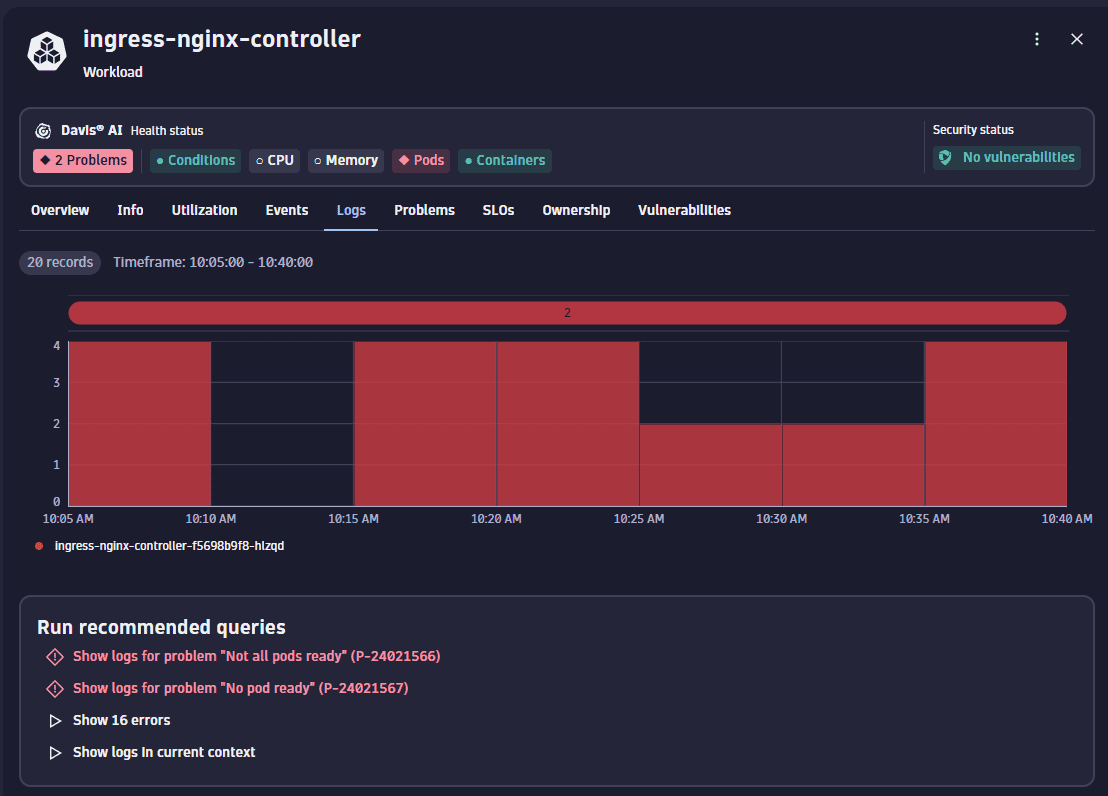
On this page, Kubernetes app provides suggested queries that could help in diagnosing the identified issue. Given that we're encountering HTTP 500 errors, it's reasonable to expect corresponding error entries in the logs. Therefore, we select Show 16 errors option from the recommended queries.
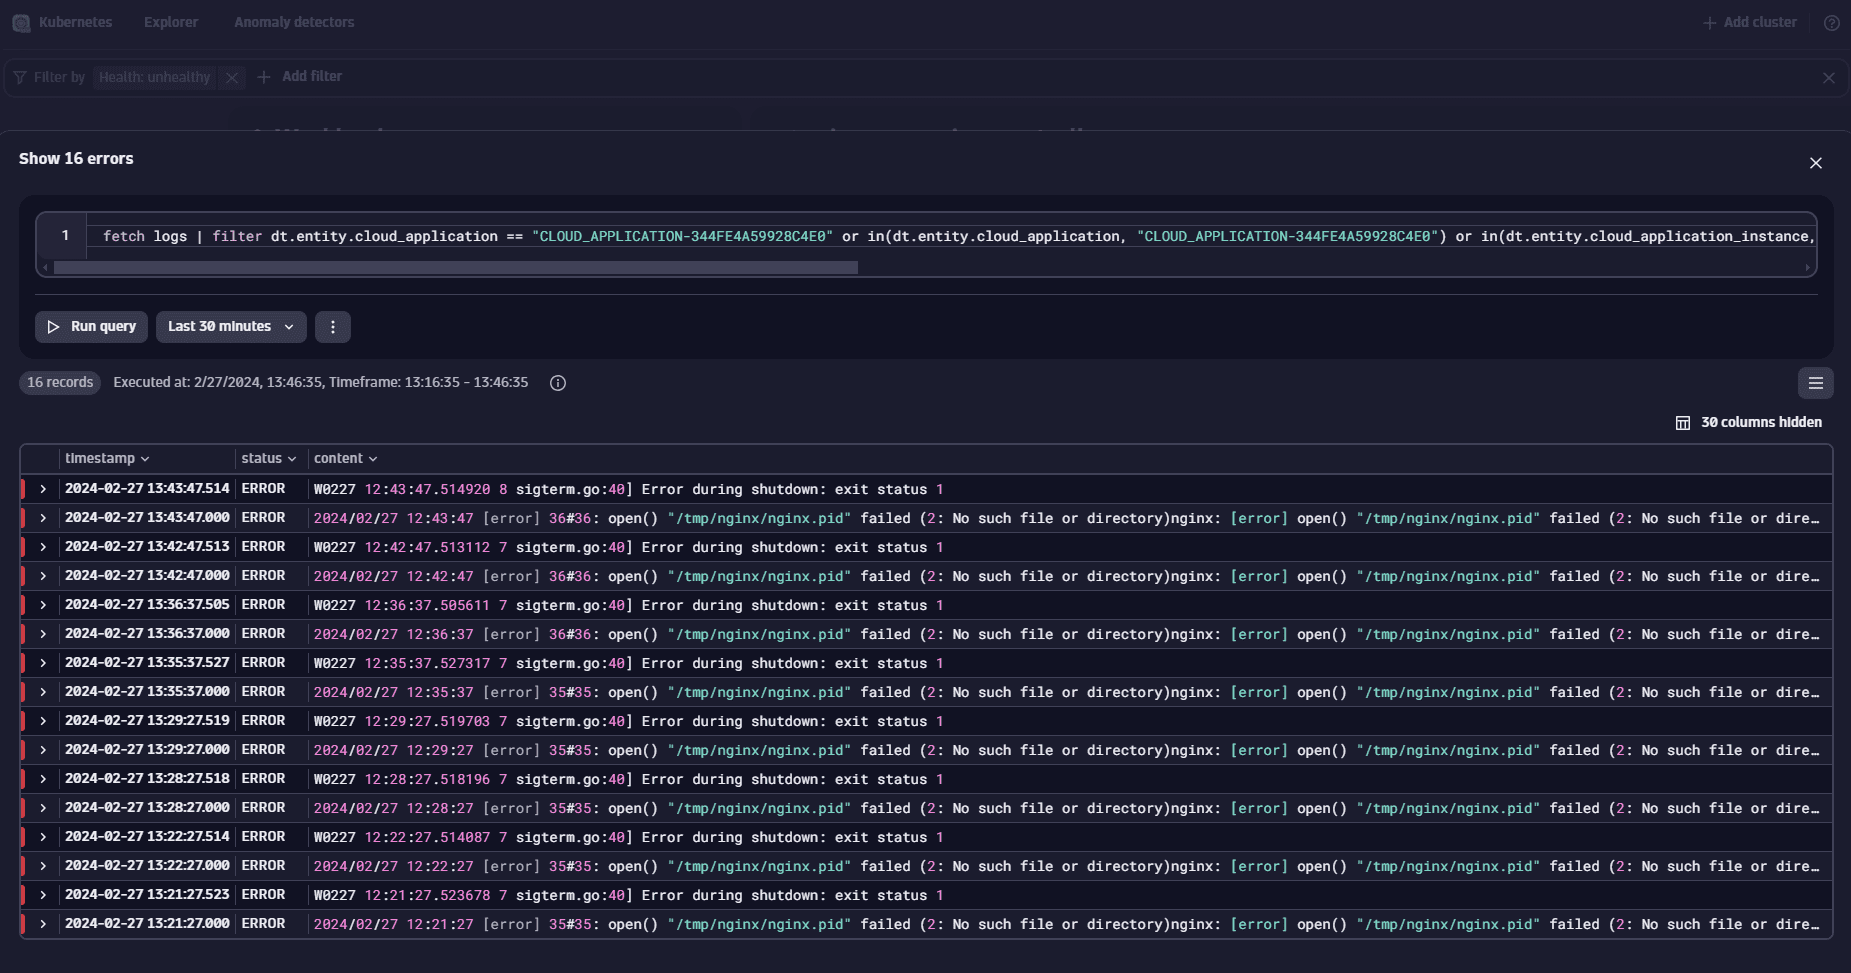
Resolve workload problems
We've identified an error message that appears to be contributing to the workload's unhealthy state. However, to ensure we haven't missed any details, we can expand our view to include the surrounding log lines by selecting one of the identified errors.
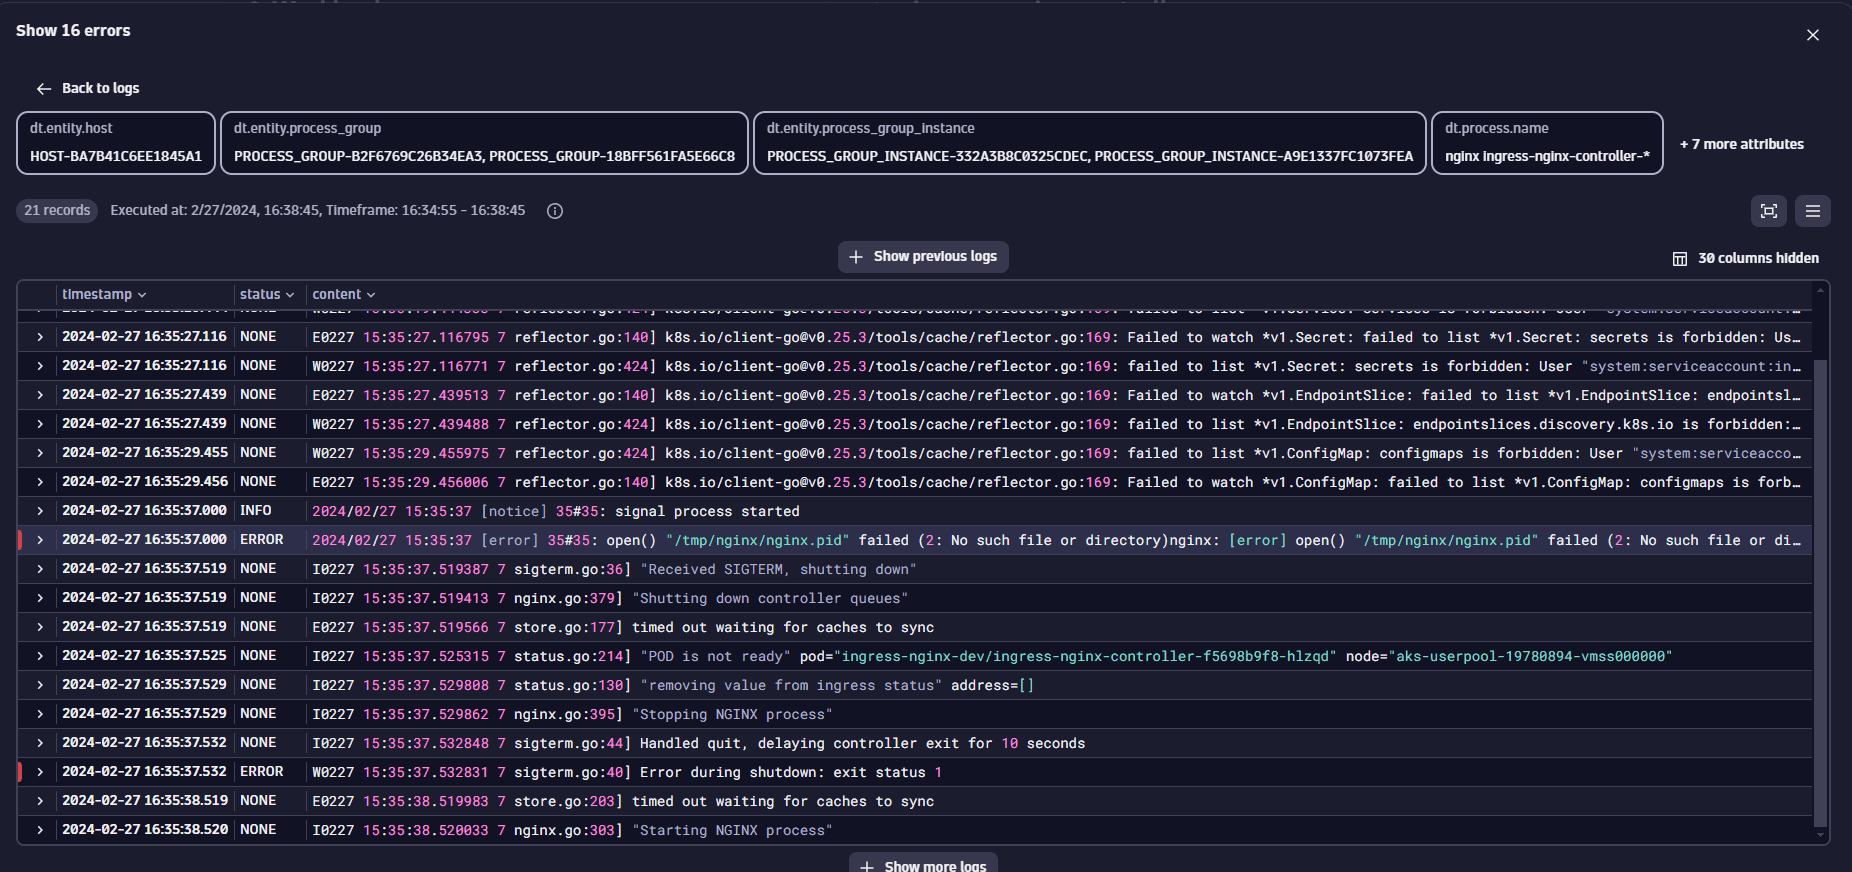
Upon examining these surrounding logs, we discover numerous errors, suggesting that the initial error message may not be the root cause of the issue.
Investigate infrequent workload problems
Most problems can be found and investigated by following the steps outlined above. However, some issues might be more complex because they don't happen regularly or occur far apart. Dynatrace helps in overcoming these challenges by highlighting key metrics and providing insightful highlights in the Kubernetes app.
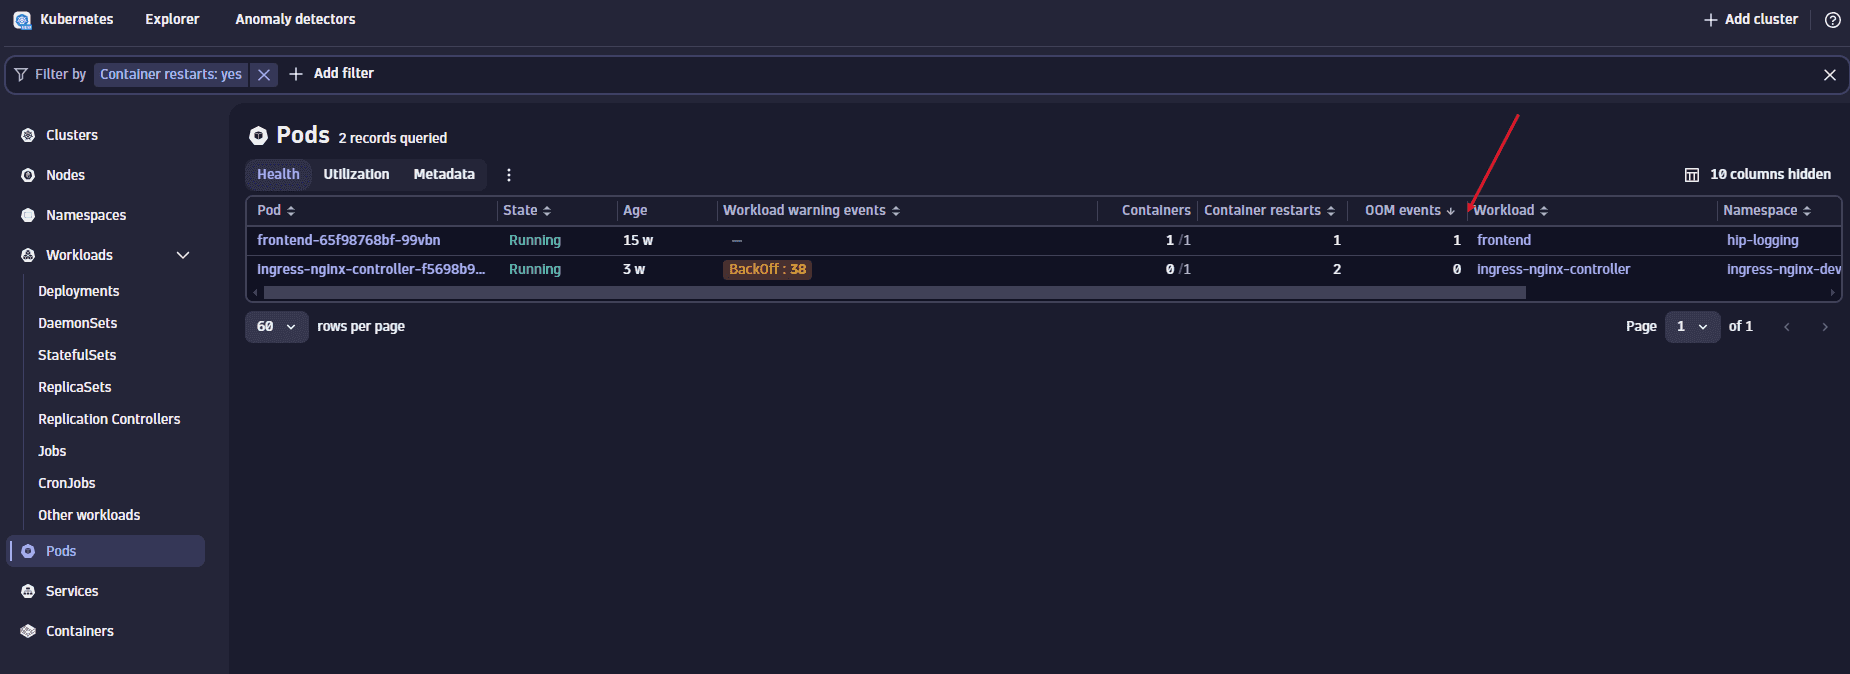
A common and potentially troublesome issue involves containers being OOM killed. Dynatrace can help you detect such incidents. Within the workload list's health perspective, there's a specific column displaying OOM kill events for each workload.
Given that the Kubernetes app displays the current state of your Kubernetes environment, we can leverage the power of DQL for identifying workloads with OOM kills over any selected timeframe.
This is achieved using Notebooks, where the following DQL query is added.
fetch dt.entity.cloud_application| fields id, workload.name = entity.name, workload.type = arrayFirst(cloudApplicationDeploymentTypes), cluster.id = clustered_by[dt.entity.kubernetes_cluster], namespace.name = namespaceName| lookup [fetch dt.entity.kubernetes_cluster| fields id, cluster.name = entity.name, cluster.cluster_id = kubernetesClusterId | limit 20000], sourceField:cluster.id, lookupField:id, fields:{cluster.name}| lookup [timeseries values = sum(dt.kubernetes.container.oom_kills), by:{dt.entity.cloud_application}| fieldsAdd container_oom_kills = arraySum(values) | limit 20000], sourceField:id, lookupField:dt.entity.cloud_application, fields:{container_oom_kills}| lookup [timeseries values = max(dt.kubernetes.container.limits_memory, default: 0), by:{dt.entity.cloud_application}| fieldsAdd hasLimits = arrayLast(values) > 0| fieldsAdd limitsChanged = arraySize(arrayDistinct(arrayDelta(values))) > 2| limit 20000], sourceField:id, lookupField:dt.entity.cloud_application, fields:{hasLimits, limitsChanged}| filter container_oom_kills > 0| sort container_oom_kills desc
This query generates a table listing workloads that had OOM kills within the last 7 days, including details on whether they have memory limits set and if those limits have changed during the timeframe.
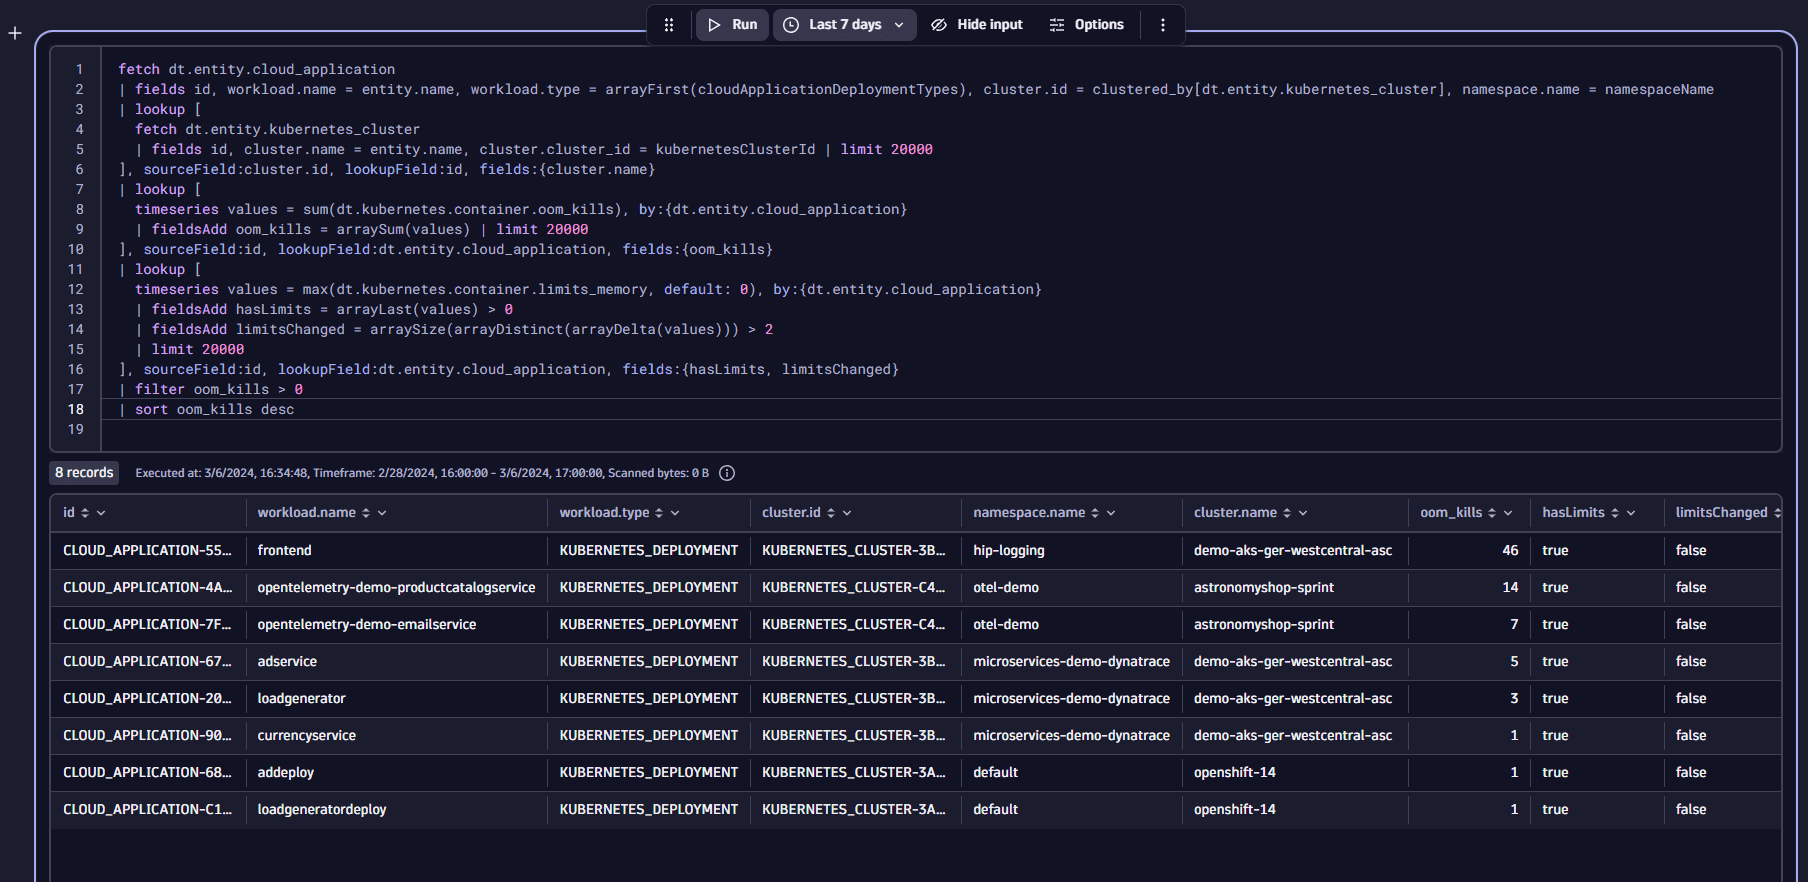
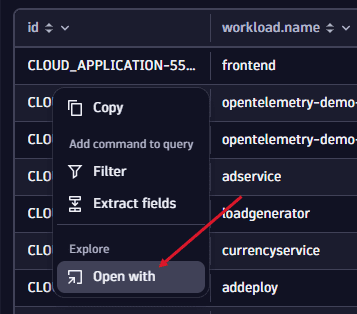
Upon finding a workload with 46 OOM kill events in the last week, we proceed with a deeper examination. The table provides all necessary details such as cluster, namespace, and name, to identify the workload. To easily open that workload in the Kubernetes app, just click on the id and select Open with, then select the new Kubernetes app.
Inspecting the Utilization view reveals that the workload recently reached its memory limit.
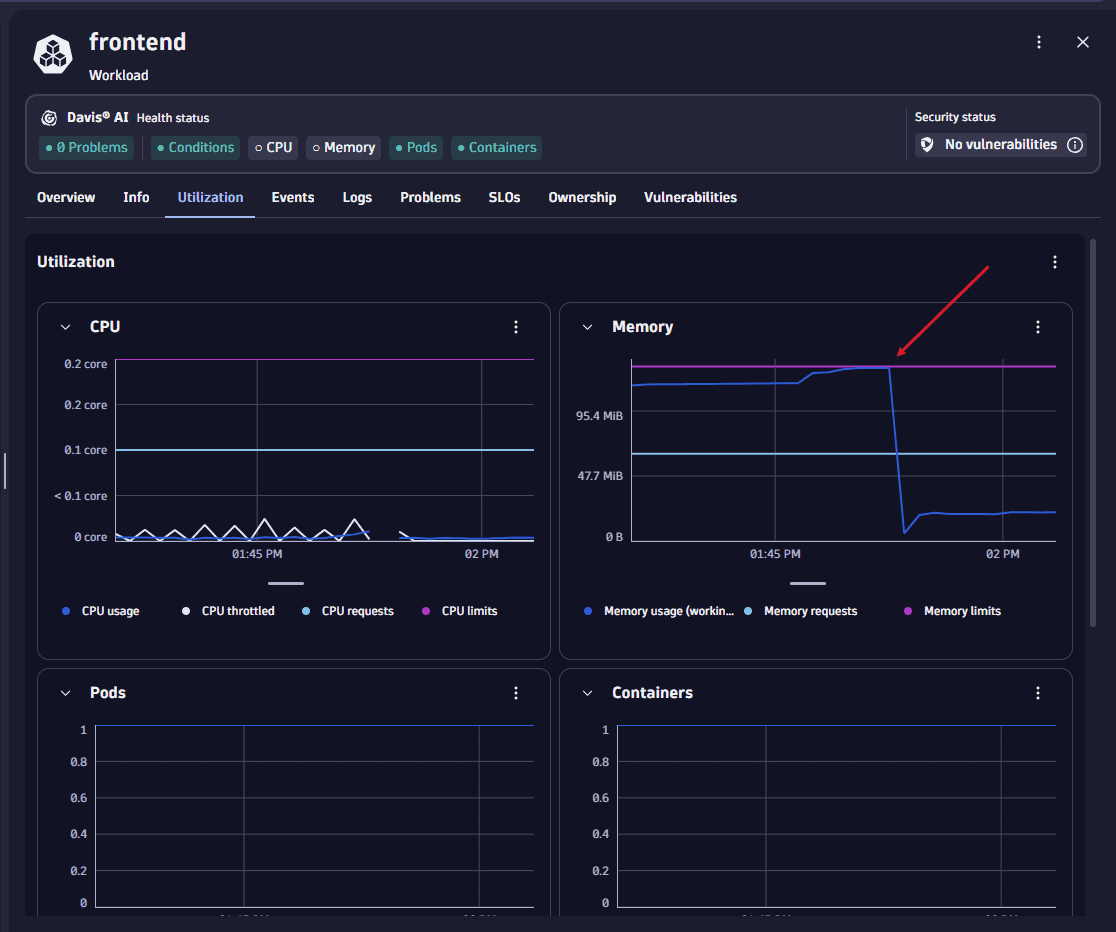
To determine whether this is an isolated incident or part of a recurring pattern, we analyze the data over an extended period in Notebooks.
The analysis makes it evident that this workload consistently approaches or exceeds its memory limits, leading to the observed OOM events. This situation suggests the set limits might be too low or that a recent update could have introduced a memory leak.