Leverage user action and user session properties for web applications
- How-to guide
- 3-min read
- Published Jan 27, 2022
User action properties and user session properties provide a powerful and flexible means of adding information to each user action and user session. You can leverage these properties for deeper visibility into all the details of your users' interactions with your application.
Action and session properties are metadata key-value pairs that are derived from captured data. This metadata is "promoted" from request attributes, CSS selector attributes, meta tags, and more. Action and session properties come in handy when you need to create powerful queries, segmentations, or aggregations on captured metadata. You can use action and session properties to create calculated application metrics. You can also view these properties on the multidimensional analysis page, the User sessions page, and the User sessions query page.
See the sections below to learn where you can find the values that are captured as custom user action and session properties and how you can take full advantage of these properties.
Before you can leverage user action and session properties, you need to define these properties in your application settings. For details, see Define user action and user session properties for web applications.
User session analysis
The User sessions page offers the option to filter user sessions by action and session properties. For example, if you're running a loyalty program, you can add a loyalty_status property to learn whether a user in a monitored user session is a Silver, Gold, or Platinum member. You can then filter for Platinum or Gold customers on the User sessions page.
-
Go to Session Segmentation (previous Dynatrace) or
 Session Segmentation.
 -
In Filter by, select one of the property types, for example, Session date properties or User action string properties, and then choose the required property.
-
Select the property value or values according to your needs.
-
Select a session to view its details and the available session properties.
-
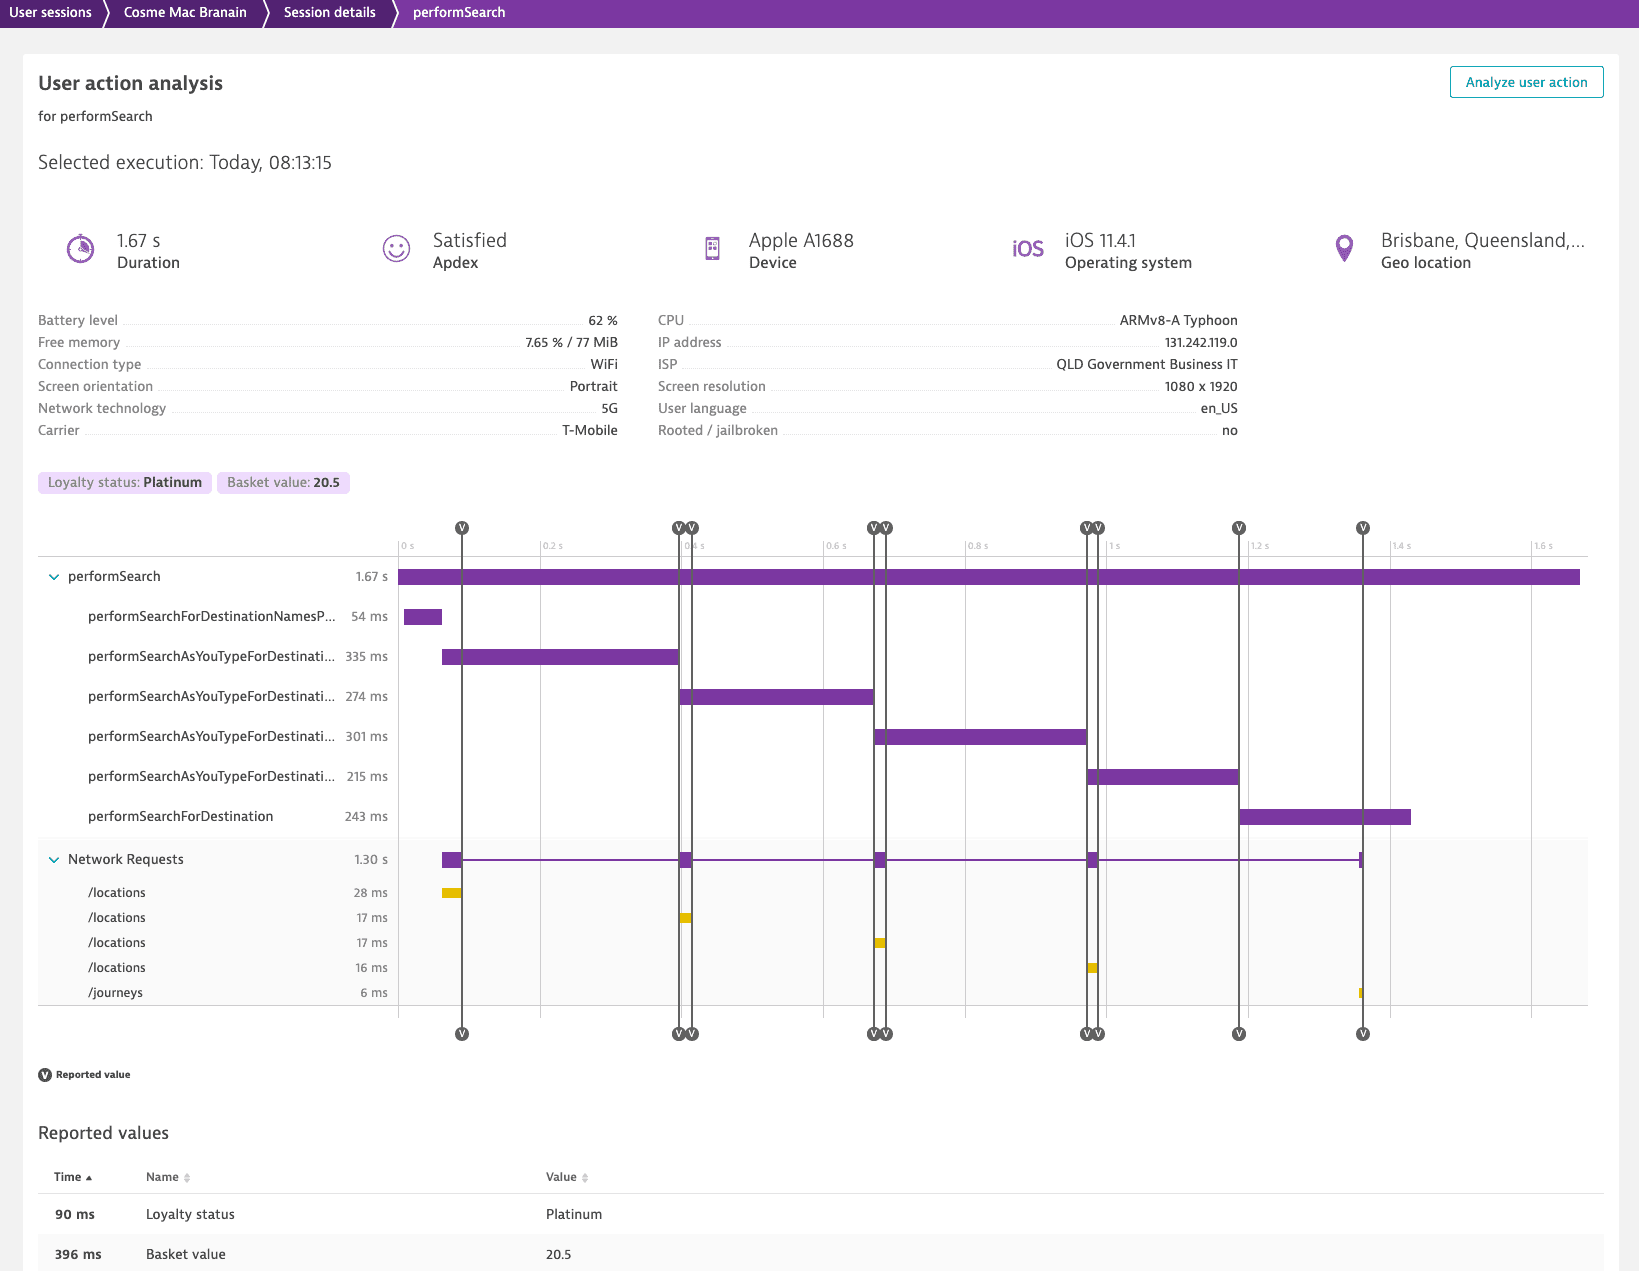
From the user session details page you can drill down into user actions. Expand a user action, and then select Perform waterfall analysis. From this page, you can check the available action properties as well as all reported values.
-
In the upper-right corner, select Analyze user action to dive even deeper. Under User action properties, select the action property for further analysis.
Additional insights with USQL
User action and session properties can greatly improve your analytics capabilities when using the Dynatrace User Sessions Query Language (USQL) for analytics that require advanced filtering or persistent filtering across analysis views. Also, when you want to keep track of the monetary values and conversion goals that are key to the success of your business, you can construct queries based on the unique values of the individual user action or session properties that have been defined for your environment.
To use action and session properties in USQL
-
Go to Query User Sessions (previous Dynatrace) or
 Query User Sessions.
 -
Enter the required query. The following custom properties are available:
Custom property Table Action property Session property <dataType>Properties.<propertyKey>useraction<dataType>Properties.<propertyKey>usersessionuseraction.<dataType>Properties.<propertyKey>useractionuseraction.<dataType>Properties.<propertyKey>usersessionusersession.<dataType>Properties.<propertyKey>useractionusersession.<dataType>Properties.<propertyKey>)usersessionThe
<dataType>part can take the following values:stringlongdoubledate
-
Select Run query.
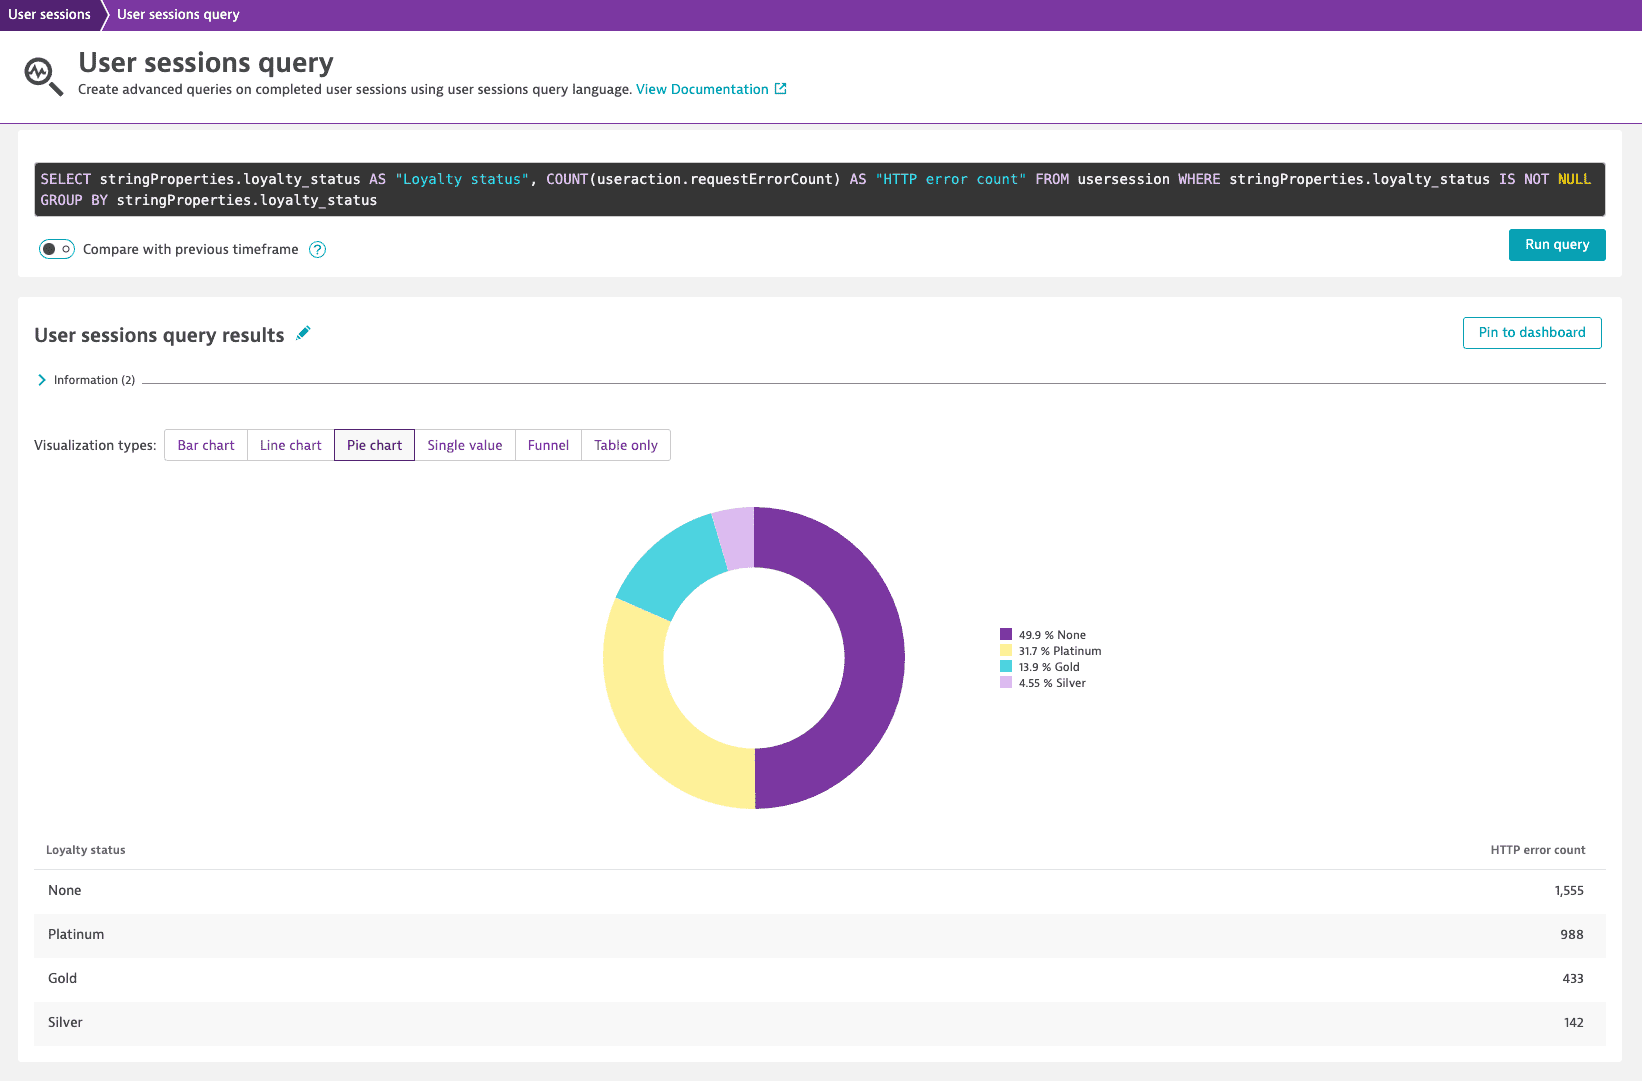
In the example below, you can see how many request errors the Silver, Gold, and Platinum customers have faced.
SELECT stringProperties.loyalty_status AS "Loyalty status", COUNT(useraction.requestErrorCount) AS "HTTP error count" FROM usersession WHERE stringProperties.loyalty_status IS NOT NULL GROUP BY stringProperties.loyalty_status
Integration via User session API
The User sessions API, in combination with our User Sessions Query Language (USQL), enables you to access all user action and session data, including properties and values.
Extending the loyalty program example above, you can leverage the problem information and loyalty status information via the User session API by querying the user sessions that were impacted by the problem after the problem was closed. This allows you to use the information to, for example, set up personalized marketing campaigns.
Here are some sample queries you may want to leverage:
-
Gold member user sessions on an application within a certain timeframe—you can leverage this for problems that impact an entire application.
SELECT userId, stringProperties.loyalty_status FROM usersession WHERE stringProperties.loyalty_status = "Gold" AND userType = "REAL_USER" AND useraction.application = "easyTravel" AND startTime > 1531741985241 AND endTime < 1531932305287 -
Platinum member users on a specific application hitting a specific page within a certain timeframe—you can leverage this for problems that impact a specific page.
SELECT userId, stringProperties.loyalty_status, useraction.targetUrl FROM usersession WHERE stringProperties.loyalty_status = "Platinum" AND userType = "REAL_USER" AND useraction.application = "easyTravel" AND startTime > 1531741985241 AND endTime < 1531932305287 AND useraction.targetUrl = "https://easytravel.perform-2018.dynalabs.io/special-offers.jsp"
Dashboards
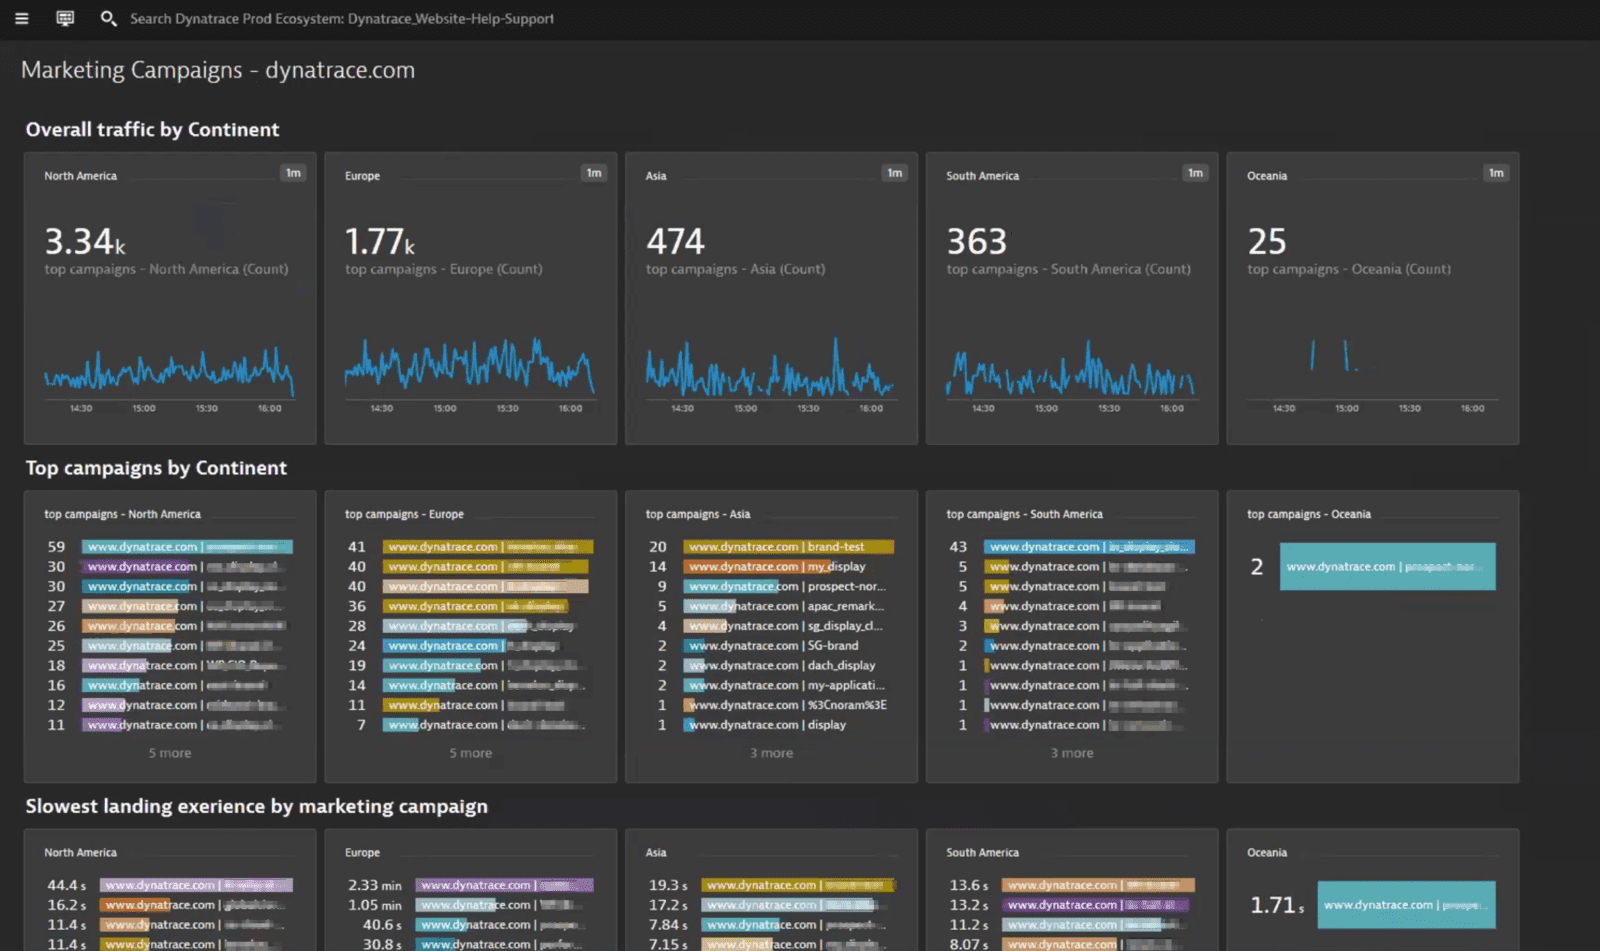
For web, mobile, and custom applications, you can create a query with action and session properties and then pin the resulting chart to one of your dashboards.
For web applications, you can additionally create calculated metrics based on custom properties, use these metrics to create a chart and then pin this chart to your dashboards. This can be done in Data Explorer.
The generic Web property pack is used in the following example to track the marketing campaigns on Dynatrace.com to view the following:
- Overall traffic by continent
- Top campaigns by continent
- Slowest landing experience by marketing campaign
Session properties export
You can export captured user session properties, along with all other user session data, within user session export streams.
For more details, see Export user sessions.
Multidimensional analysis
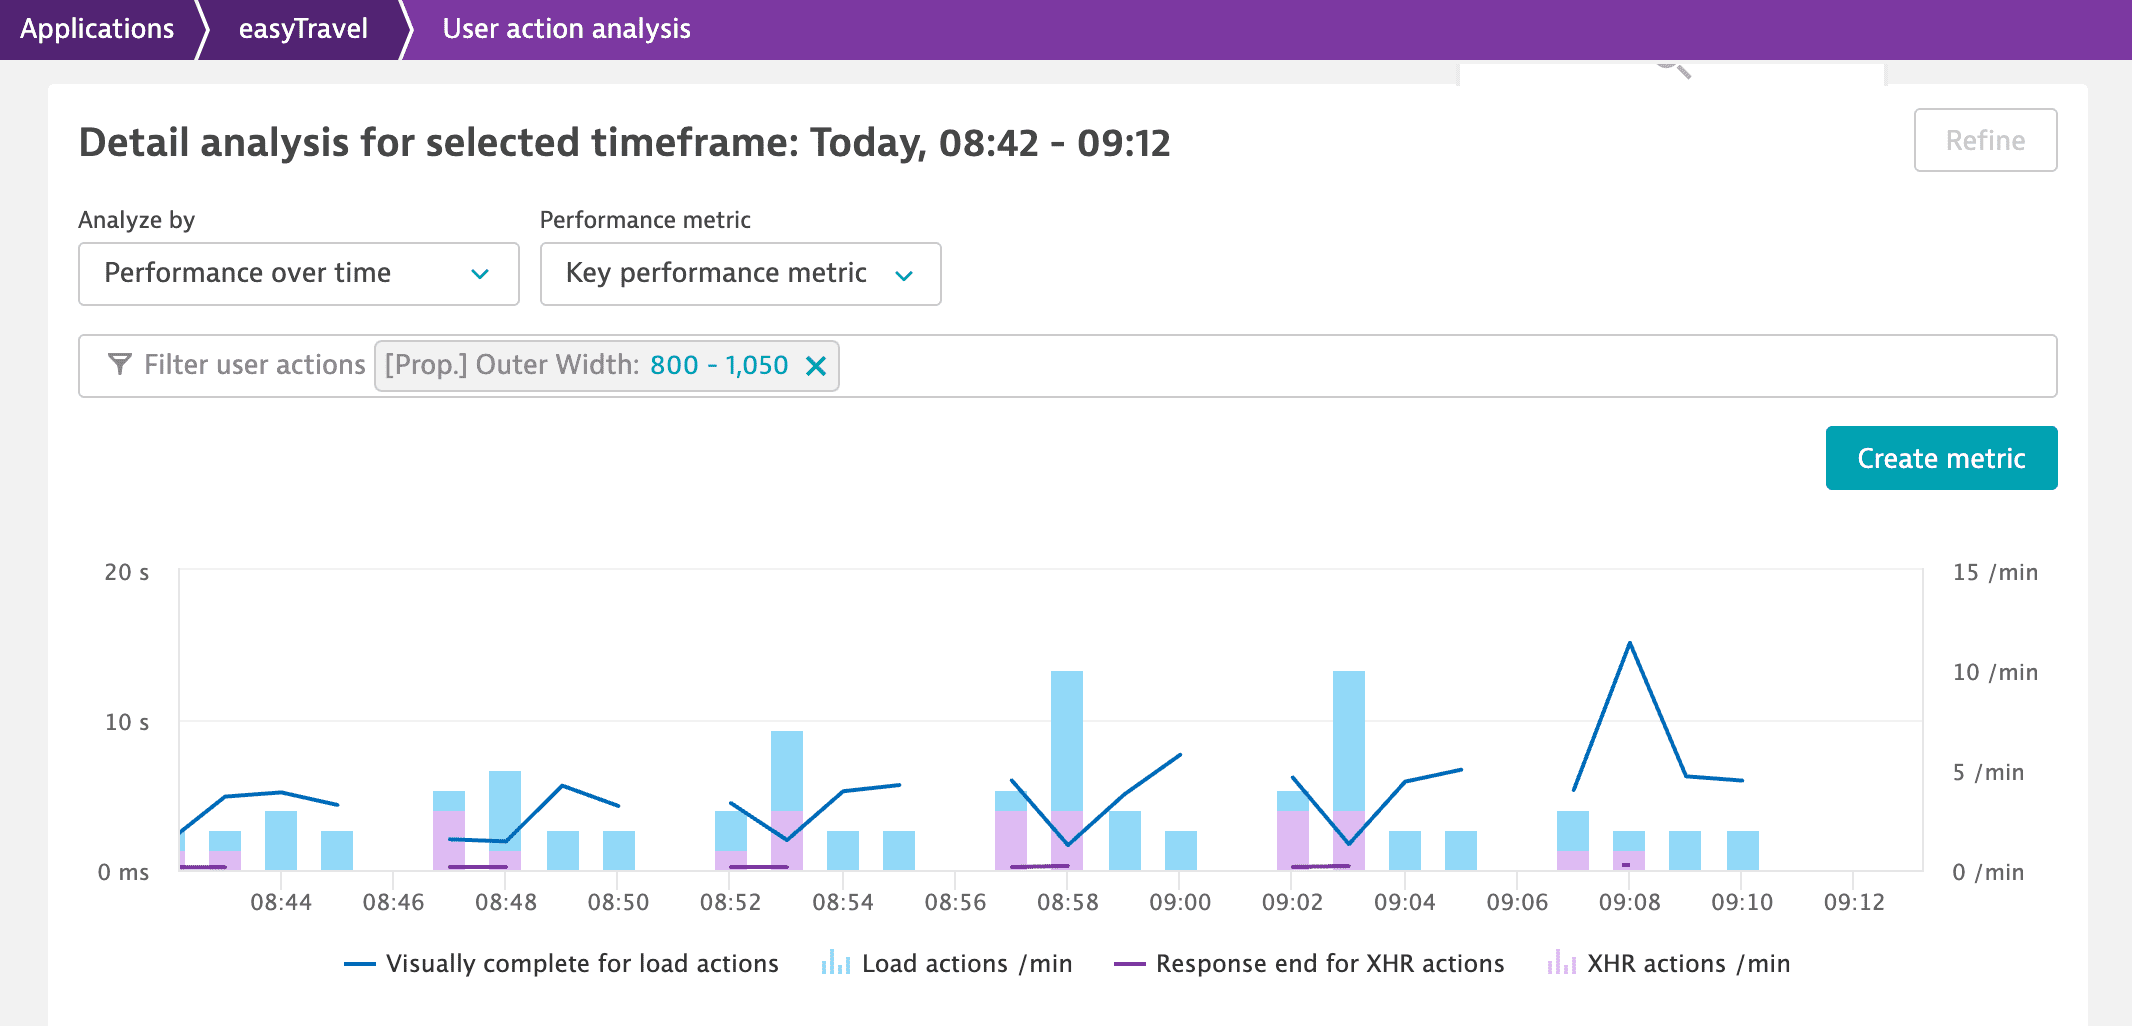
You can also leverage custom properties in Multidimensional analysis. For instance, you can analyze user actions based on your custom properties or you can filter data by property values.
To use custom properties on the Multidimensional analysis page
-
Go to Web and select your application.
-
Under Impact of user actions on performance, select Analyze performance.
-
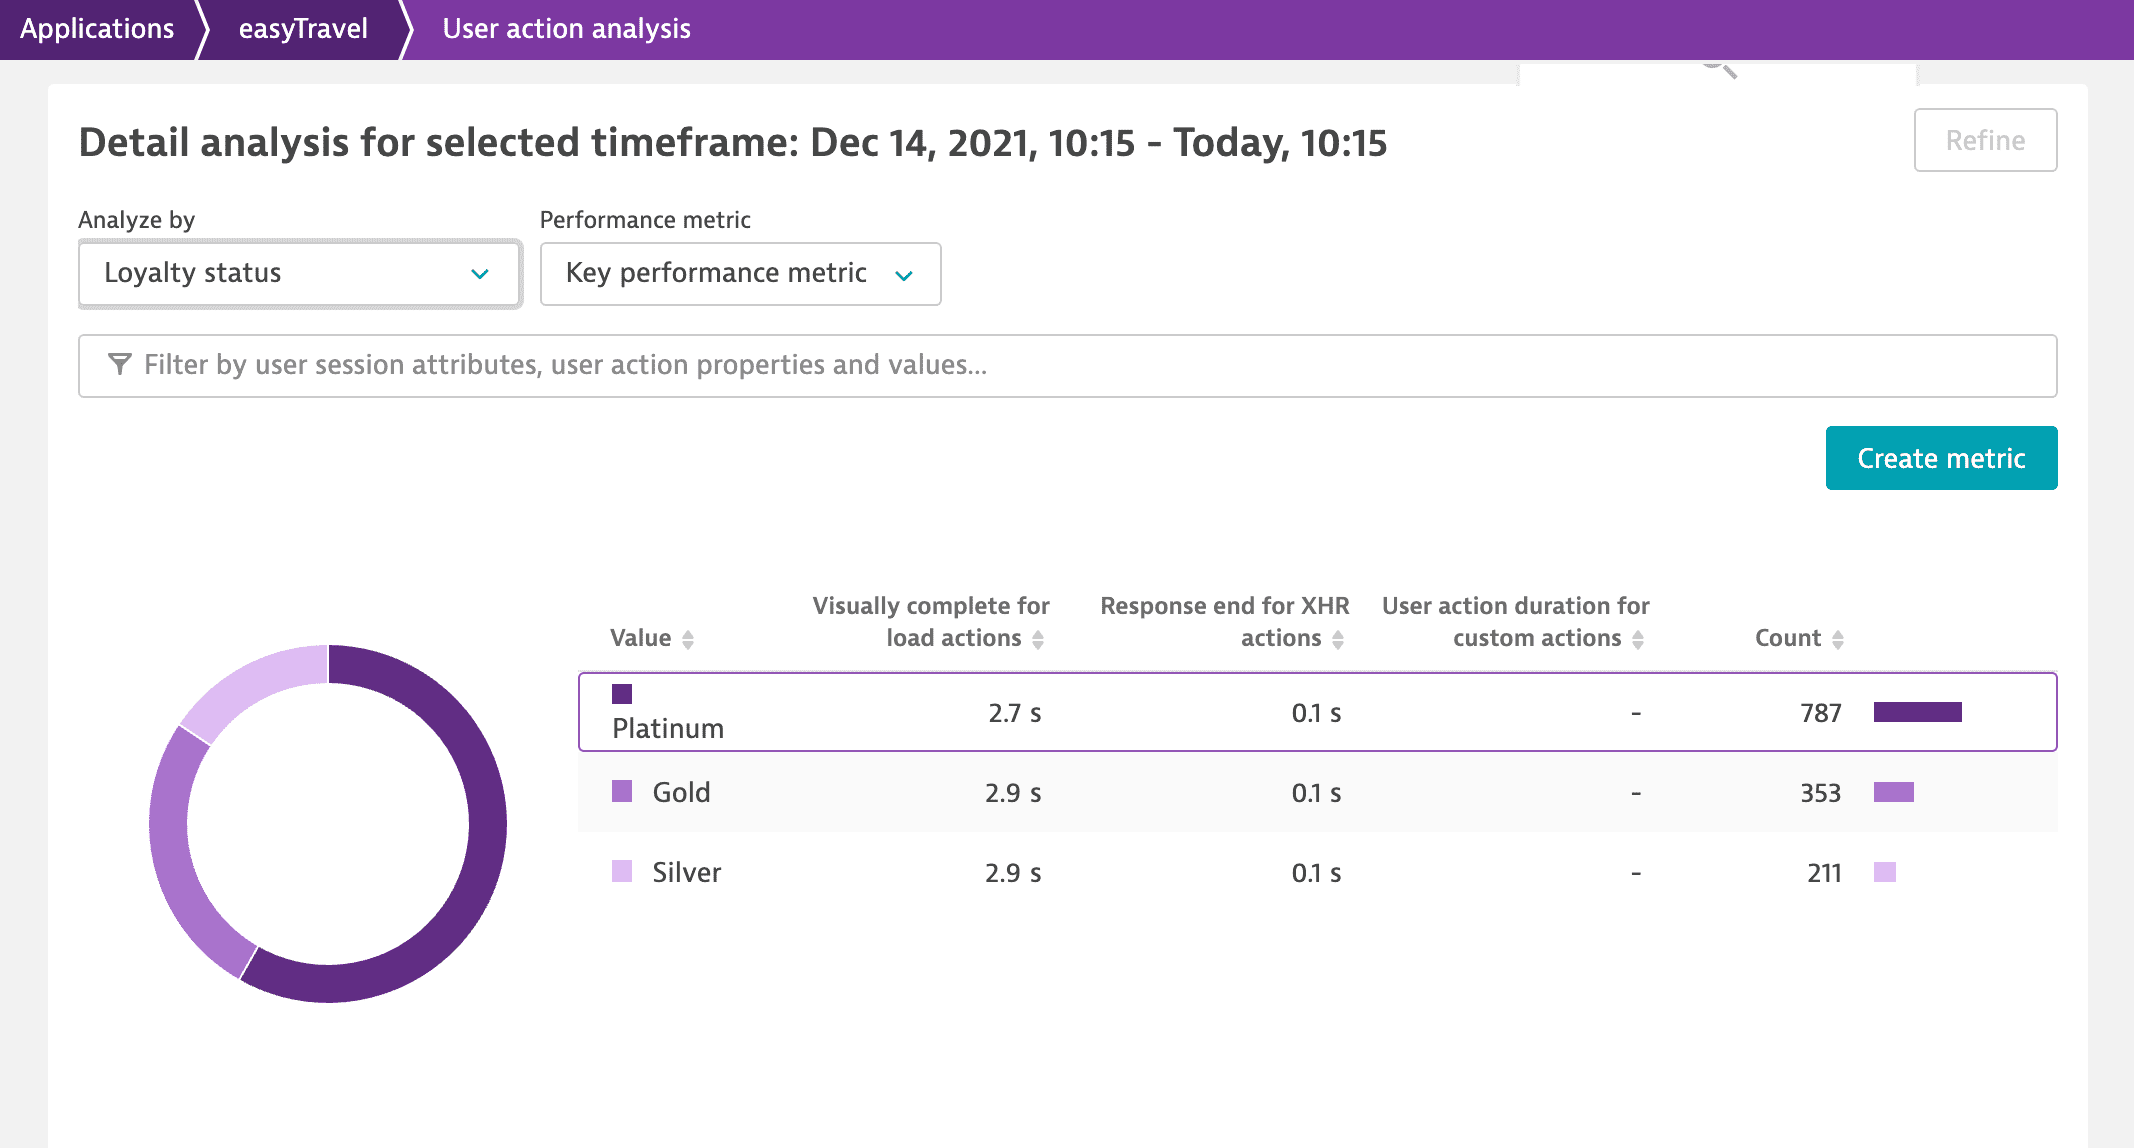
Scroll down to Detail analysis for selected timeframe, and select the required custom property in Analyze by.
-
Optional In Filter by, set the required filters. For example, you can filter by user action properties.
-
Scroll down to see more details. You can use the additional property values for further insight into your application's performance and success.
Calculated metrics, charts, and alerts
To extend usefulness, create a calculated metric with your user action properties. You can create a metric either from the Multidimensional analysis page or from your application settings. After you add a metric, you can use it to create custom charts and alerts.
To create a metric from the Multidimensional analysis page
-
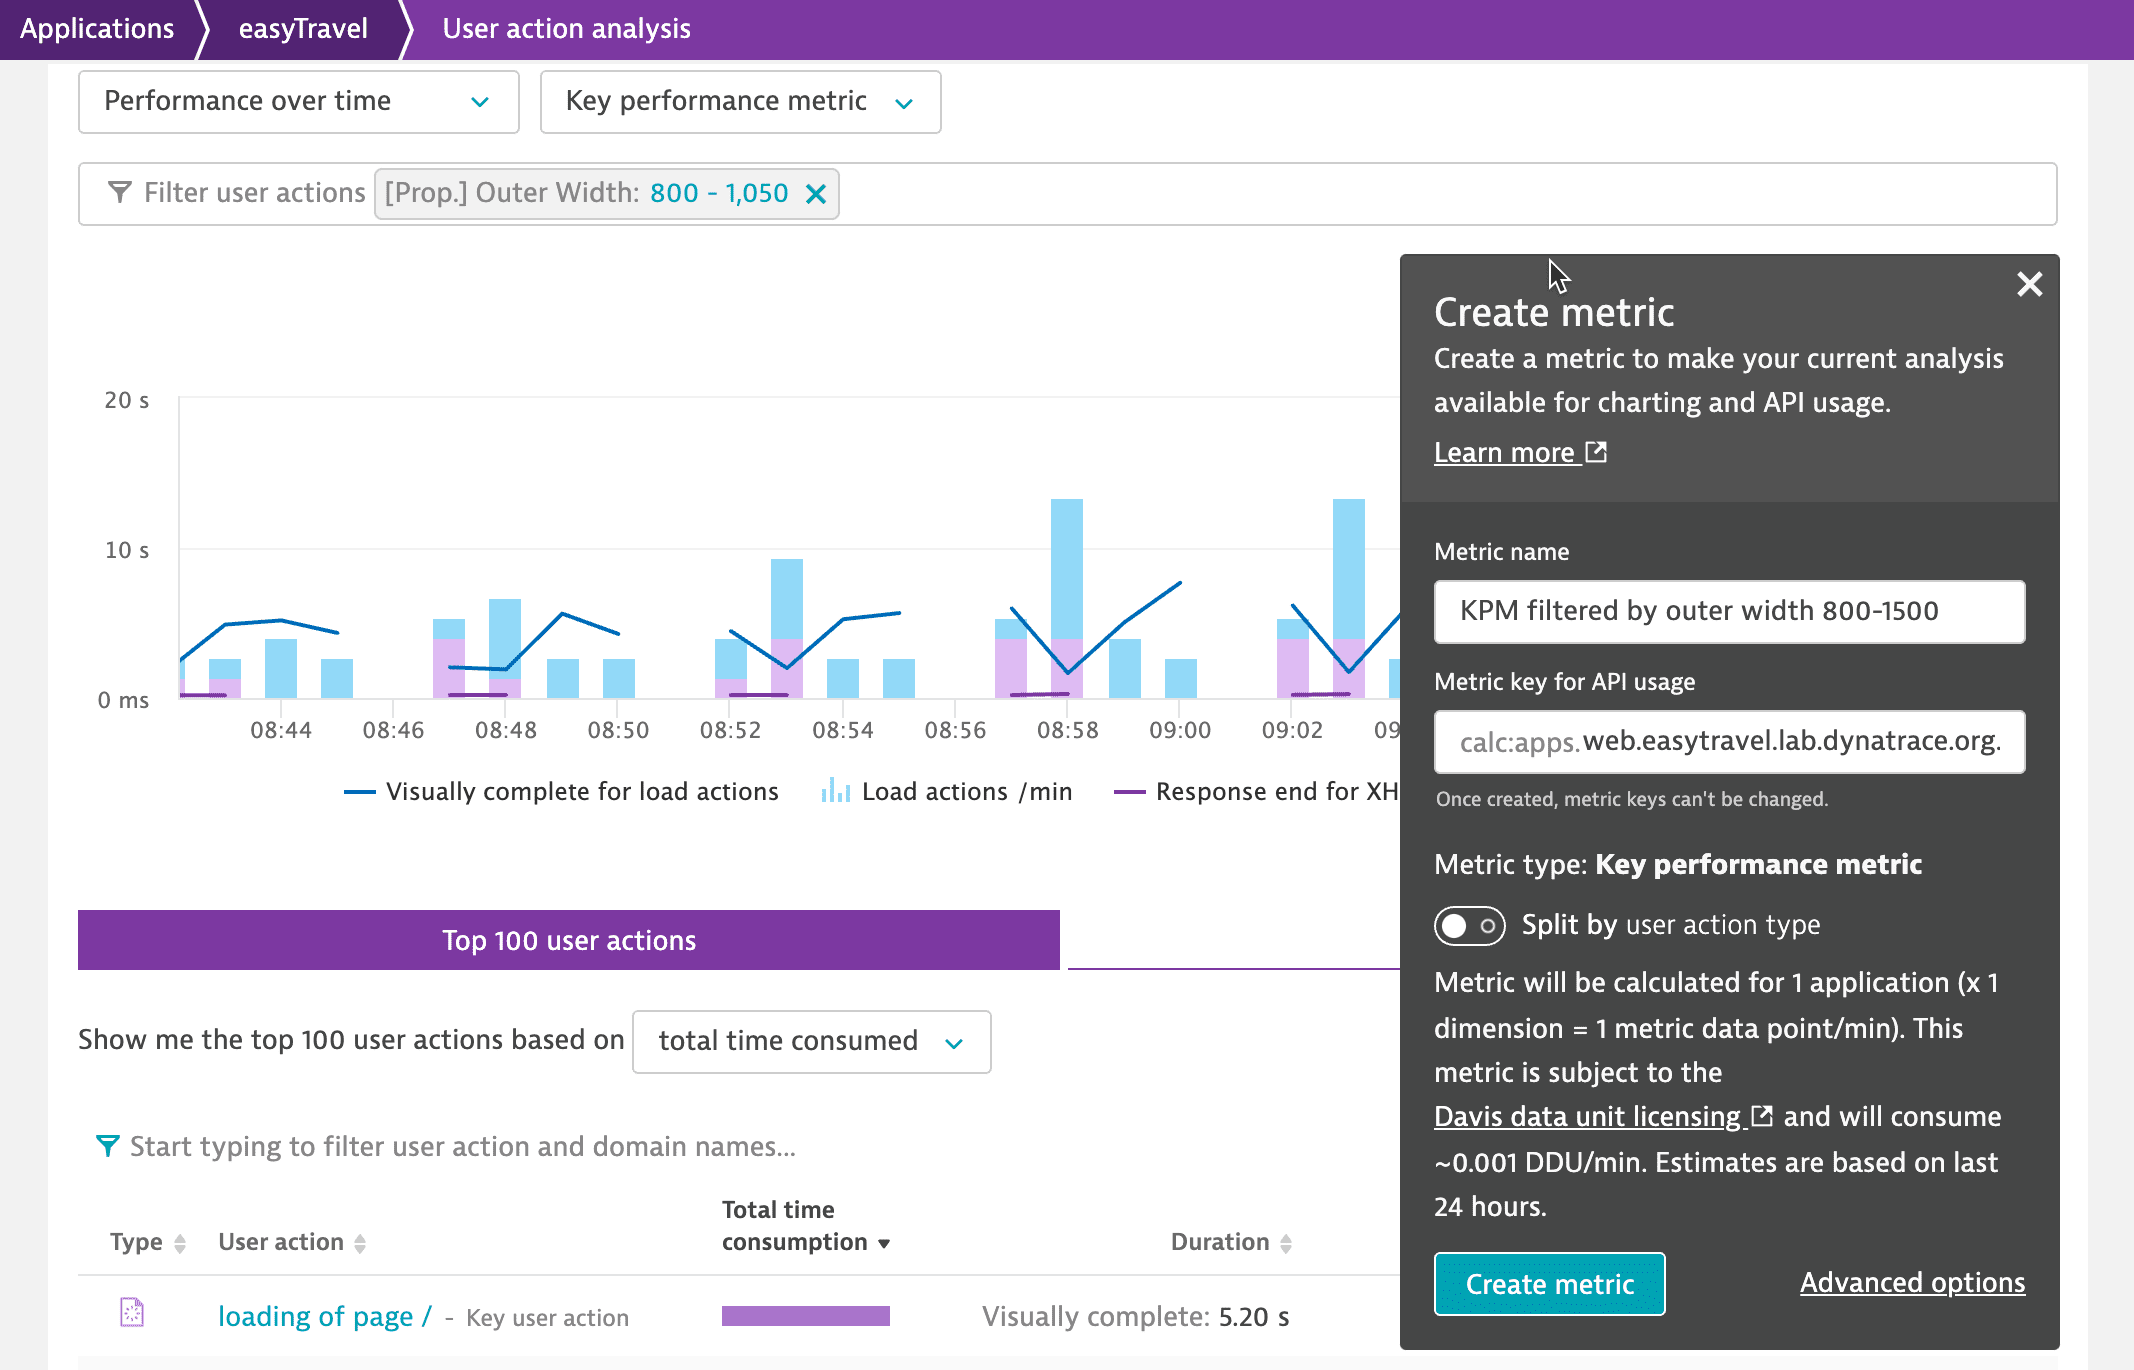
From the Multidimensional analysis page, scroll down to Detail analysis for selected timeframe, and set the required options in Analyze by and, if required, in Filter by.
-
Select Create metric.
-
Optional Change the metric name and metric key.
-
Select Create metric to save the metric.
-
Optional Select Create a chart or Create alert. For details, see Data Explorer and Metric events.
To create a metric from your web application settings
- Go to Web.
- Select the application that you want to configure.
- In the upper-right corner of the application overview page, select More (…) > Edit.
- From the application settings, select Metrics, and then select Add metric.
- Select the required metric, and specify a Metric name and Metric key for API usage.
- Optional In Filter by, set the required filters. For example, you can filter by user action properties.
- Select Create metric.
- Optional From the list of metrics, expand the created metric, and select Create a chart or Create alert. For details, see Data Explorer and Metric events.