Cost & Carbon Optimization app
- Latest Dynatrace
- App
- 8-min read
 Cost & Carbon Optimization gives you visibility into the environmental and financial impact of your cloud infrastructure.
Use it to measure energy consumption, CO2e emissions, and estimated cloud costs for Dynatrace-monitored hosts and Kubernetes clusters—and to ingest, query, and report on your real AWS billing data using industry-standard FOCUS (FinOps Open Cost and Usage Specification) fields.
Prerequisites
Make sure the app is installed in your environment.
Cost & Carbon Optimization requires two sets of permissions:
1. User permissions
You need user account permissions to control what data you can see and what settings you can change.
2. Workflows authorization settings
You need workflows authorization settings to run automated calculations on your behalf.
Check if  Workflows has the required permissions to run automations:
-
Open
Workflows. -
Select Settings > Authorization settings in the upper-right corner.
-
Ensure that the following settings are enabled:
app-engine:apps:runapp-engine:functions:runapp-settings:objects:readapp-settings:objects:writeautomation:workflows:readautomation:workflows:writeenvironment-api:entities:readiam:bindings:readstate:app-states:readstate:app-states:writestate:app-states:deletestorage:bizevents:readstorage:buckets:readstorage:entities:readstorage:events:writestorage:metrics:readstorage:smartscape:read
For more information, see Manage user permissions with IAM policies and Workflow authorization settings.
For carbon emissions calculation
Carbon dioxide emissions and energy consumption are calculated for hosts that are set up and monitored with OneAgent. Energy calculations are based on observed infrastructure metrics.
- In Cost & Carbon Optimization, go to the Hosts tab.
- Check that you have at least one host instrumented.
For public pricing costs calculations
-
The data generation of carbon emissions must be active to allow generating public pricing cloud costs. You can activate it in the app's settings.
-
You need instrumented hosts with OneAgent and cloud vendor monitoring configured. The calculation of public price list costs requires the collection of metadata from a host as the cloud provider, cloud region, and the type of instance configured in the cloud vendor. This information is provided by configuring the cloud vendor monitoring for the hosts to be monitored with OneAgent. For more information, see Ingest data into Dynatrace.
-
Enable External requests to the cloud vendors where the hosts are running to collect public price lists into Grail.
External requests enable outbound network connections from your Dynatrace environment to external services. They allow you to control access to public endpoints from the AppEngine with app functions and functions in Dashboards, Notebooks, and Automations.
-
Go to
 Settings > General > External requests.
 -
Select New host pattern.
-
Add the domain names.
-
Select Add.
This way you can granularly control the web services your functions can connect to.
You need to add the following domain names
-
For AWS, add
*.amazonaws.com -
For Azure, add
azure.microsoft.com -
For Google Cloud, add
cloudbilling.googleapis.com
-
Layout
Cost & Carbon Optimization tabs expose a DQL intent link that opens the underlying data in a notebook, and supports CSV export of tabular data.
Overview tab
The Overview tab provides an at-a-glance view of your IT carbon footprint and estimated cloud costs.
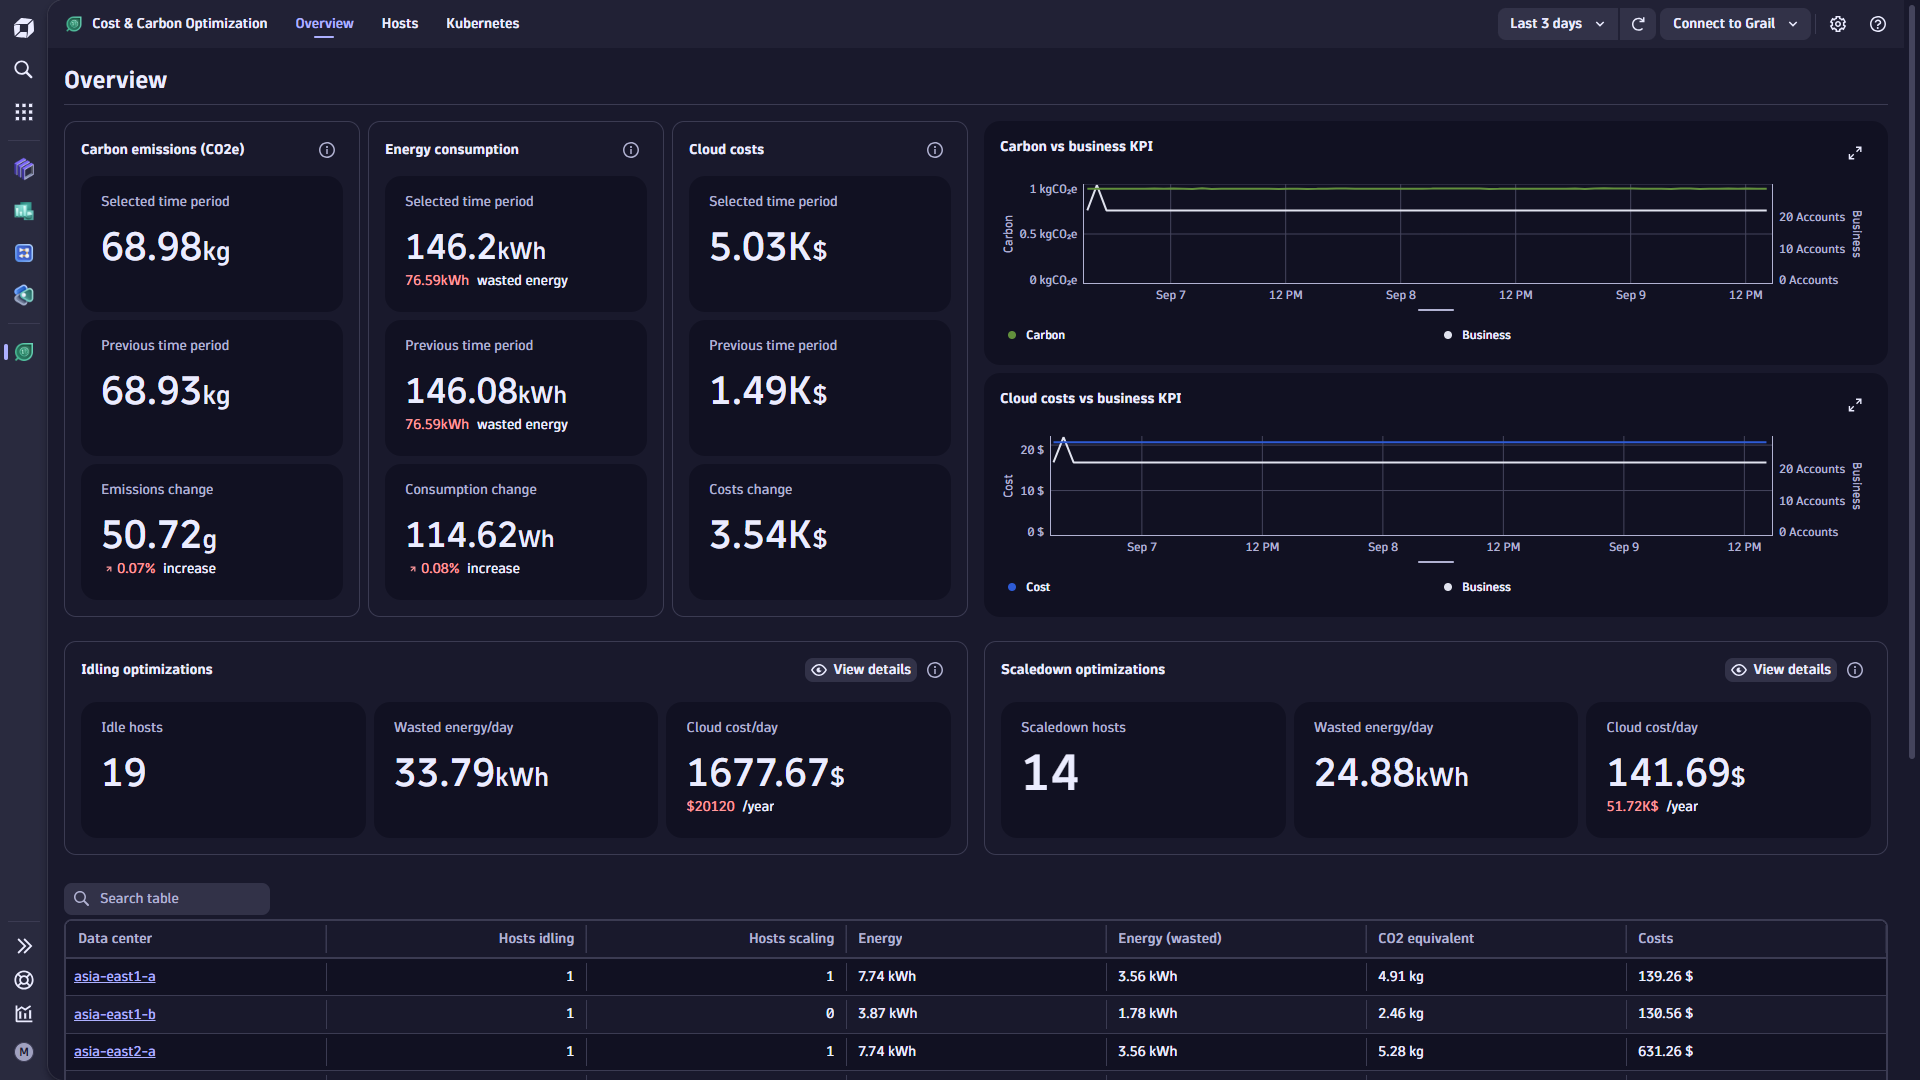
-
The Carbon & Energy Footprint summary reports total CO2e emissions for the selected and preceding timeframes for quick interval-based comparisons.
-
Wasted energy summary is also reported with the selected and preceding timeframe.
-
Publicly listed cloud costs report the sum of cloud costs for Dynatrace-monitored hosts for the user-selected timeframe, using publicly available list prices from each cloud provider. Costs are displayed for the selected and preceding timeframes.
-
Optimization recommendations reports idle hosts and underutilized hosts with their cost and wasted energy measured.
To adjust thresholds influencing these calculations to your needs, navigate to the upper-right corner and select to open the app's settings.
-
The Accumulated carbon footprint over time chart shows the accumulated carbon footprint and energy consumption over time.
-
With the Carbon versus business KPI chart, you can compare carbon emissions over time with a business key performance indicator (KPI) of your choice, derived from any of your captured business events.
-
If cloud costs are calculated, two more charts display Accumulated cloud cost over time and Cloud cost versus business KPI defined.
-
Carbon/energy data is measured for all hosts monitored by Dynatrace OneAgent, or by Dynatrace Kubernetes monitoring.
Hosts tab
The Hosts tab shows cost, energy, and carbon emissions for all OneAgent-monitored hosts.
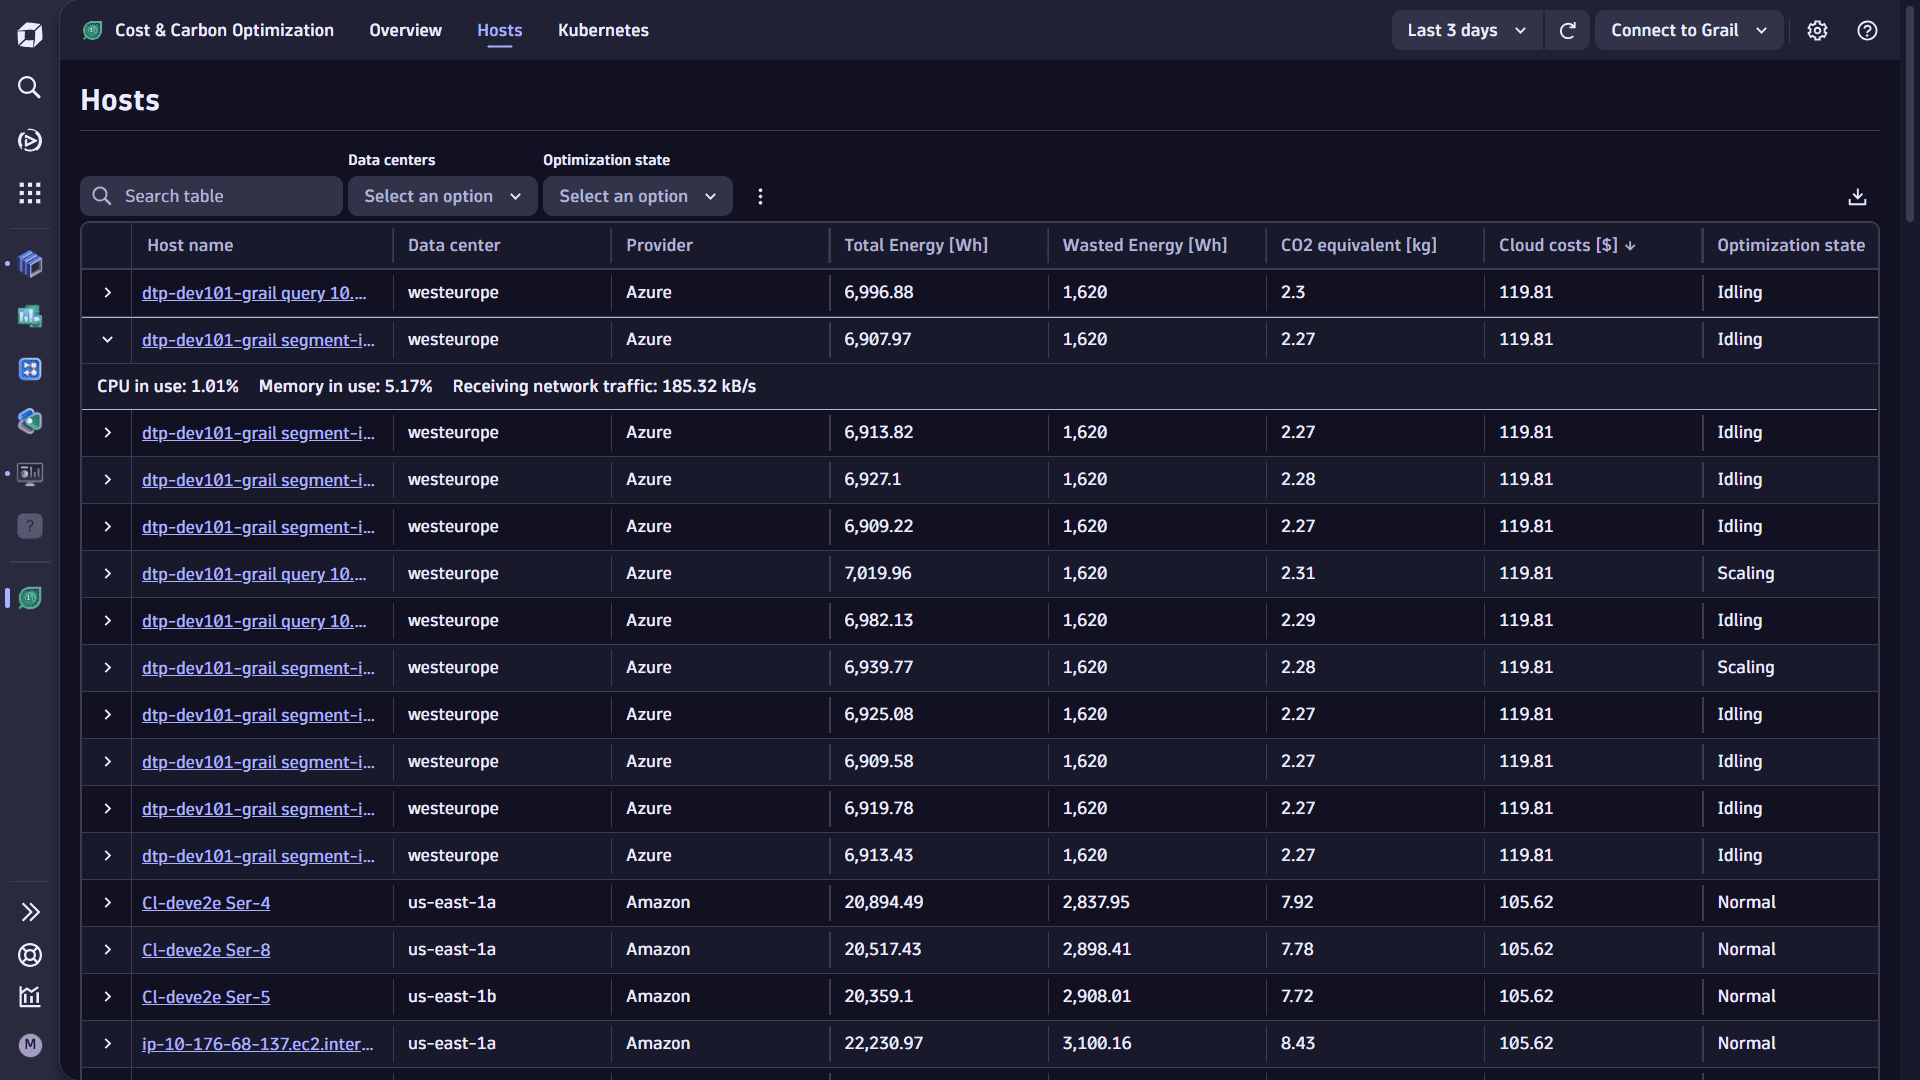
- The table includes all hosts with carbon/cost information for the user-selected timeframe, and displays metadata, energy consumption, CO2 equivalent, and cloud costs (cloud hosts only).
- Use the information from this table to identify and optimize hosts with low utilization and high energy consumption, high carbon emissions, and high costs.
- The table allows you to search for specific hosts, filter by data center, or filter by optimization state (
Idling,Scaling,Normal—thresholds are defined in the app's settings). - Expand a host to see if average CPU, memory and network traffic utilization for the user-selected timeframe.
- The page includes an intent that allows you to query the underlying data using DQL in a notebook or dashboard and combine the carbon and energy data with other information in Dynatrace. This can be useful to customize optimization information using DQL. Tabular information can be downloaded to a CSV file by selecting the download link.
- This view includes only hosts that are monitored by Dynatrace OneAgent. Kubernetes infrastructure is shown separately in the Kubernetes tab. Cloud hosts not monitored by Dynatrace OneAgent are not displayed here.
Kubernetes tab
Cost & Carbon Optimization works only for Kubernetes monitoring on Grail; classic Kubernetes monitoring is not supported.
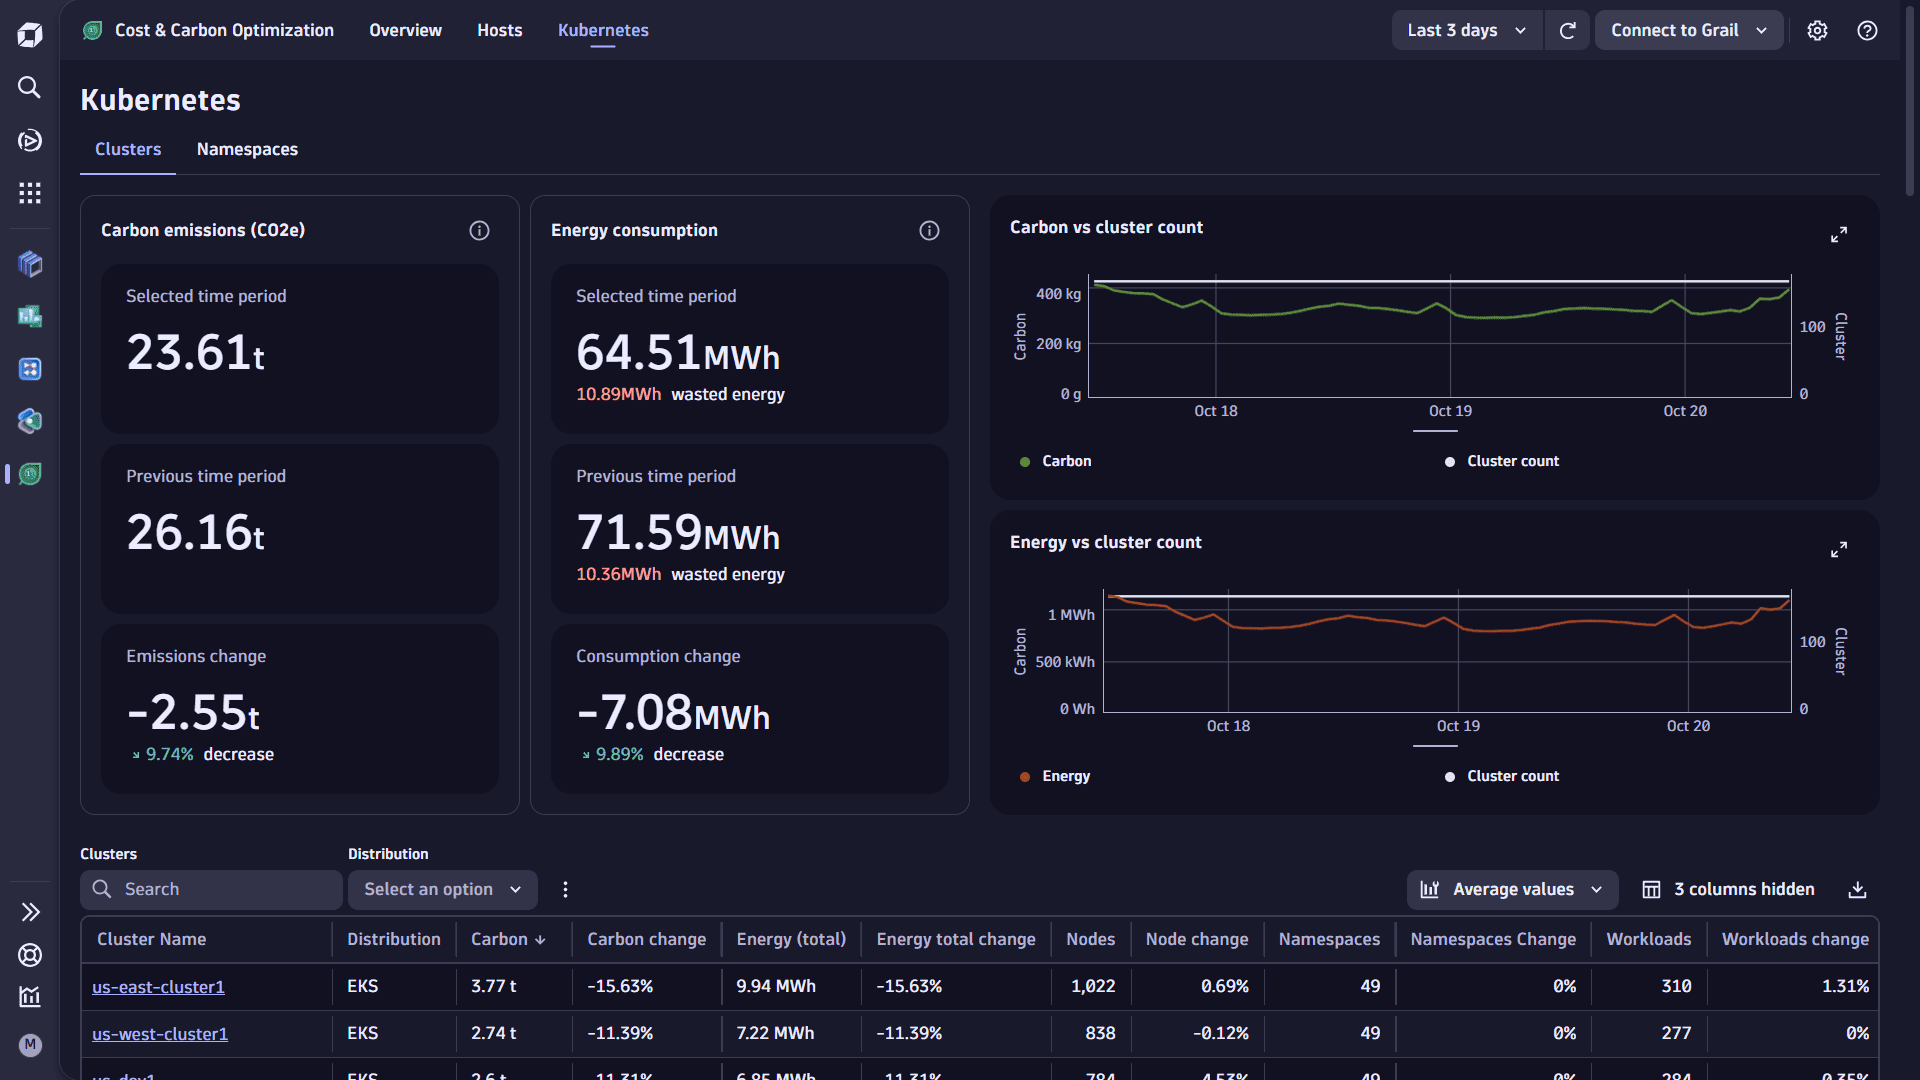
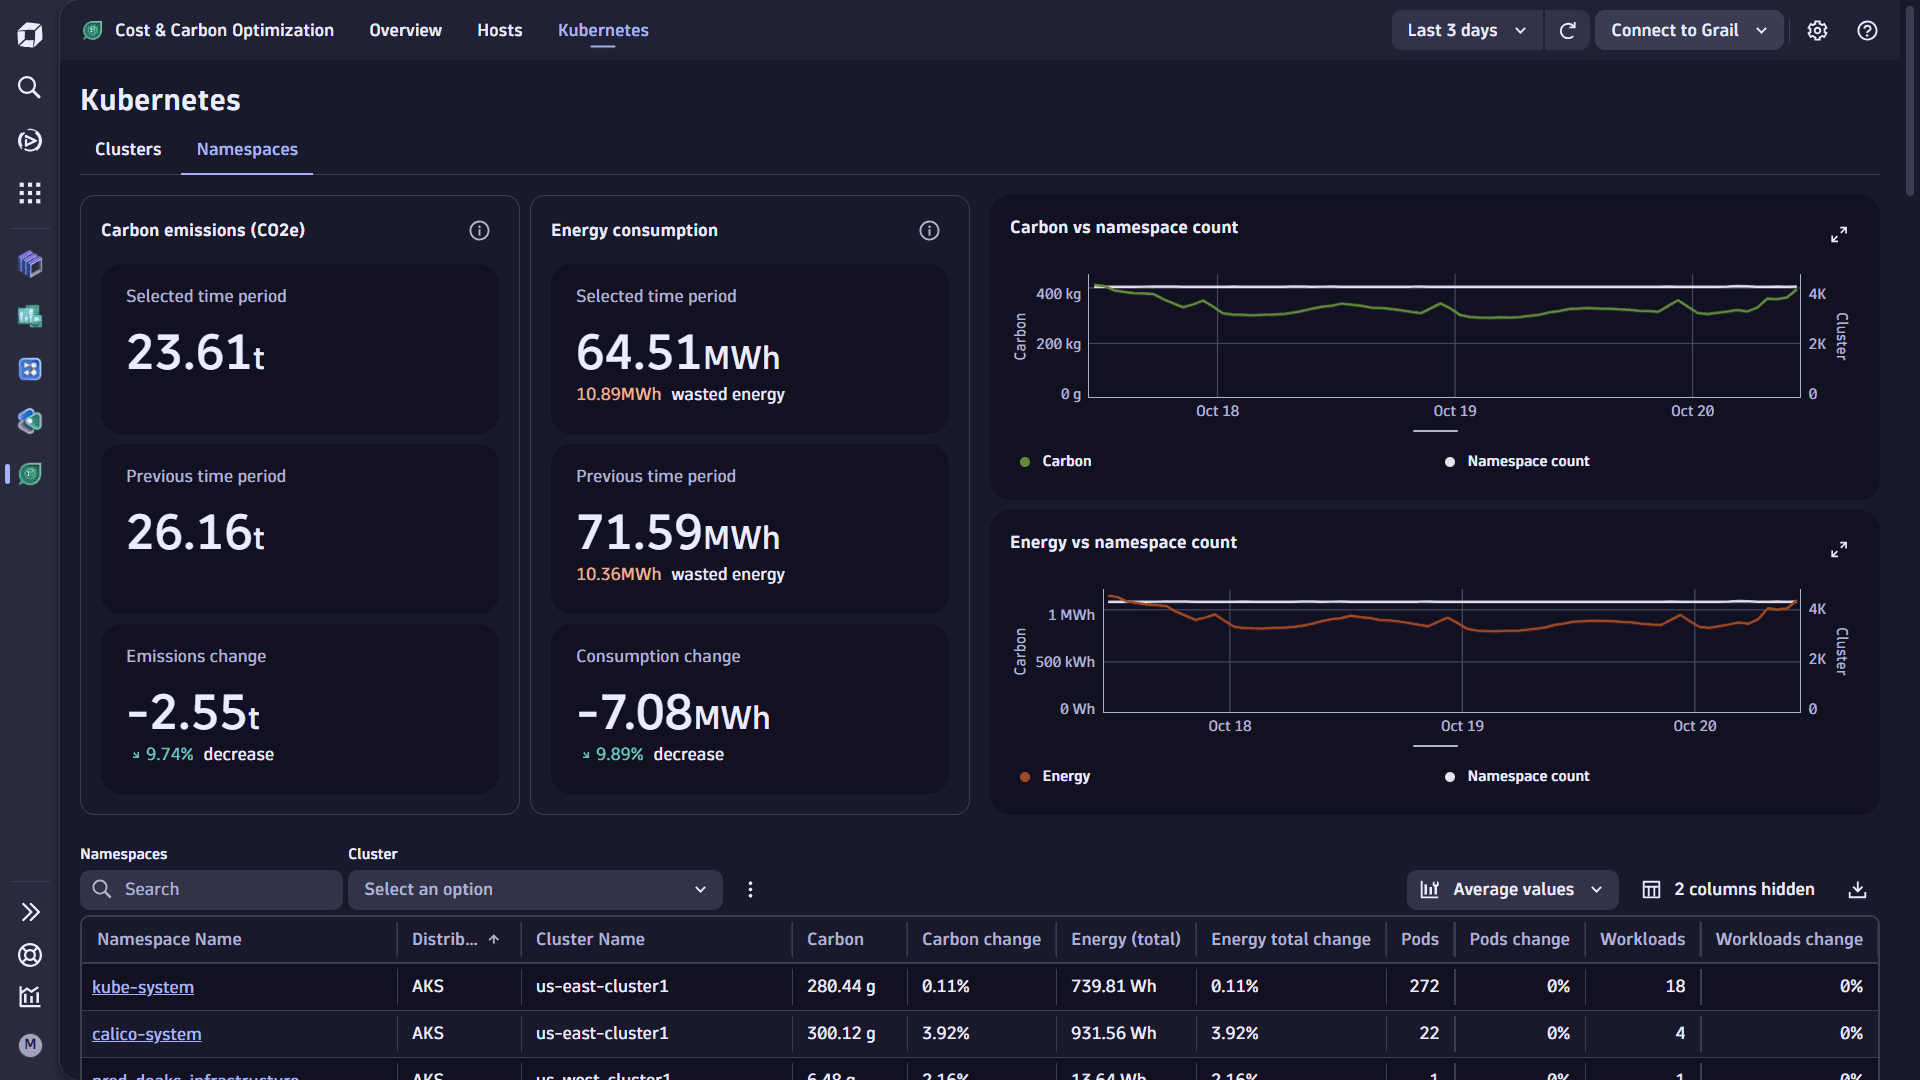
This tab allows you to view energy, carbon emissions, and utilization information for Kubernetes infrastructure monitored by Dynatrace.
Use the Kubernetes view to explore the energy consumption and carbon emissions of Kubernetes clusters, namespaces, and nodes by selecting the relevant link at the top of the page. Each view provides you with:
- A textual summary of carbon emissions and energy consumption
- Charts of the carbon emissions and energy consumption over the user-selected timeframe.
- A table of carbon emissions, energy consumption, and the relevant metadata for each Kubernetes entity.
The Clusters and Namespaces views
- Provide contextual navigation to the Kubernetes entity in
") Kubernetes by selecting the cluster, namespace, or node link in the table.
Kubernetes by selecting the cluster, namespace, or node link in the table. - List the average CPU and memory allocatable to help understand each entity's hardware resources.
- Include an intent that allows you to query the underlying data using DQL in a notebook or dashboard and combine the carbon and energy data with other information in Dynatrace. Tabular information can be downloaded to a CSV file by selecting the download link.
- The % metric change is also shown in each view, enabling you to quickly determine whether the scope or emissions of a Kubernetes entity have increased/decreased for the selected timeframe.
Use this information to
-
Identify Kubernetes clusters and namespaces with the highest energy consumption and carbon emissions, and correlate this with Dynatrace
Kubernetes information on CPU and memory slack to identify the most costly and underutilized Kubernetes resources.
Leverage this information with your application teams to reconsider optimizing their requests/limits to reduce slack and optimize carbon and costs.One-click navigation between
Cost & Carbon Optimization and Kubernetes allows you to quickly drill down into more information about the Kubernetes resources to inspect resource requests and limits, quotas, or idle workloads/jobs that reserve resources but run infrequently. -
Track energy and carbon at the Kubernetes cluster and namespace over time and identify anomalies that need further investigation to understand what changed in the environment and whether the change was intentional and warranted. A large spike (increase) in energy and carbon could be a normal side effect of increased usage, but it could signal an issue or change with automatic scaling or resource provisioning.
Examples: Changes to the type of node instances being used, or an unnecessary increase in associated storage.
-
Measure and compare carbon emissions from single-use servers to Kubernetes infrastructure to ensure that migration efforts are meeting the desired sustainability goals. Organizations may even consider gamifying this and challenging their engineering teams to develop solutions that delight end-users and the environment.
Clusters view
Provides a breakdown of carbon emissions and energy consumption for each monitored cluster, with an average count of nodes, namespaces, and workloads seen during the user-selected timeframe.
You can filter the table by cluster deployment type (for example, EKS, AKS, GKE) and search for a specific cluster names.
See Average vs. actual values for additional information on the use of average and actual counts.
Namespaces view
This table provides a breakdown of carbon emissions and energy consumption for each namespace, with an average count of pods and workloads seen during the user-selected timeframe.
You can filter the table by cluster name and search for specific namespaces.
See Average vs. actual values for additional information on the use of average and actual counts.
Average vs. actual values
Kubernetes is a dynamic environment, and the number of nodes and pods changes continuously.
When reporting on carbon and energy over longer timeframes, counts can be derived using the average count of nodes, pods, and other entities observed during the user-selected timeframe, or a more in-depth query can be made to the Kubernetes data in Grail to get actual distinct counts of each entity.
In a large Kubernetes environment, an actual count of distinct entities can take several seconds, whereas the average count typically takes milliseconds, and is sufficient for most use cases.
This selector may account for differences between Cost & Carbon Optimization and Kubernetes.
The query time for the actual data is dependent on the size of your Kubernetes infrastructure and the timeframe being analyzed.
- Using actual data over a 7-day period could take minutes, not seconds.
- Querying actual namespace data is significantly heavier than cluster or node data. Use a short timeframe (1–2 days) when requesting actual counts in the Namespaces view.
When using the deployment mode Kubernetes platform monitoring + Application observability, nodes and namespaces can be excluded from monitoring using the namespaceSelector (and nodeSelector).
As Cost & Carbon Optimization only reports on the energy/carbon of namespaces/nodes that are monitored, energy and carbon emissions shown may be lower than expected when infrastructure is excluded from monitoring. Excluded namespaces will be displayed in the Namespaces table but will show no carbon/energy measurements.
In addition, internal workloads (such as coredns, traefik, and more) may be running that are not monitored by Dynatrace and energy/carbon data will not be included in the measurements.
This selector may account for differences between Cost & Carbon Optimization and Kubernetes.
When using the deployment mode Kubernetes platform monitoring + Application observability, nodes and namespaces excluded from monitoring via the namespaceSelector or nodeSelector will appear in the Namespaces table but will show no carbon or energy measurements.
Main concepts
For more detailed explanations, see Cost & Carbon Optimization concepts.
Carbon and energy footprint
Cost & Carbon Optimization monitors your Dynatrace-instrumented hosts and Kubernetes clusters and uses infrastructure metrics — CPU utilization, memory, storage, and networking — to estimate electricity consumption and carbon dioxide equivalent (CO2e) emissions.
The app also calculates estimated public list-price costs for each host using publicly available cloud provider price lists. These are estimates based on public pricing data, not your actual AWS bill.
Cloud Cost Management Preview
This release covers AWS ingestion. Support for Azure and GCP, along with cost allocation, budgeting, and anomaly detection, will follow in subsequent releases.
Cloud Cost Management ingests your actual AWS billing data into Dynatrace using FOCUS 1.2—an open billing specification from the FinOps Foundation that normalizes cost and usage data across cloud providers. Ingested data is stored as business events in Grail for querying with DQL.
- Analyze actual AWS spend alongside observability data.
- Query costs with DQL using normalized FOCUS fields.
- Build cost allocation dashboards by team, tag, service, or account.
- Perform Reserved Instance coverage analysis.
Use cases
- Carbon reporting and allocation
- Energy efficiency optimization
- Kubernetes infrastructure carbon tracking
- AWS cloud cost analysis and FinOps reporting
- Cost allocation by team, service, or tag
- Reserved Instance (RI) coverage analysis
- Sustainability and ESG compliance reporting
FAQ
What is the difference between estimated cloud costs and Cloud Cost Management?
Estimated public list-price costs are calculated from publicly available cloud provider price lists using your host metrics—they are approximations useful for cost-awareness without billing access.
Cloud Cost Management ingests your actual AWS billing data. The numbers match your invoice and include all discounts, credits, and commitments.
Do I need OneAgent to use Cloud Cost Management?
No. Cloud Cost Management reads directly from AWS billing exports and does not require OneAgent-instrumented hosts. However, you do need the Cost & Carbon Optimization installed in the latest Dynatrace SaaS environment with a Platform Subscription.
"An error occurred while loading the data. Please make sure you have the required user permissions."
This popup error message will list the permissions needed to use Cost & Carbon Optimization.
Ensure that a Dynatrace IAM administrator adds these policies to your user/group.
"Try adjusting the timeframe or columns"
-
There's no data to display, potentially due to the timeframe selected, or due to carbon data not being generated correctly.
-
If you enabled
Cost & Carbon Optimization recently, please wait for up to 1-2 hours for the workflow to execute and start generating carbon data. -
You can check whether carbon or carbon Kubernetes data is being generated by running the following DQL in a notebook. Select the icon on the page, right above any table in the Hosts or Kubernetes tabs, to Open with the underlying DQL in a notebook:
fetch bizeventsfilter event.type == "carbon.measurement" or event.type == "carbon.measurement.k8s.cluster" -
Ensure that the
Cost & Carbon Optimization workflow has the required authorization settings to function.Open
Cost & Carbon Optimization settings page. If this is the problem, an error message with missing authorization settings will be displayed there. -
Ensure that the
Cost & Carbon Optimization workflow is scheduled to run every hour, that all steps within the workflow are enabled (not disabled), and that no errors are generated by the workflow.Review any workflow errors for further troubleshooting or contact our customer support.
"We encountered an unexpected issue. Please try again later."
-
A platform issue is preventing the app from executing queries to report on carbon Kubernetes data.
The issue may be temporary and will resolve itself shortly, or please reach out to our customer support.
-
Kubernetes monitoring may not be set up or functioning correctly.
Please check
Kubernetes to ensure that your Kubernetes infrastructure is being monitored correctly.
 Cost & Carbon OptimizationKubernetes
 Notebooks