Example configuration of service-level objective definitions
- Dynatrace Classic
- Reference
- 5-min read
Dynatrace offers a set of out-of-the-box SLOs for some of the primary monitoring domains that you can configure either in the SLO wizard or in the global SLO settings.
For a better understanding of the SLIs needed for these service-level objectives, see the configuration examples below.
Service-level availability
The fundamental service-level availability is calculated by dividing the number of successful service calls (builtin:service.errors.server.successCount ) by the total number of service calls (builtin:service.requestCount.server).
Example
-
Metric expression
(100)*(builtin:service.errors.server.successCount:splitBy())/(builtin:service.requestCount.server:splitBy()) -
Entity selector
type("SERVICE"),entityName("My service")
Service performance
A service performance SLO measures the percentage of time slices in which a service responded within a "fast" threshold, where "fast" is defined by a custom condition.
The example below shows how to define a metric expression that counts time slices meeting the "fast" condition and how to use that expression to define your SLO in Dynatrace.
Example
-
Metric expression:
((builtin:service.response.time:avg:partition("latency",value("good",lt(10000))):splitBy():count:default(0))/(builtin:service.response.time:avg:splitBy():count)*(100)):default(100,always)Using the following transformations, the metric expression returns values that have a response time under a defined threshold.
Trasformation Scope Info Aggregates values different than
nulland ignores the rest.Depending on the use case, multiple aggregations can be used, for example,
avg(to aggregate the values) andpercentile (90)(to remove outliers).Separates the metric's individual data points into a certain number of timeslots over the timeframe, based on the value
goodof the metric dimensionlatency.To improve SLO precision, reduce the timeslot extent by querying a shorter timeframe.
The
lt()condition changes the metric unit for the response latency threshold value to microseconds.The required metric unit for service performance SLOs is microseconds.
Replaces
nullvalues in the payload with the specified value (0).
Using a custom-calculated metric as a nominator improves the precision of the performance SLO. We recommend using the muted request option when combining calculated service metrics with built-in metrics, as the built-in metric applies it by default.
Service-method availability
Service-method availability is calculated by dividing the number of successful key request service calls (builtin:service.keyRequest.errors.server.successCount) by the total number of key request service calls (builtin:service.keyRequest.count.server). It uses the type("SERVICE_METHOD") SLO filter.
Example configuration with a filter for YOUR_METHOD_OF_INTEREST
<YOUR custom success metrics/filter service, endpoint, availability, and latency>/builtin:service.keyRequest.count.server:filter(eq("dt.entity.service\_method","SERVICE\_METHOD-XXX"))
This example shows how to define a service custom metric that counts the fast service calls, and how to define your SLO based on that custom metric in Dynatrace.
-
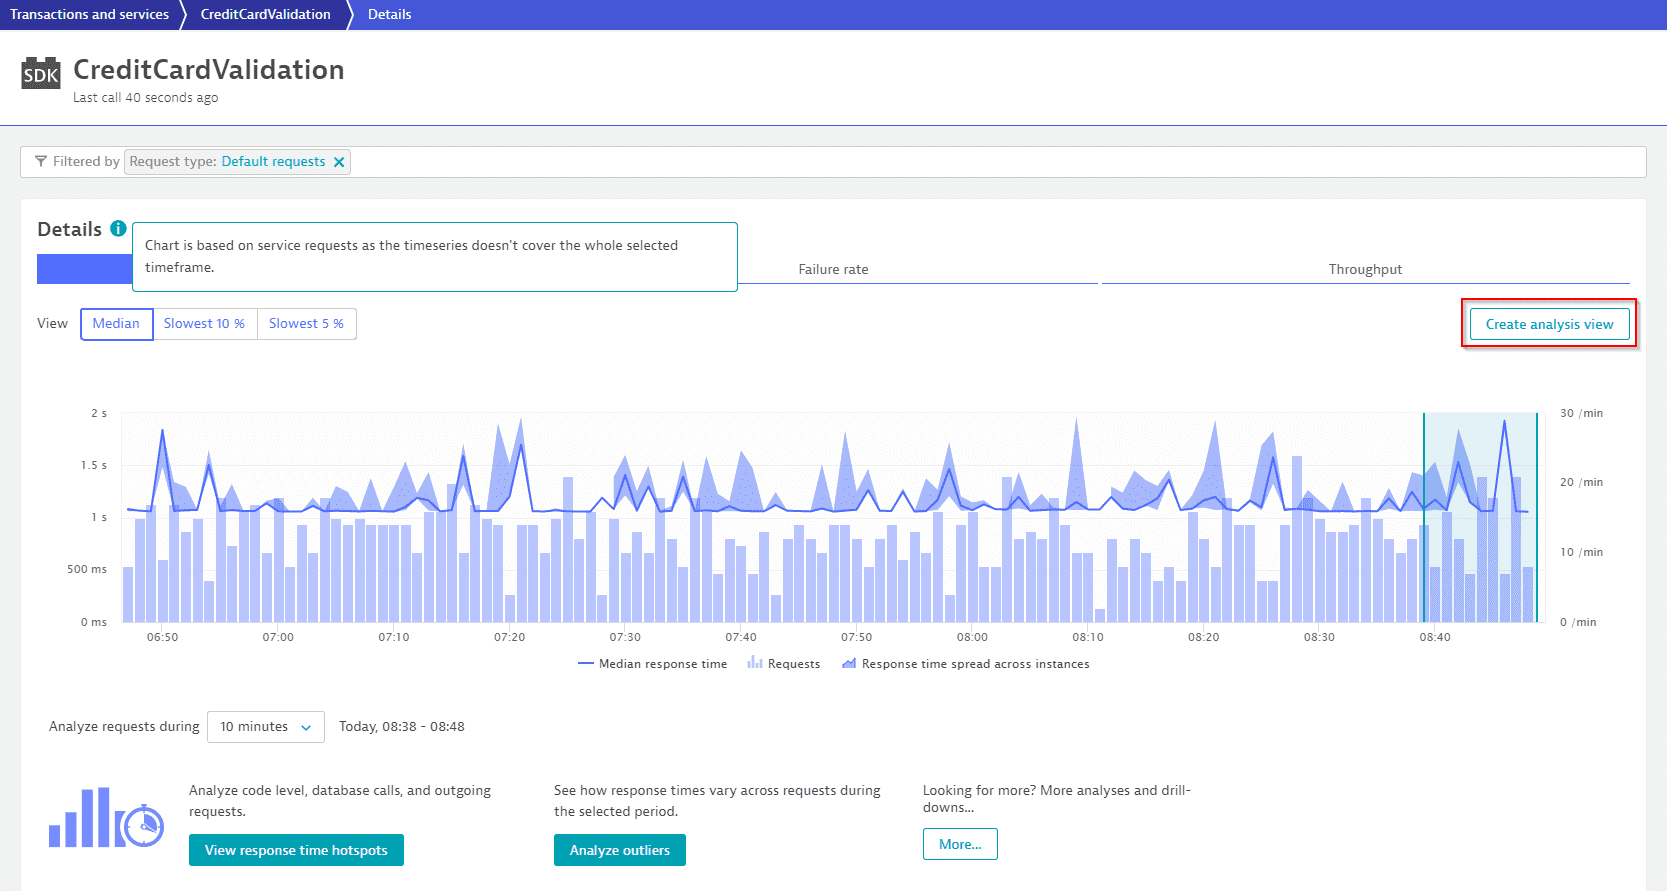
Go to any of your service pages, review its typical performance in milliseconds, and then navigate to the multidimensional analysis page.
 Validation
 -
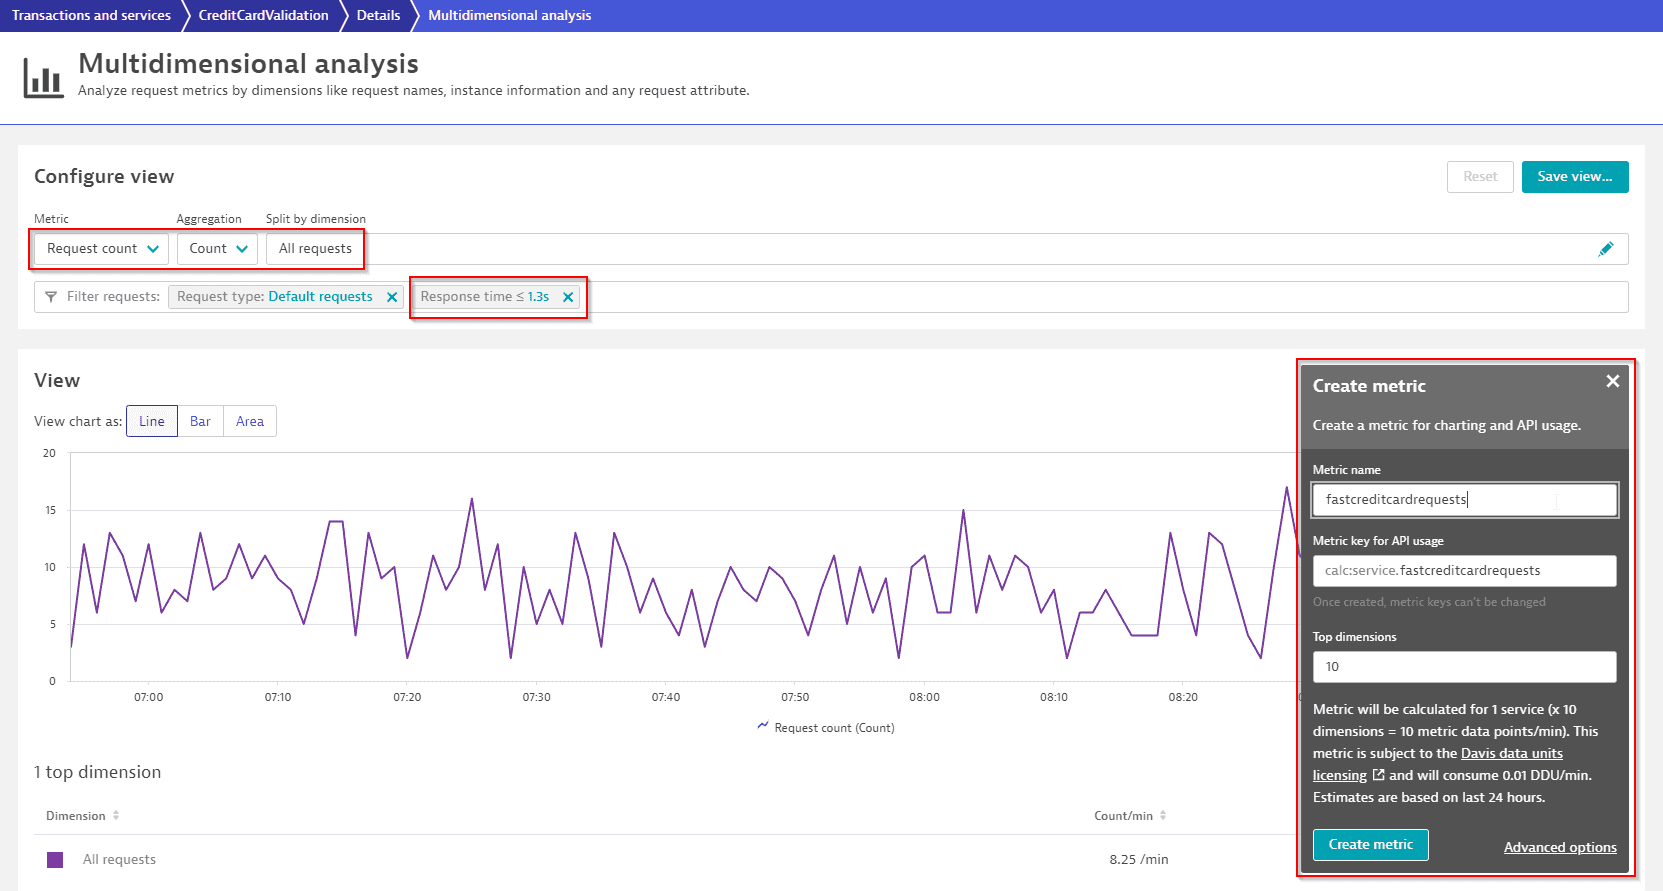
On the multidimensional analysis page, select Request count metric and define a condition on any of the service-call properties. In this example, we define a condition on the response time, which should be below 1,300 milliseconds to count as a fast call for this selected service.
 Multidim analysis
 -
After you've decided on a certain condition, select Create metric. Define your own unique metric identifier for that metric to use this metric for charting, alerting, and your SLO.
For example, a newly created metricfastcreditcardrequestsresults in a unique metric IDcalc:service:fastcreditcardrequests. Multidim analysis 2
 -
You can chart the total number of service requests for that service in comparison with your fast service requests.
Check the entity selector filter on your selected service (
CreditCardValidation) or you will get the total request count for all your services.Example entity selector:
type("SERVICE"),entityName("CreditCardValidation")) -
The result is the final SLO status shown in the list of SLOs.
 Perform result
User experience
Dynatrace offers expertise in terms of measuring the real user experience of delivered services. Dynatrace metrics such as the Apdex (Application Performance Index) or the User experience score can be used within an SLO definition.
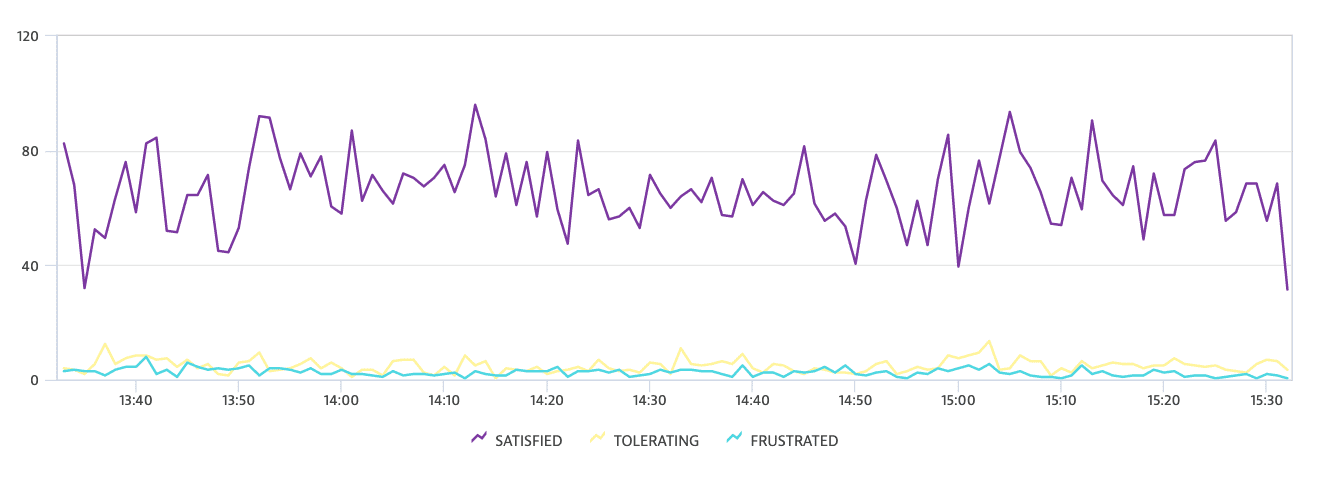
Apdex defines a performance standard to divide your application users into three groups: SATISFIED, TOLERATING, and FRUSTRATED.
For example, as an SLO goal for your application, you can specify that you want 90% of all your users within the SATISFIED category.

This SLO is calculated by dividing the number of users that are in the SATISFIED category (builtin:apps.web.actionCount.category:filter(eq(Apdex category,SATISFIED)):splitBy()) by the total number of users that are using a web or mobile application (builtin:apps.web.actionCount.category:splitBy()).
Example
-
Metric expression
(100)*(builtin:apps.web.actionCount.category:filter(eq("Apdex category",SATISFIED)):splitBy())/(builtin:apps.web.actionCount.category:splitBy()) -
Entity selector
type("APPLICATION"),entityName("My application")
Mobile crash-free users
One of the most important metrics for measuring the availability and reliability of your mobile app (iOS and Android) deployment is the percentage of Crash free user rate. Therefore, the built-in metric used is builtin:apps.other.crashFreeUsersRate.os. This metric measures the percentage of users that open and use a mobile application without experiencing a crash.
Example
-
Metric expression
(builtin:apps.other.crashFreeUsersRate.os:splitBy()) -
Entity selector
type("MOBILE_APPLICATION"),entityName("My mobile app")
Synthetic availability
A synthetic availability SLO represents the percentage of time a synthetic test was in available state or, alternatively, the percentage of successful tests to the number of total tests executed.
To define the time-based synthetic objective, the built-in metric used is builtin:synthetic.browser.availability.location.total.
Optionally, to define the time-based availability that excludes maintenance windows, the built-in metric used is builtin:synthetic.browser.availability.location.totalWoMaintenanceWindow.
Example
-
Metric expression
(builtin:synthetic.browser.availability.location.total:splitBy()) -
Entity selector
type("SYNTHETIC_TEST"),entityName("My synth test")
Additional resources
For additional insights into SLO, check the Dynatrace University tutorial Getting started with SLOs in Dynatrace.
 Service-Level Objectives Classic