Context-specific drill-down
- Latest Dynatrace
- Reference
- 4-min read
- Published Nov 13, 2018
Context-specific drill-down menus simplify navigation and filtering of results presented on Dynatrace service-analysis views. You can quickly slice through vast amounts of data in just a few clicks.
Table-based layouts
Table-based layouts have this set of buttons on the right-hand side of each table row:
Context-sensitive filters
Context-specific filters are available on nearly all service analysis pages that feature table-based layouts.
Selecting the filter button of a specific service instance in the service instance table filters the entire page to show only the results of that specific service instance. Have a look at the example service Details page below. Selecting the filter button of a specific service instance in the service instance table will filter the entire page to show only the results of that specific service instance.
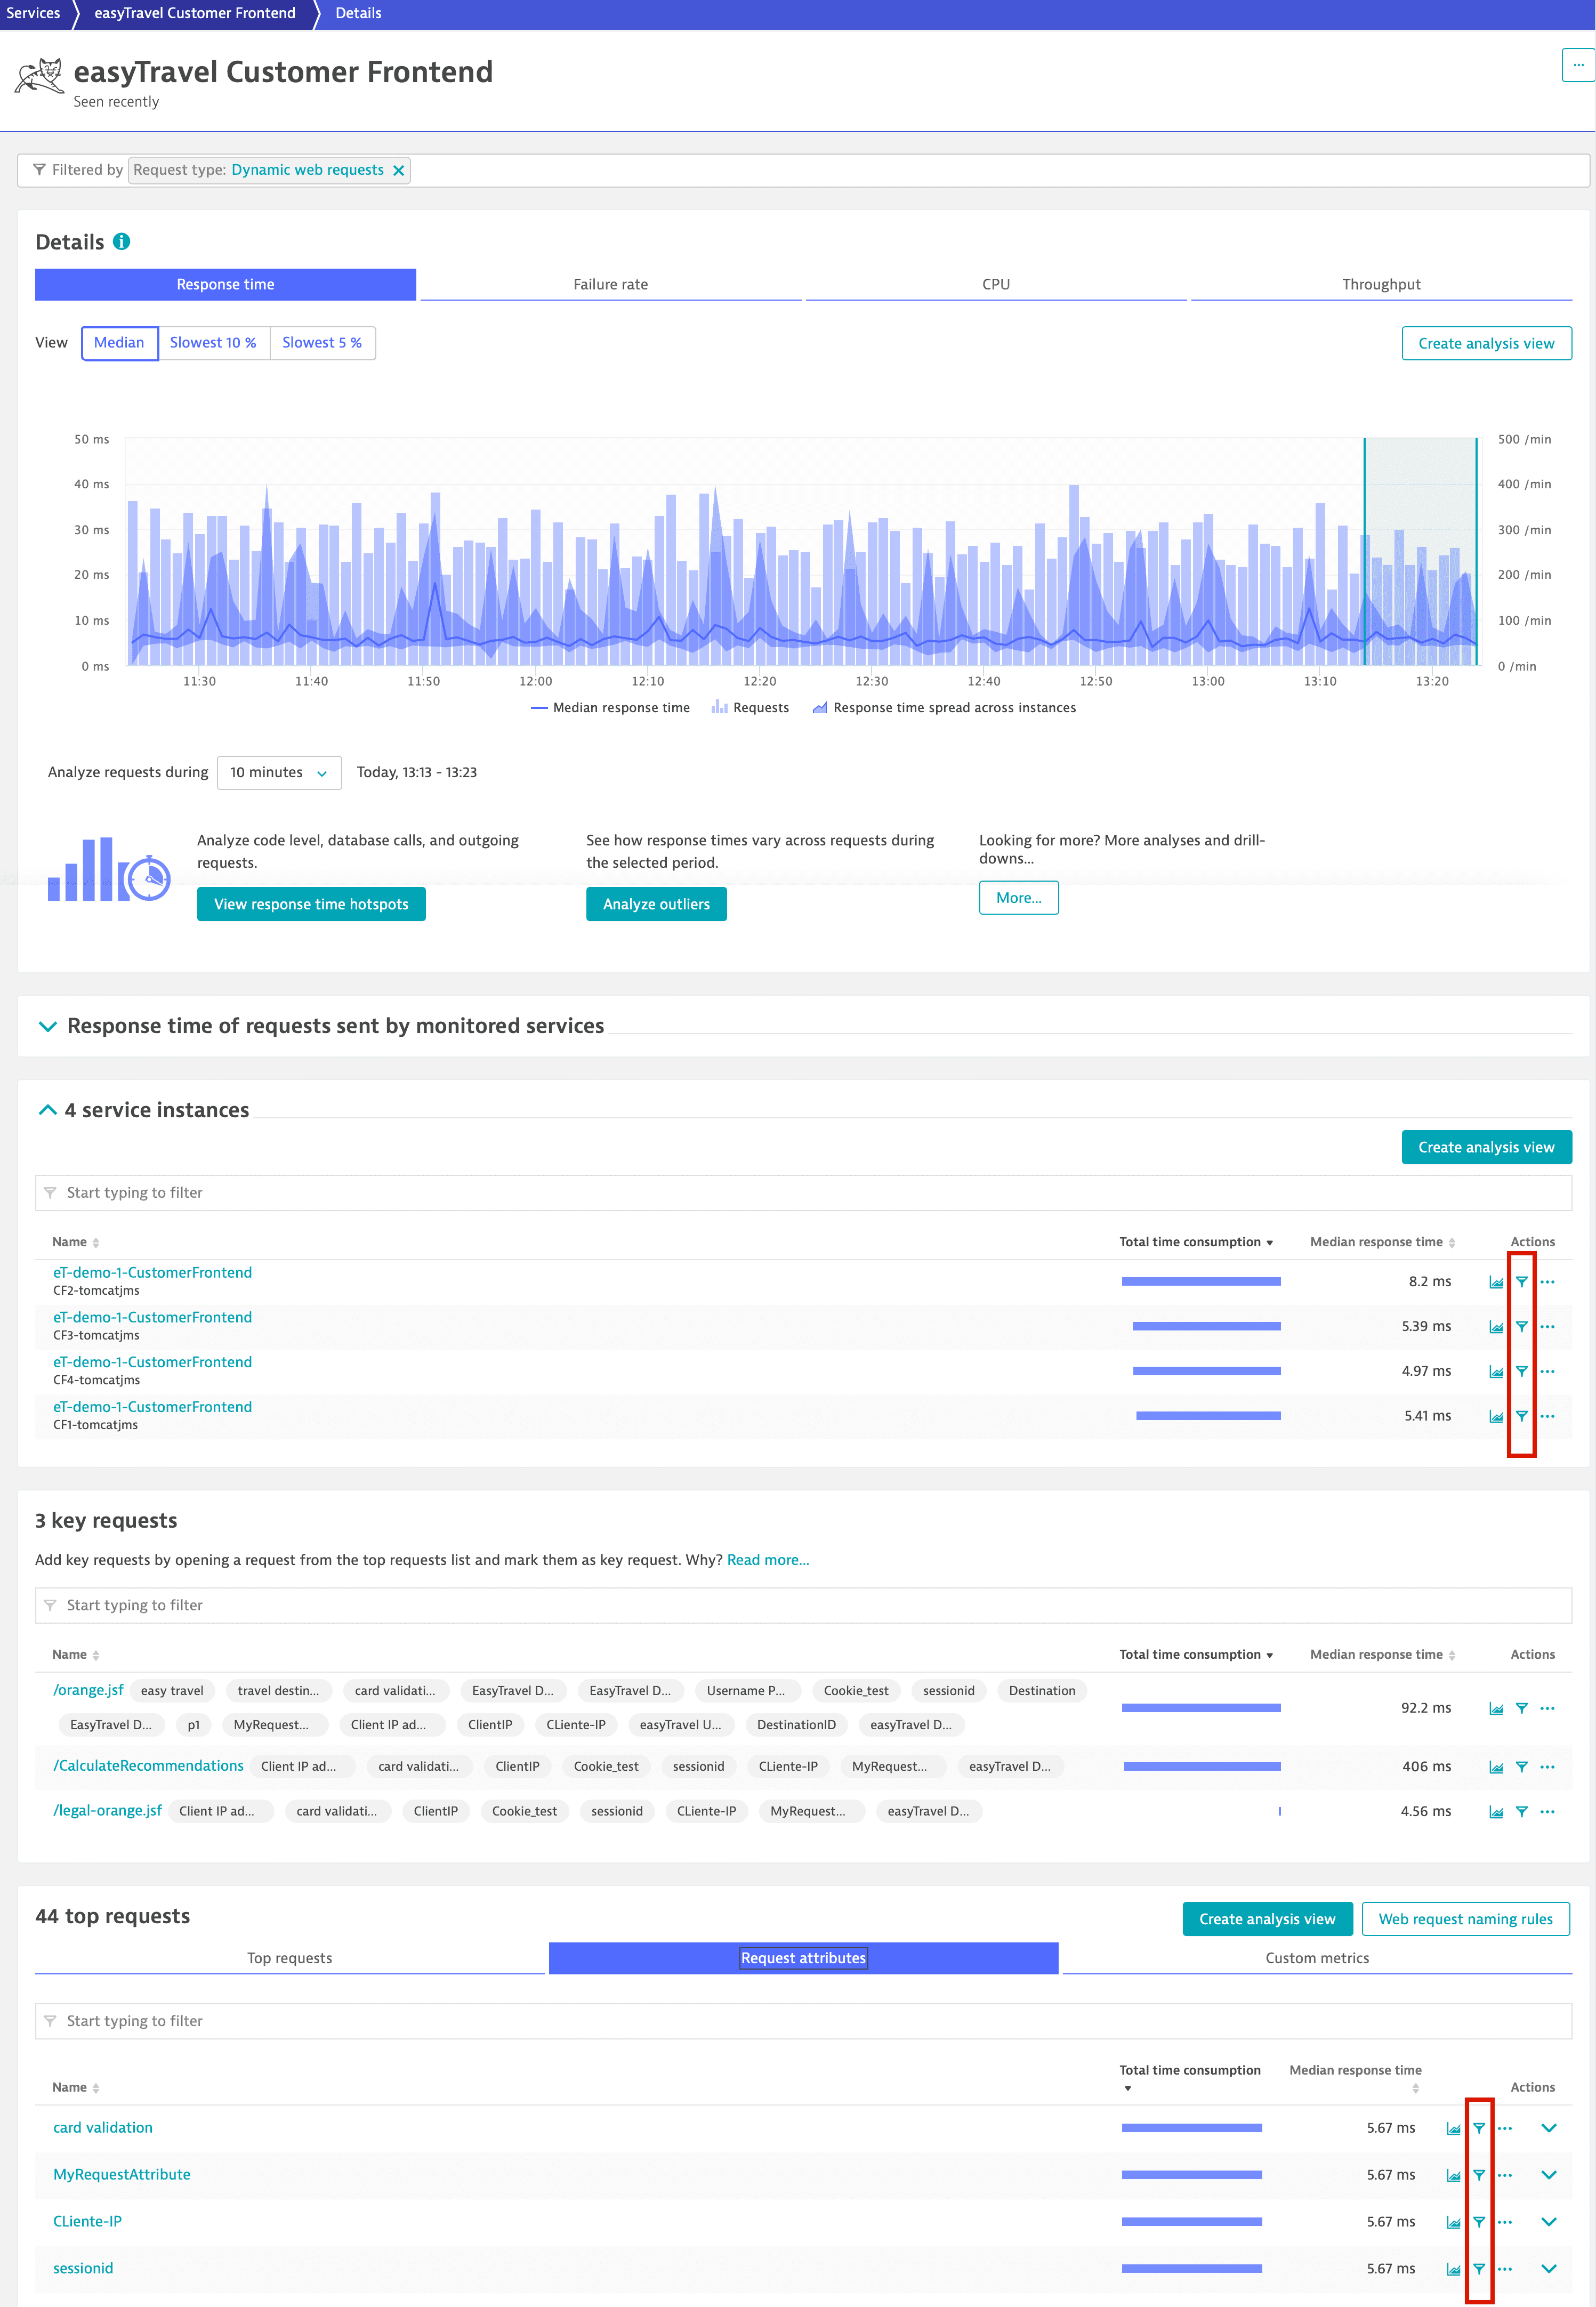
Similarly, selecting the filter button of a specific request attribute on the Request attributes tab filters the entire page to show only those results that relate to the selected request attribute.
Create context-sensitive charts
Context-specific chart creation is available on nearly all service analysis pages that feature table-based layouts.
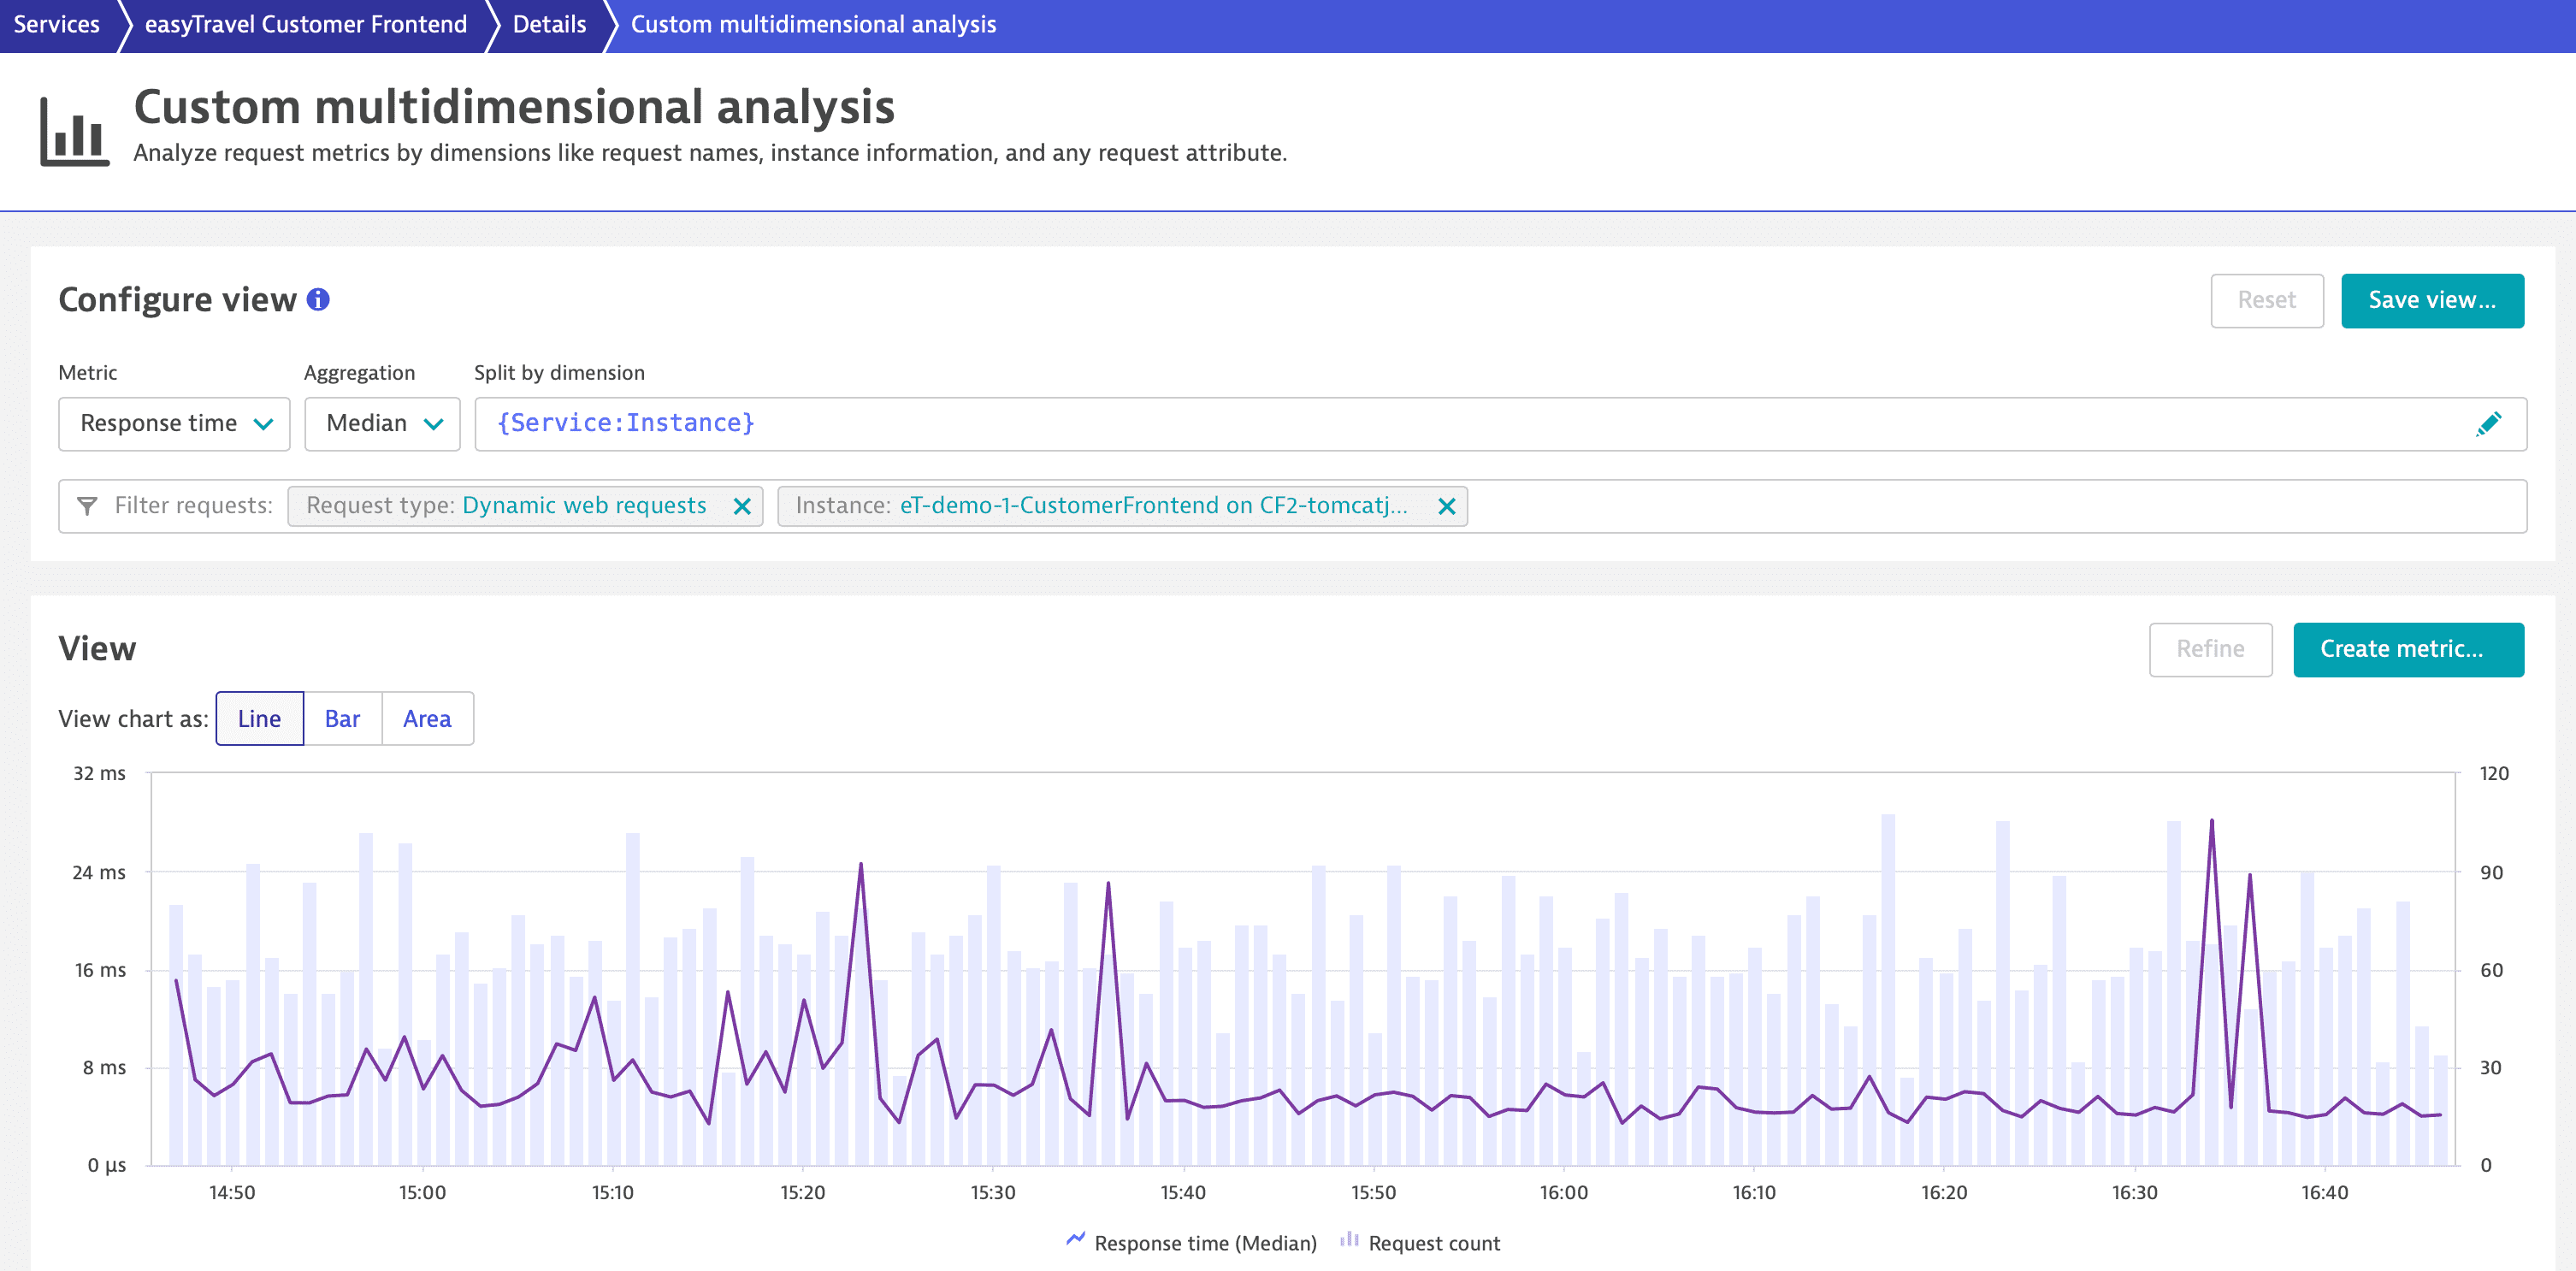
Select any row's chart button to create a chart based on the contents of the selected row. This simplifies the process of creating charts based on custom metrics or request attributes.

The following chart represents the response time of a Custom Frontend service instance. This can also be done on the CPU tab to display the total CPU time of an instance.
Context-sensitive drill-down menus
The Analyze menus, available for results on all table-based service analysis pages, reveal all possible drill-downs and analysis options based on the current context.
Take a look to the expanded Analyze menu below. In this example we see options for context-sensitive analysis based on Method hotspots, Outliers, Distributed traces, Response time hotspots, Service backtrace, Comparison, Service flow, and Top web requests.
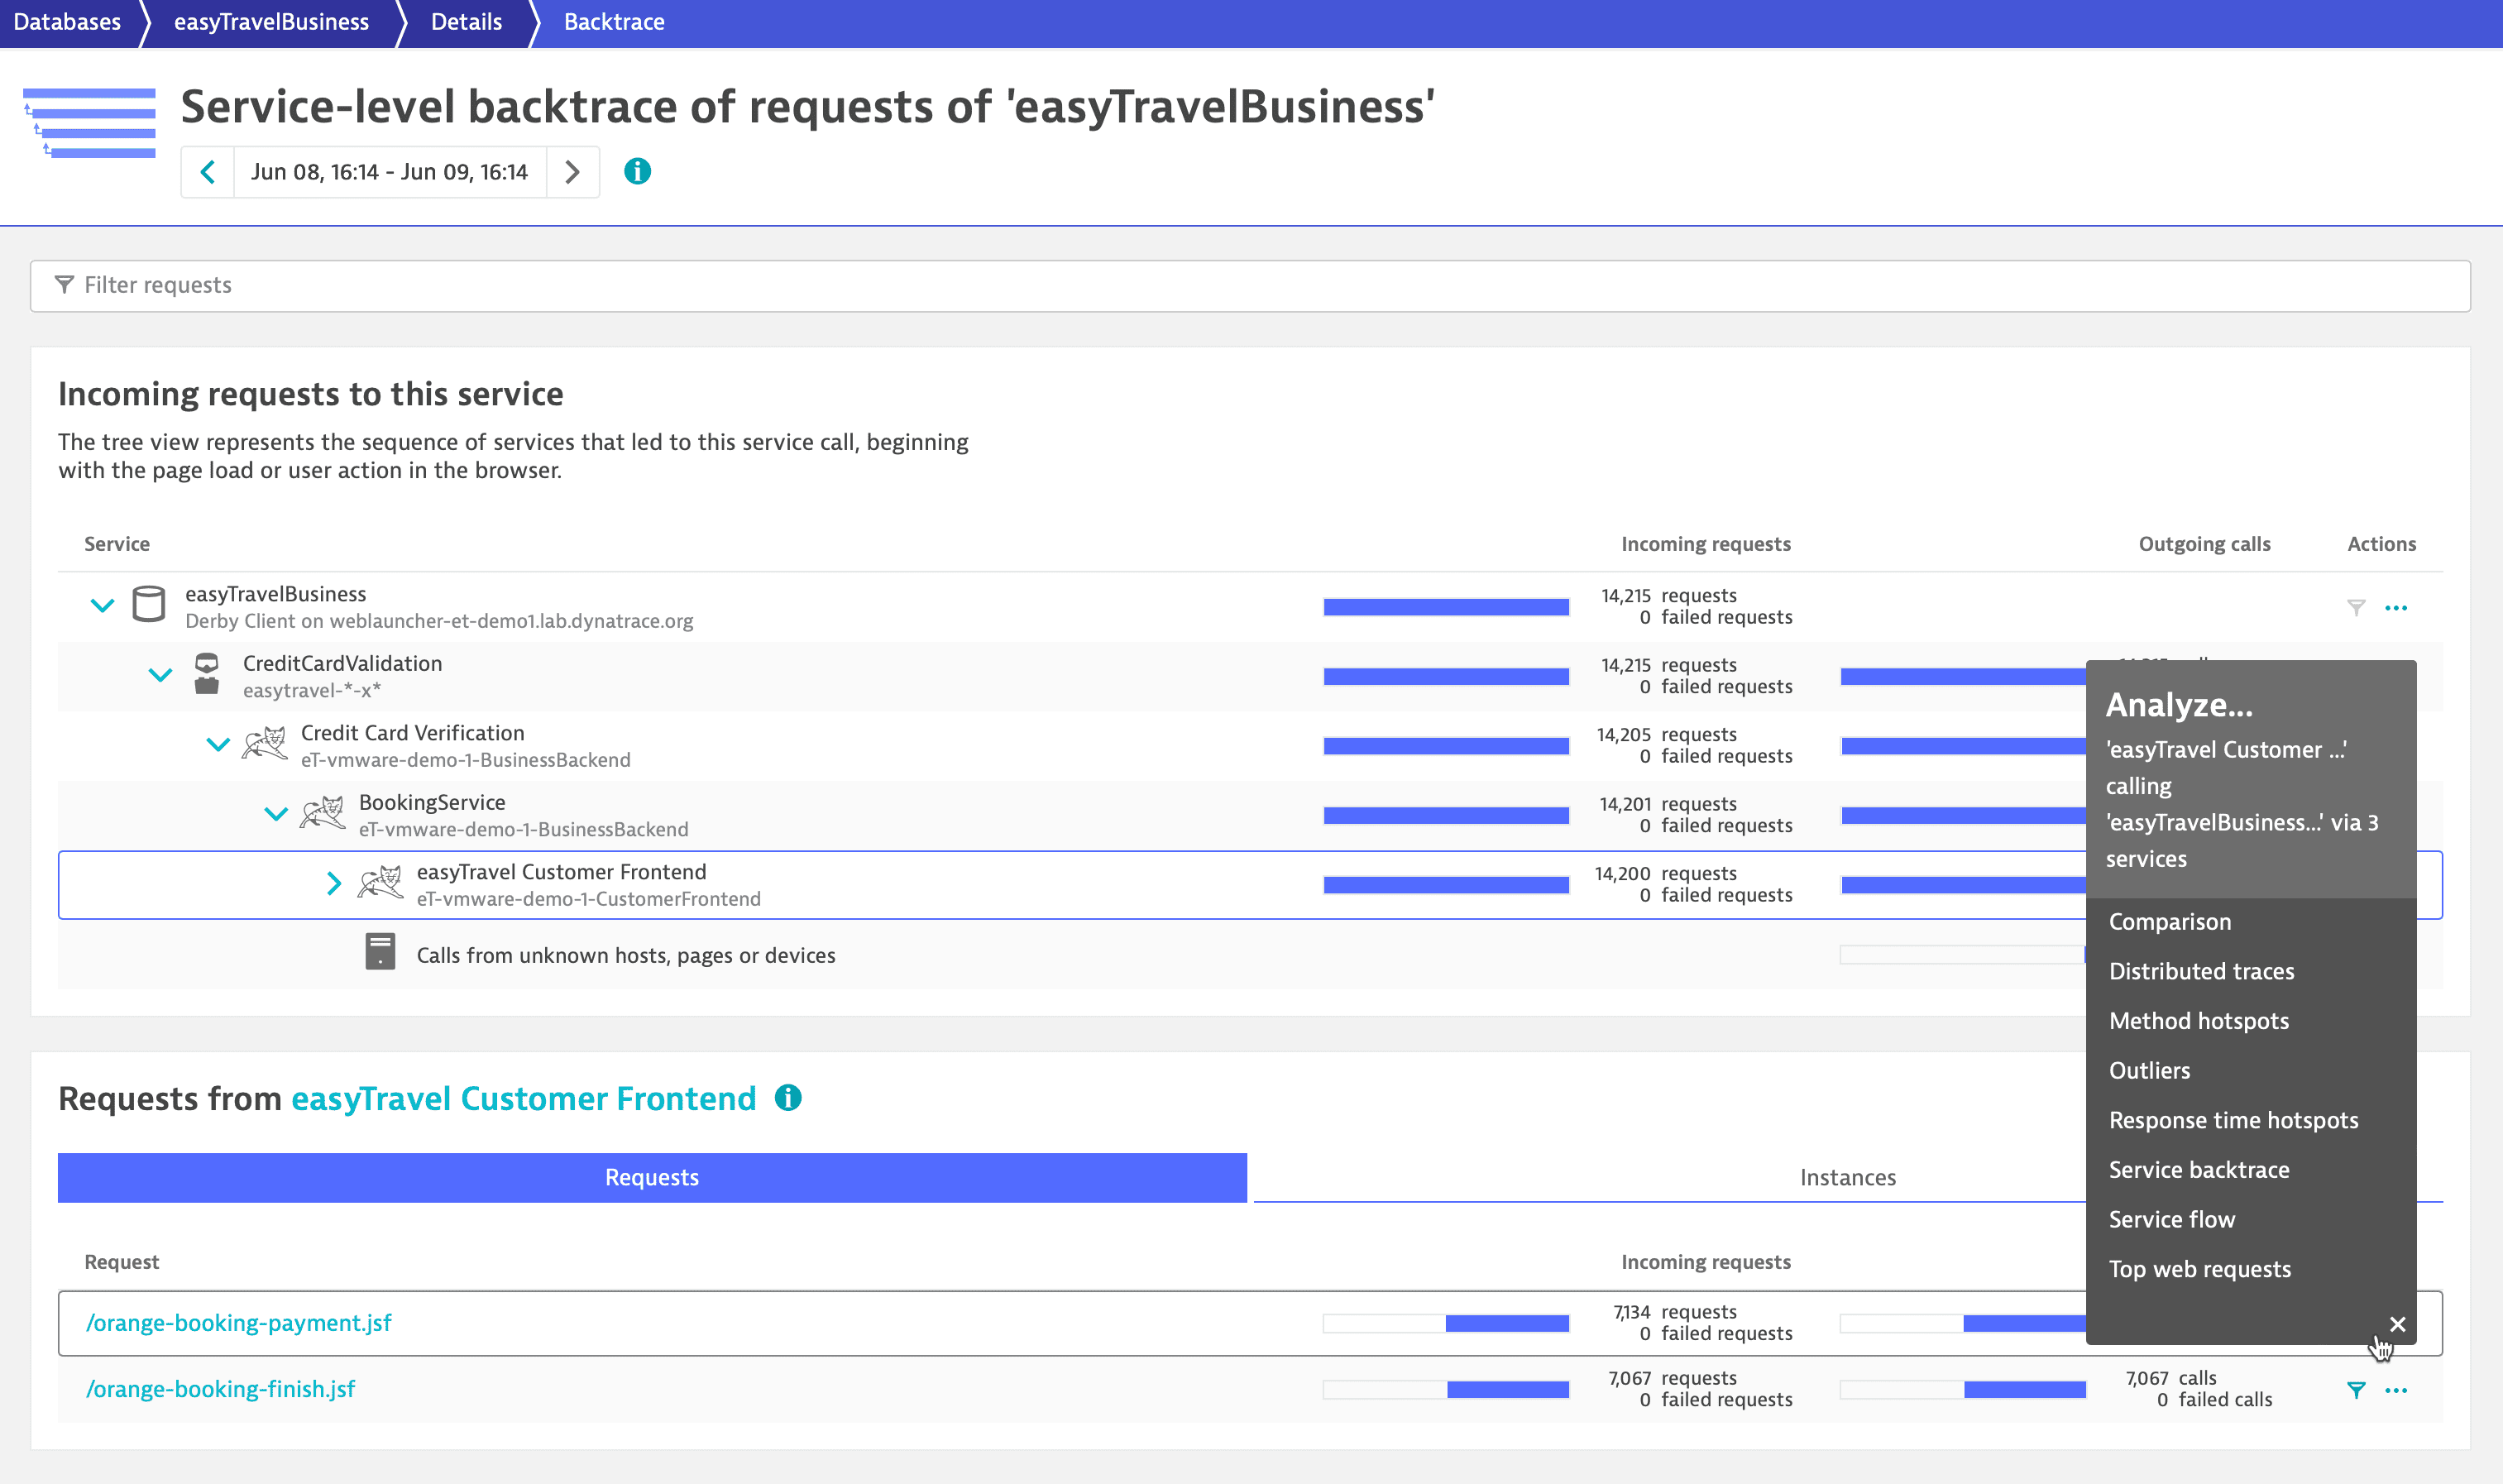
In the example above, we've selected the Customer Frontend service in the Incoming requests to this service section and the orange-booking-payment.jsf request in the Requests from section. This drill-down combination focuses the analysis on all orange-booking-payment.jsf requests of the Customer Frontend service that call the easyTravel-Business database via other tree services. Additionally, filters applied via Filter requests are carried over to any analysis option you select from the Analyze menu.
Multi-dimensional analysis
The context-specific menu for multi-dimensional analysis enables you to perform context-sensitive analysis based on individual time series metrics included in your charts. This menu includes all the filtering functionality that's available on the service-analysis pages, along with advanced capabilities for charting and splitting based on multiple dimensions.
Service flow
While Service flow doesn't include tables, you can still access context-sensitive drill-down menus from this view:
or
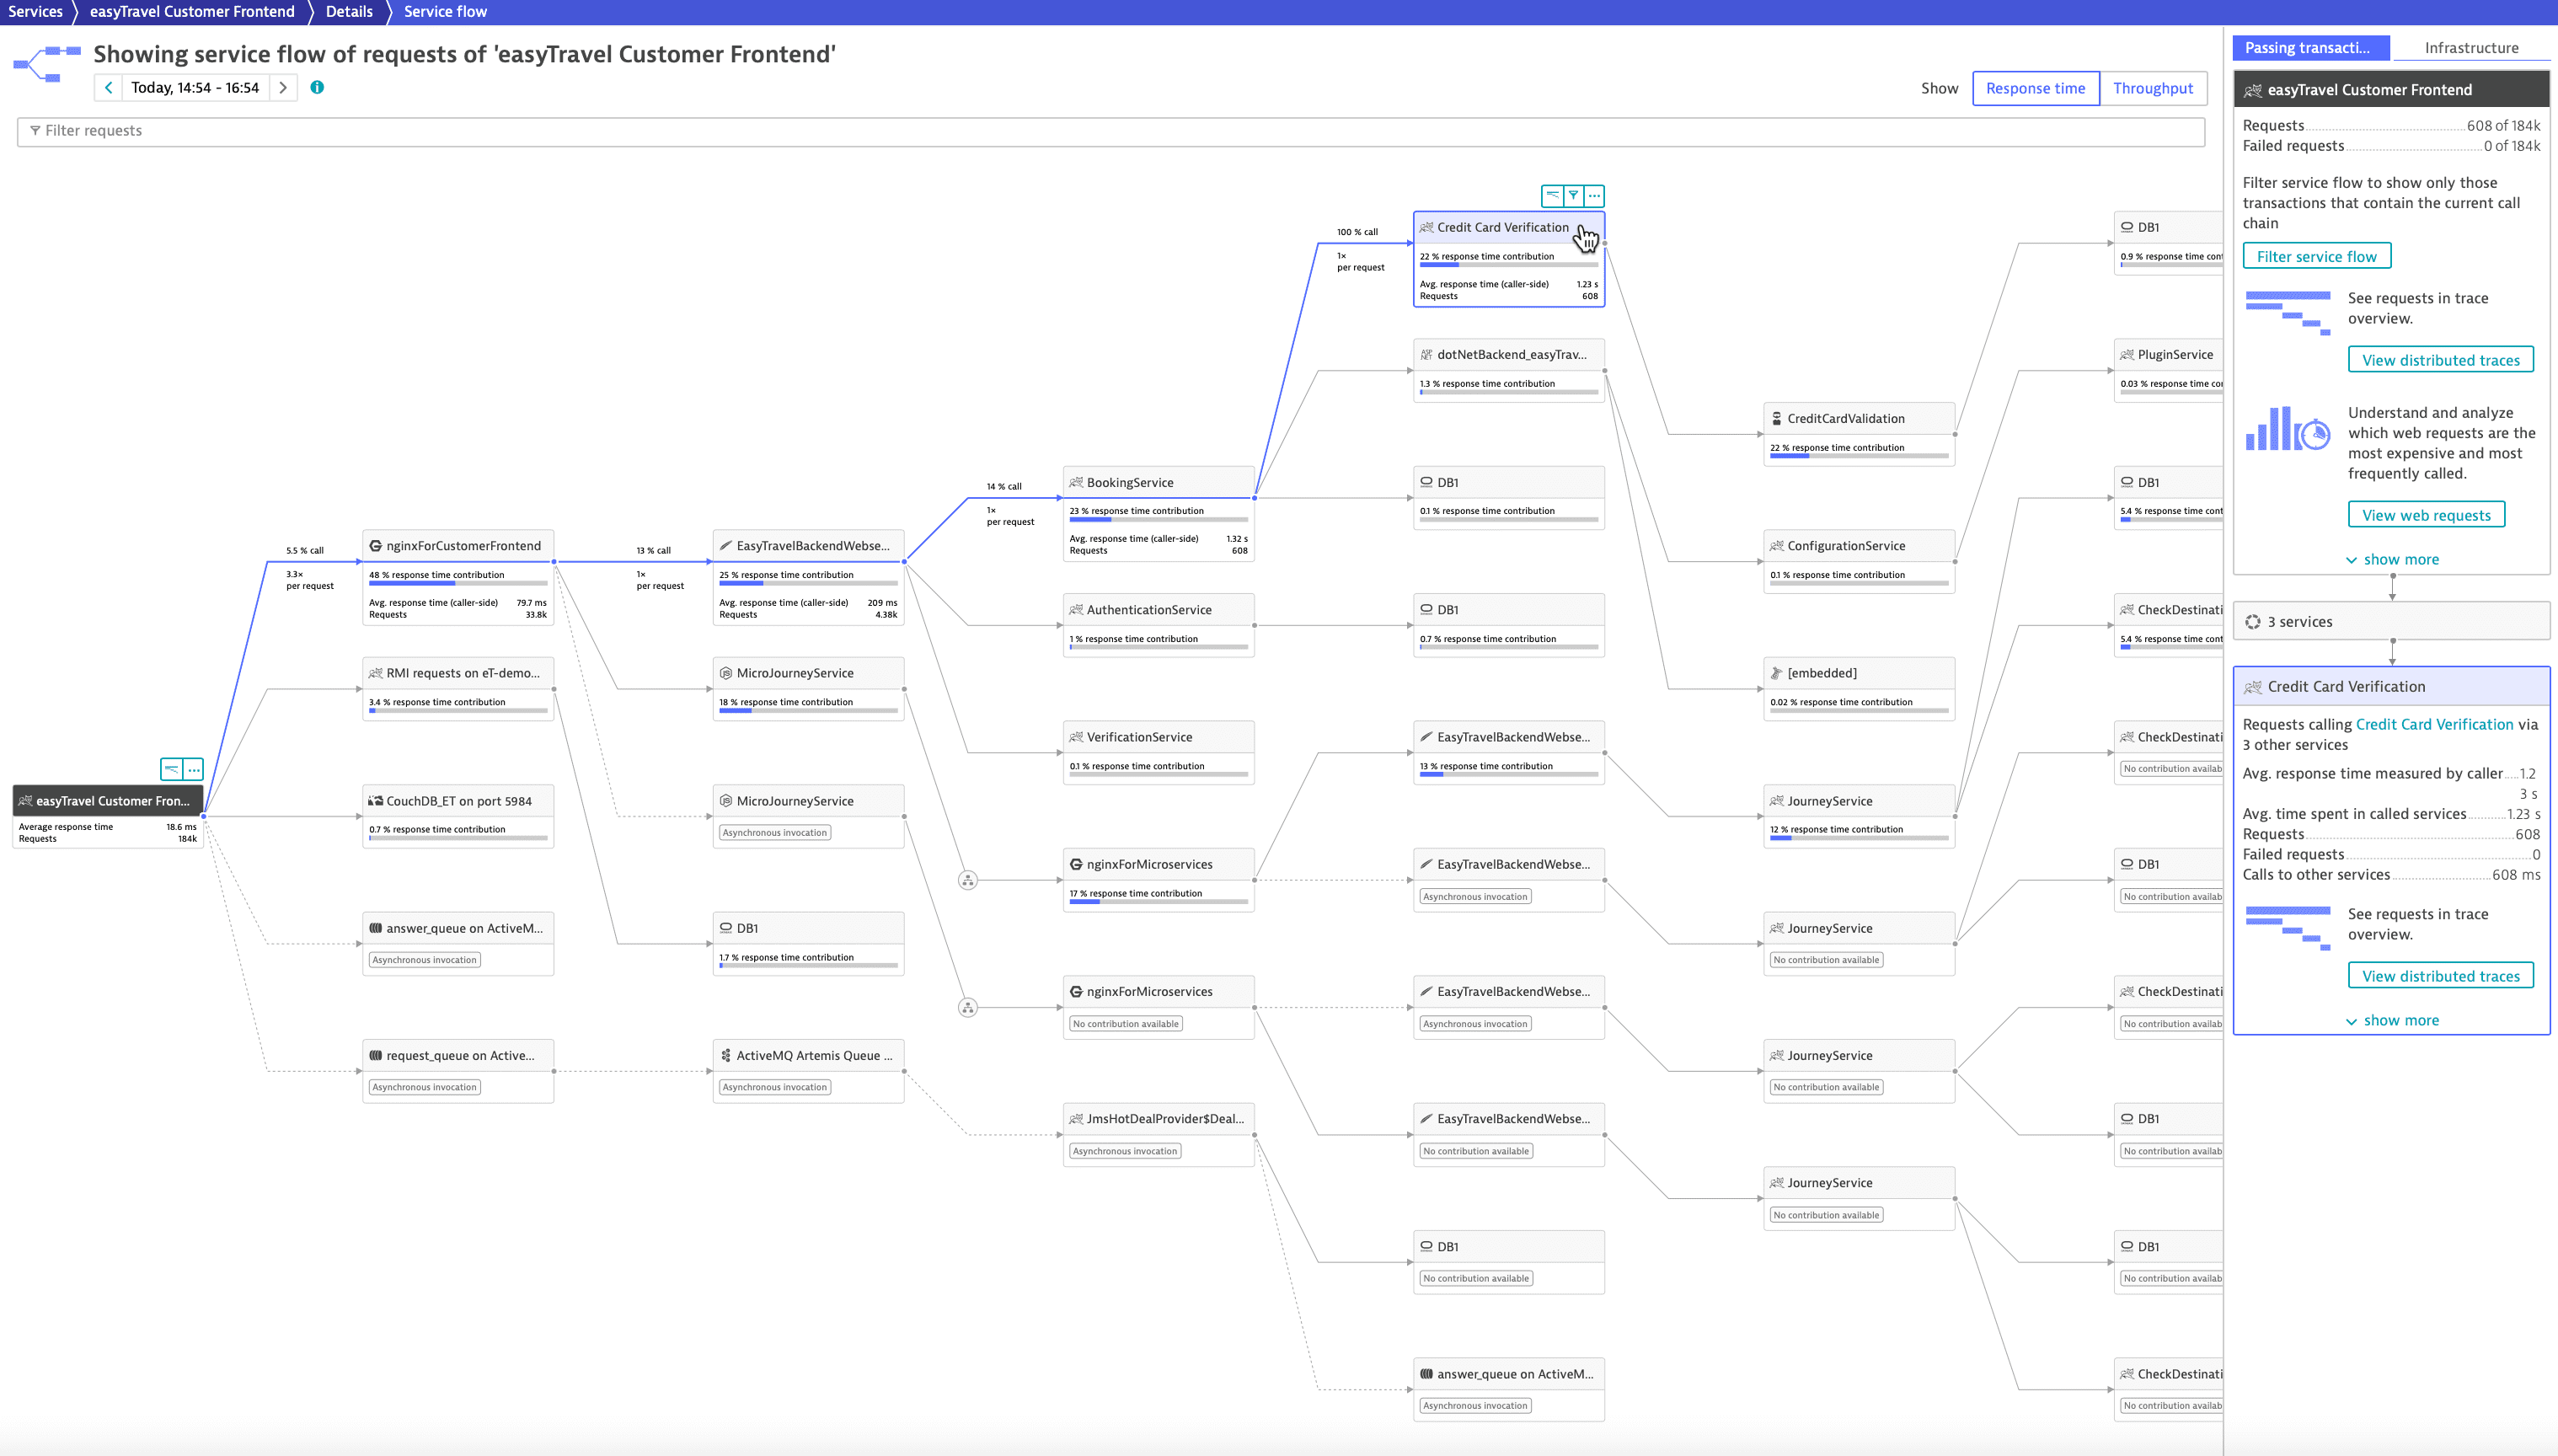
Select any service in the service flow and you'll now see a hovering drill-down menu.
Context-sensitive PurePath® distributed traces
Context-specific distributed traces are available for all non-database services.
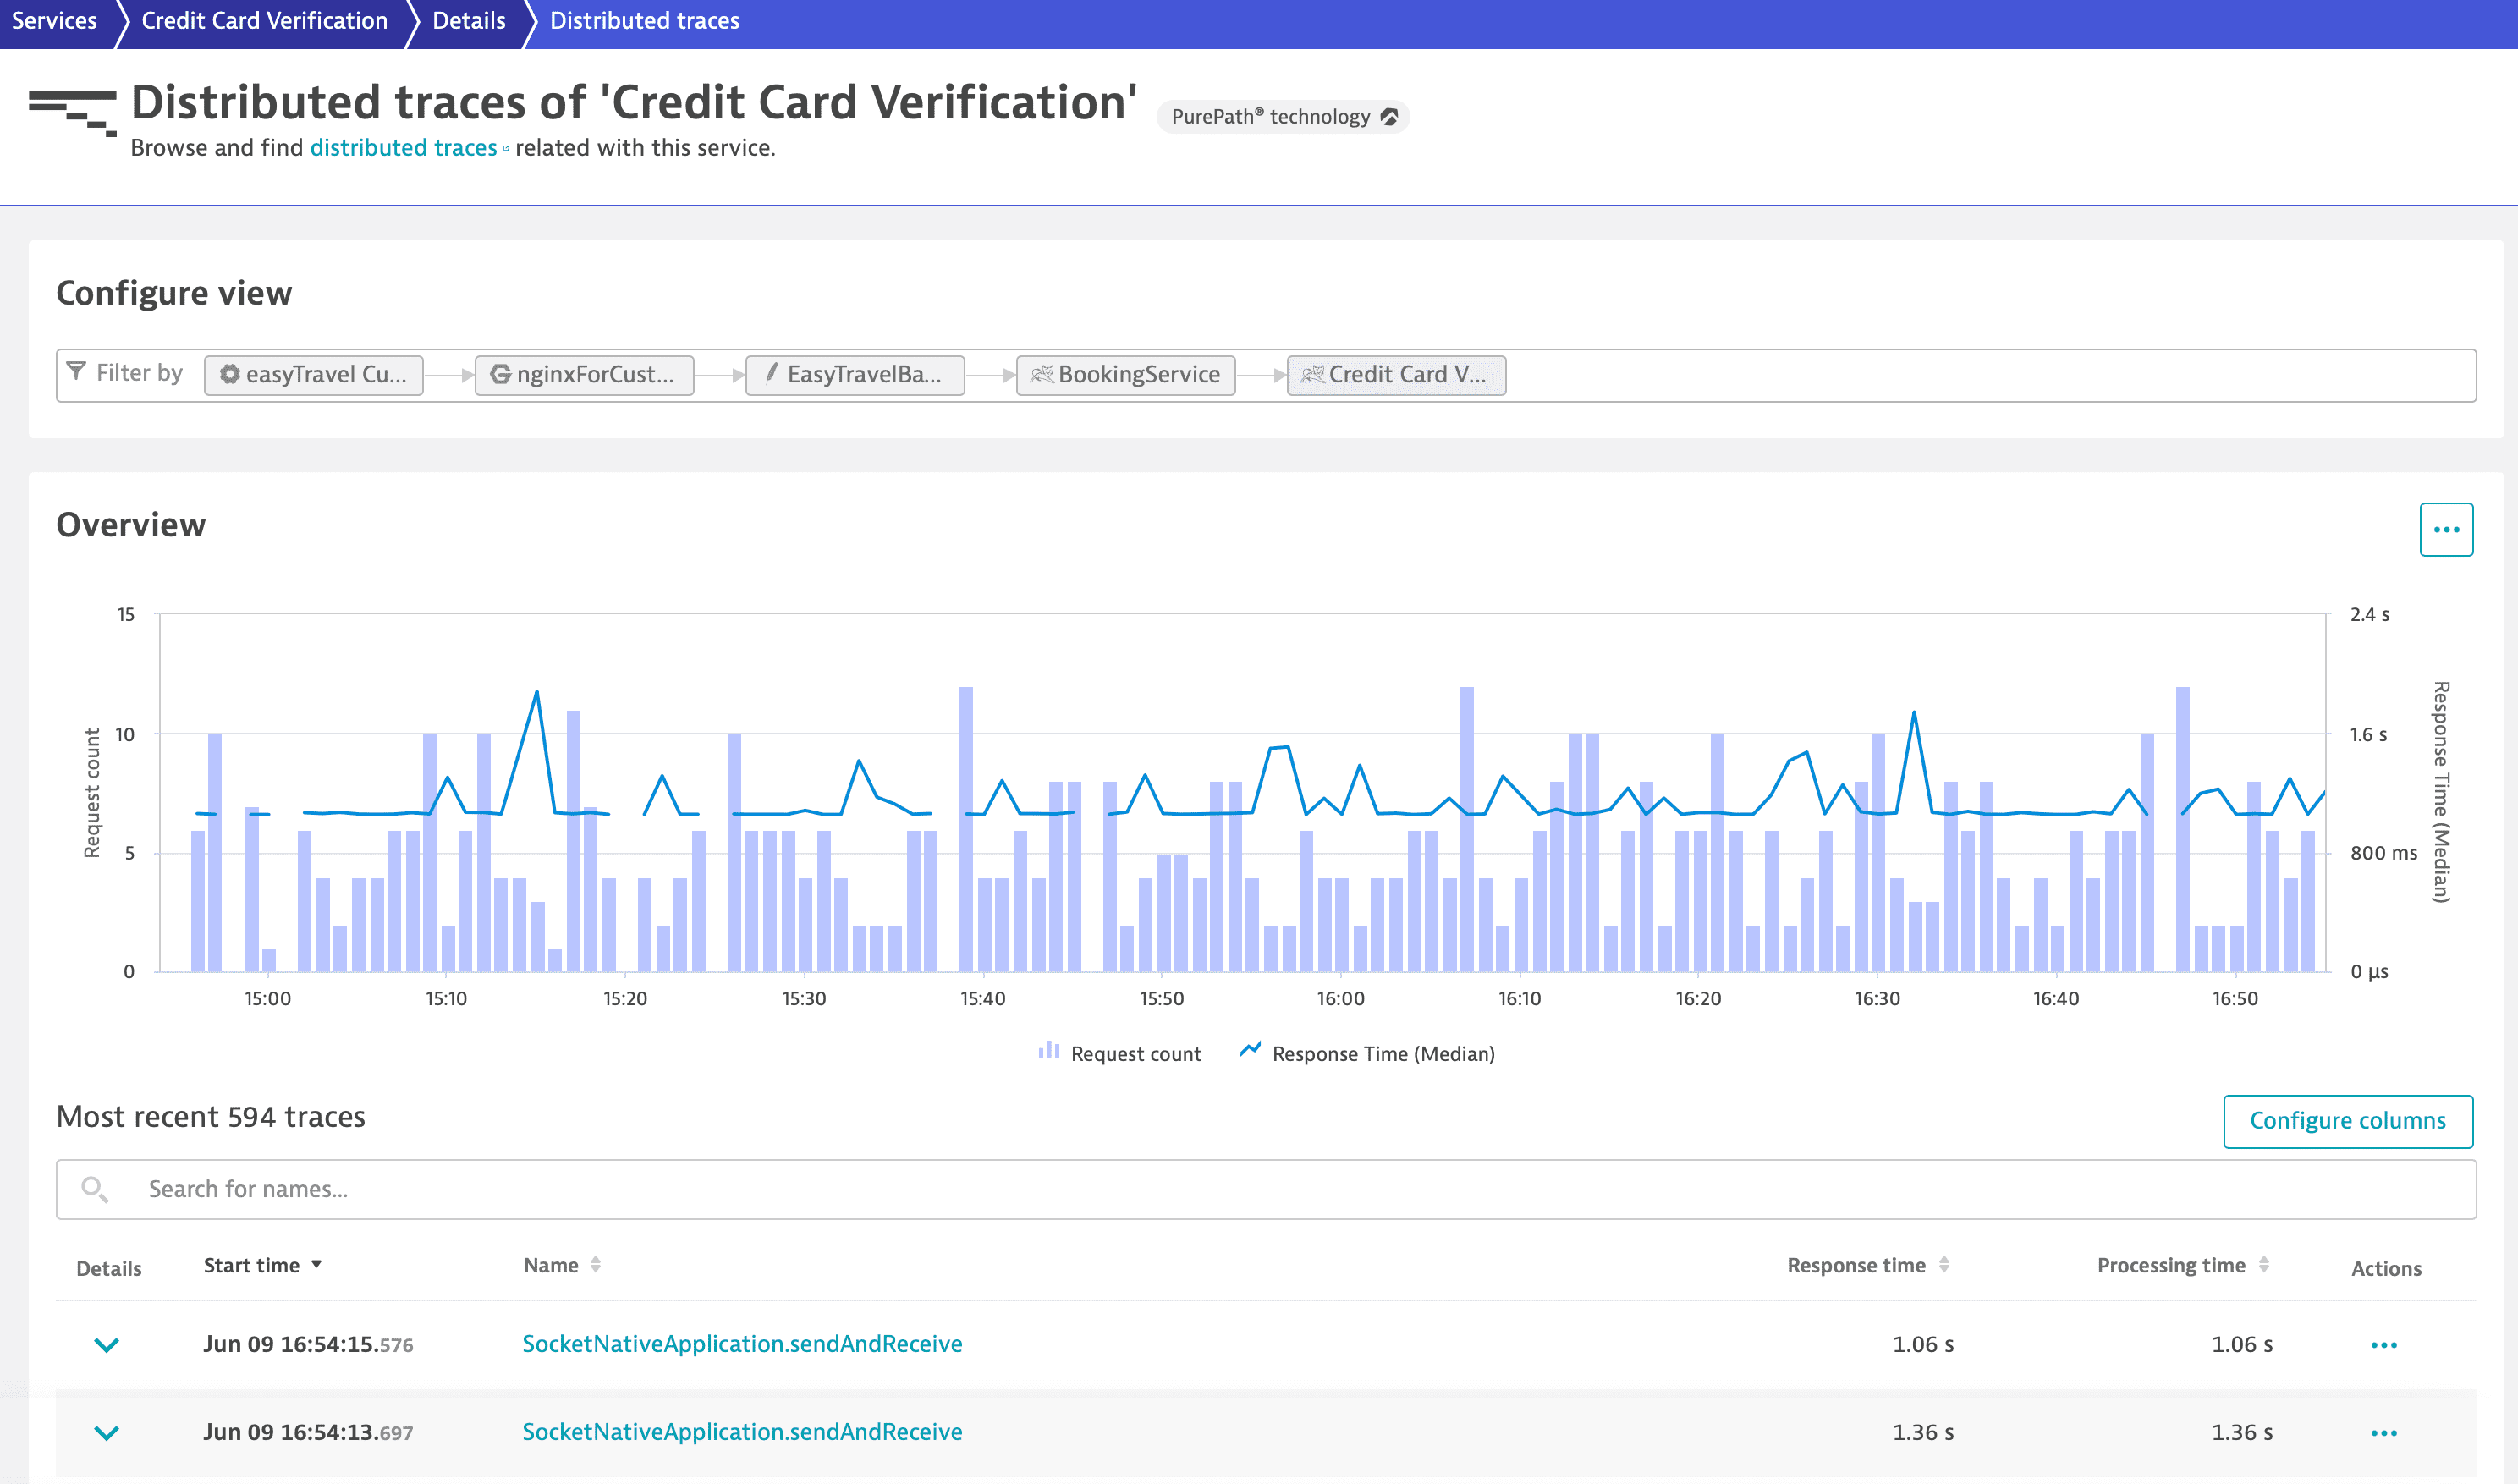
Select Distributed traces to view the Distributed traces page filtered to display only those distributed traces that trigger the depicted service flow (easyTravel Customer Frontend in the example below) and subsequently call the selected service (Credit Card Verification in the example below).
Context-sensitive database statements
Context-specific database statements are available for most of database services.
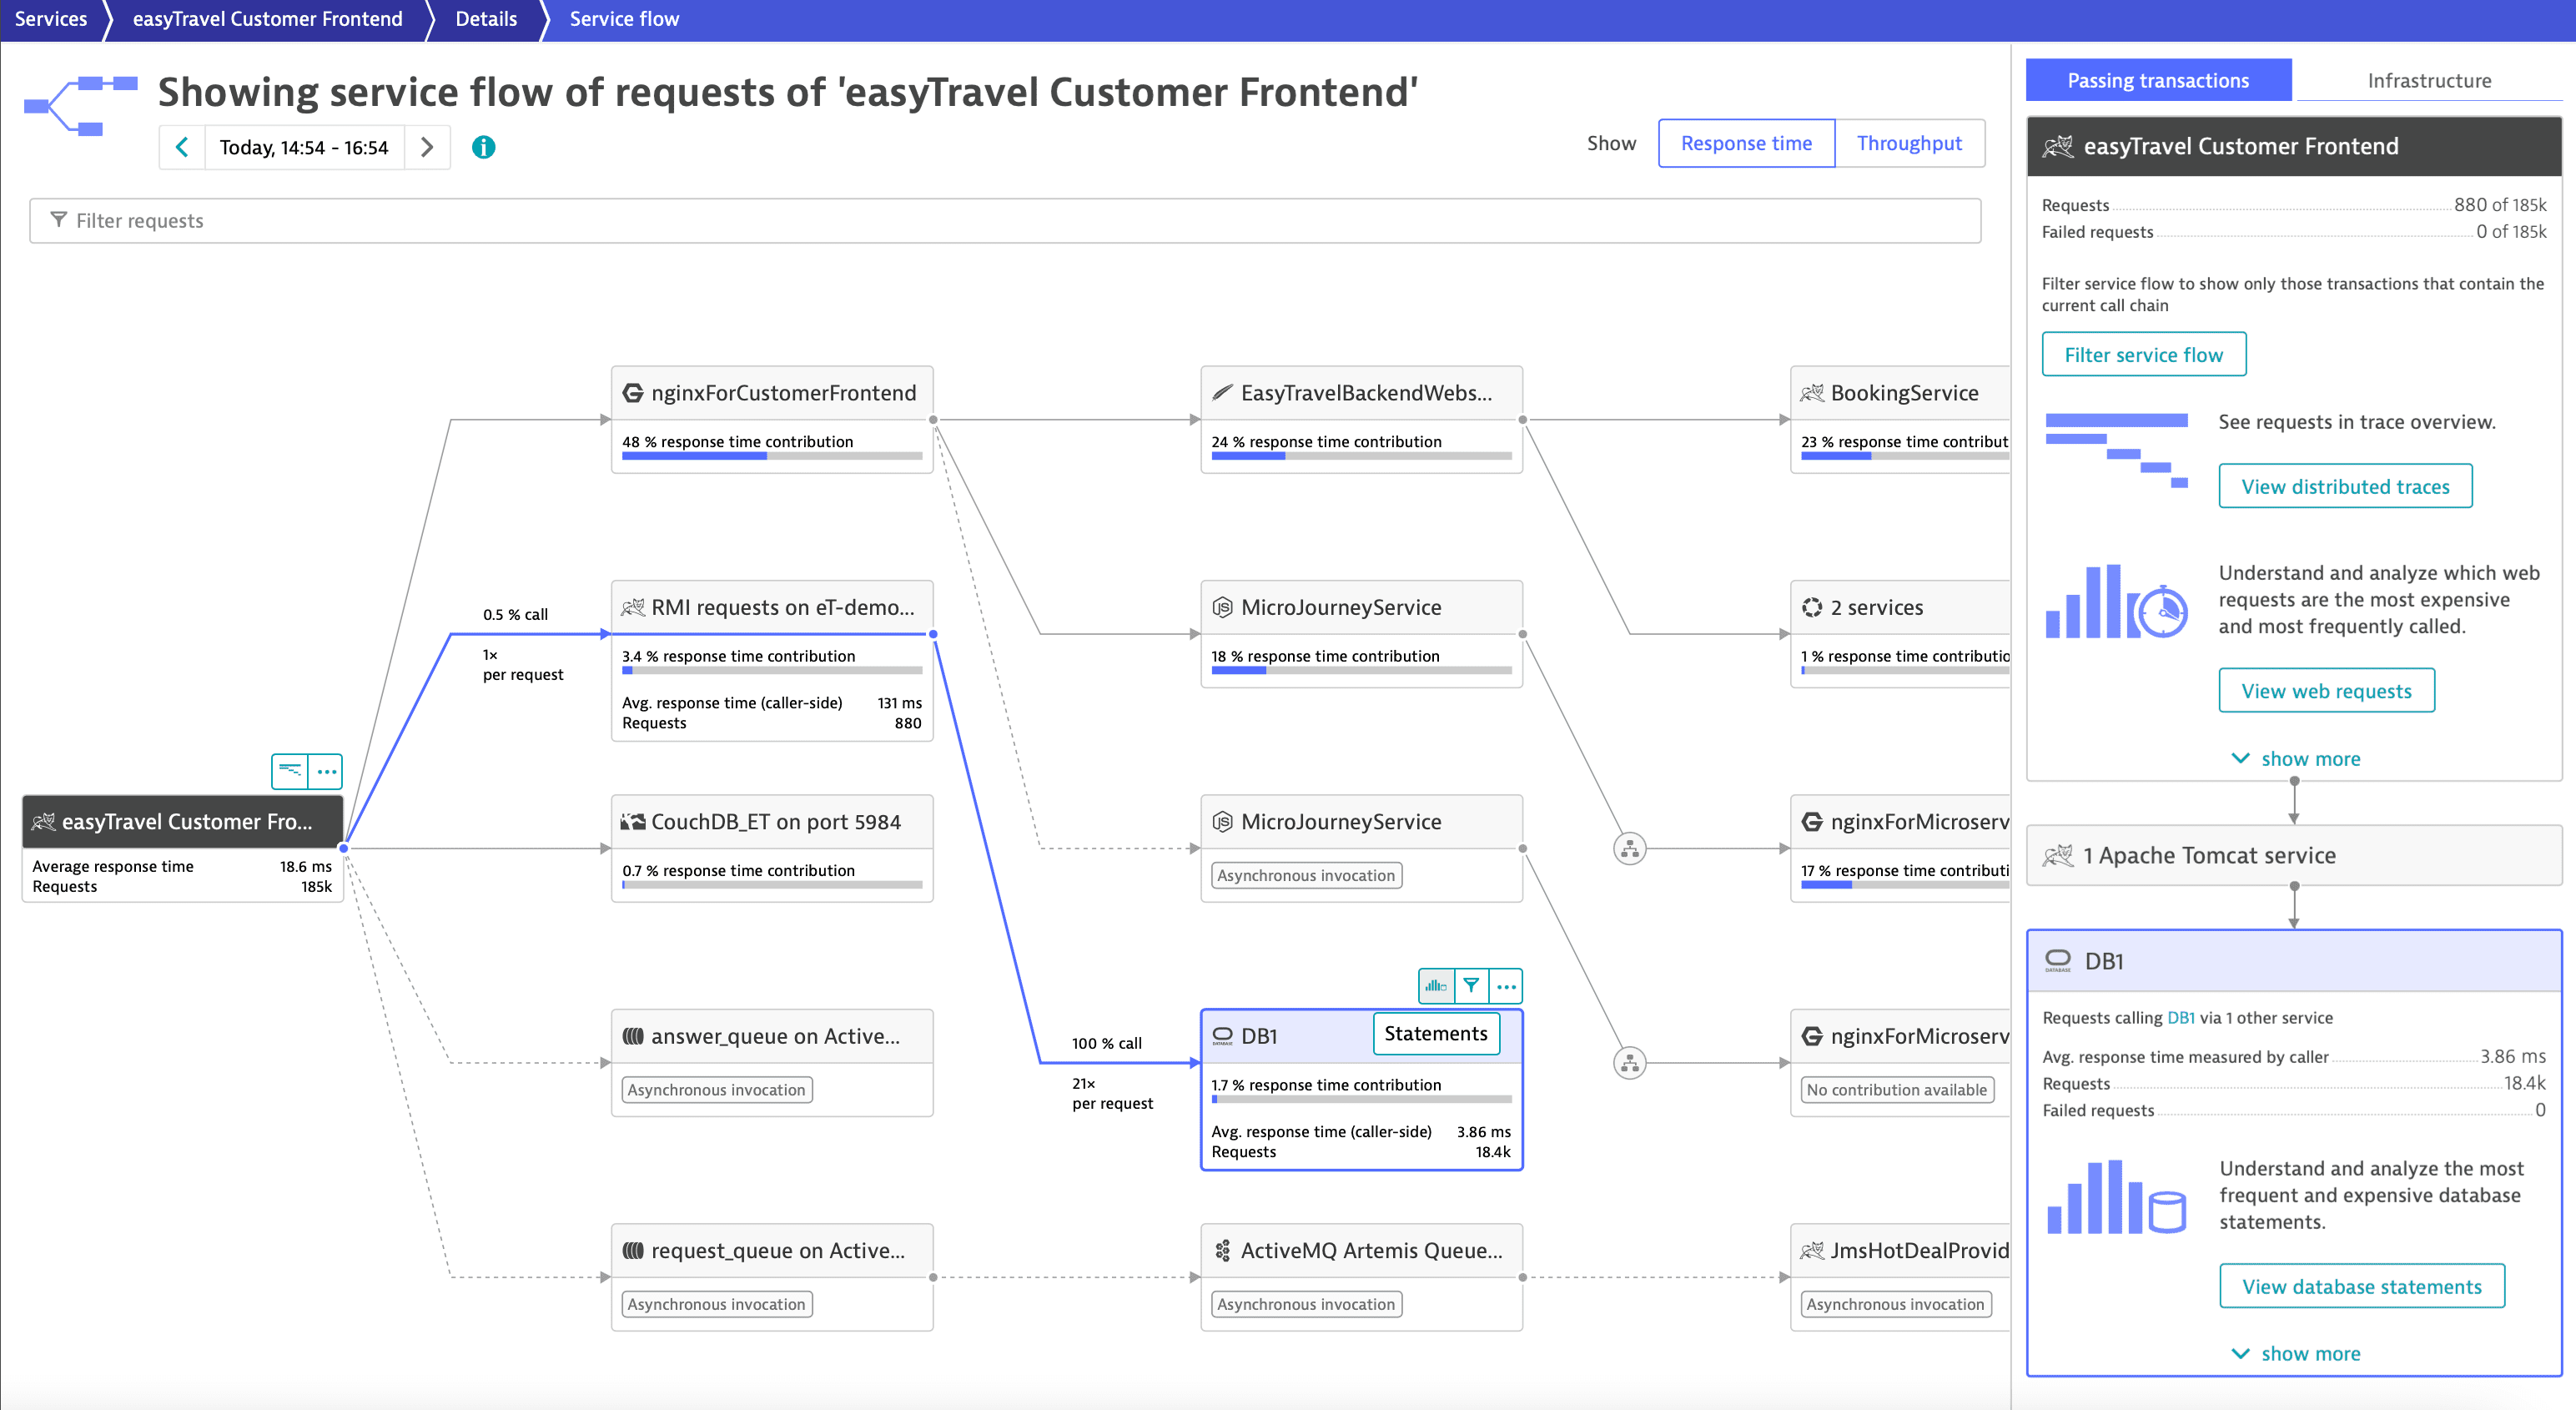
Select Top database statements to view the Top database statements page, filtered to display only those statements in the database (DB1`` at the picture below) executed by calls, originating in service, that triggered Service flow (easyTravel Customer Frontend` at the picture below).
Context-sensitive filters
Context-specific filters are available for all services.
They filter service flow to calls originating in the service that triggered the service flow and subsequently called the selected service—just like the Filter service flow button in the top tile of the side pane.
Context-sensitive drill-down menus
The Analyze menus, available for all services, reveal all possible drill-downs and analysis options based on the currently selected service.