Prioritize vulnerabilities
- Latest Dynatrace
- How-to guide
In the following, you'll learn to prioritize third-party, code-level, and runtime vulnerabilities based on
Prioritize by Davis Security Score
Third-party vulnerabilities
The risk level (severity) of a vulnerability is calculated based on Davis Security Score (DSS), so you can focus on fixing vulnerabilities that are relevant in your environment, instead of on those that have only a theoretical impact. See below for your options.
Filter by DSS
Use Davis Security Score filters to focus on vulnerabilities based on their severity and risk classification.
On the Prioritization page, in the filter field, you can filter by
- The DSS score (select Davis Security Score and then enter a score)
- The risk level (select Davis Risk Level and then select a severity)
For details, see Filter expressions.
Get details about DSS calculation
View how the Davis Security Score is calculated for individual vulnerabilities.
- On the Prioritization page, select a vulnerability.
- In the side panel, go to Overview and look for Davis Security Score calculation.

FAQ
Further reading
To learn more about DSS, see Concepts: Davis Security Score.
Prioritize by Davis Assessment
Prioritize vulnerabilities by analyzing the risk factors and assessment modes taken into consideration when determining the Davis Security Score. By understanding the assessment modes behind the Davis Security Score, you can make smarter remediation decisions, tailor your response to business impact, and stay ahead of emerging threats. See below for your options.
Filter by risk factors and assessment modes
Use filters to narrow down vulnerabilities based on Davis Security Score assessment modes and associated risk factors.
- On the Prioritization page, in the filter field, select Davis Assessment.
- Select the options you're interested in.

For details, see Filter expressions.
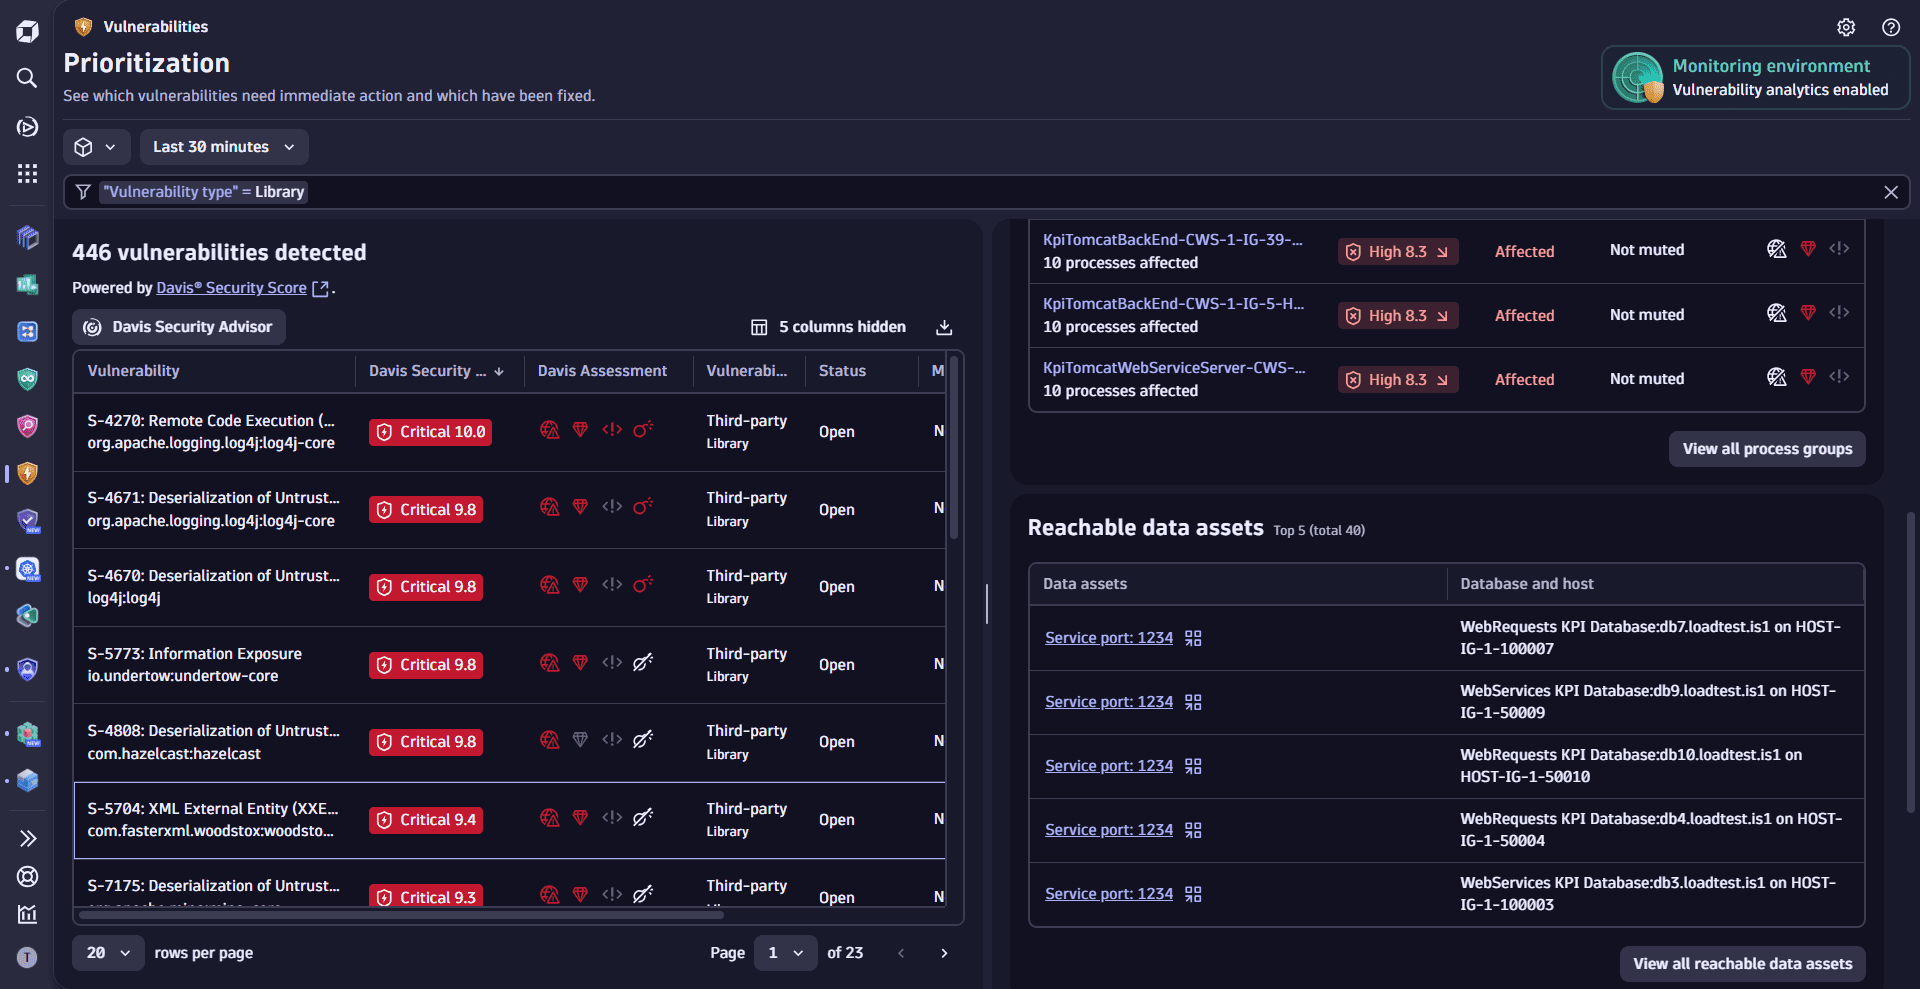
Review reachable data assets
Investigate which database services are impacted by the vulnerability and trace direct connections to affected assets.
- On the Prioritization page, select a vulnerability.
- In the side panel, go to Affected entities and look for Reachable data assets.
Review vulnerable functions
Third-party vulnerabilities
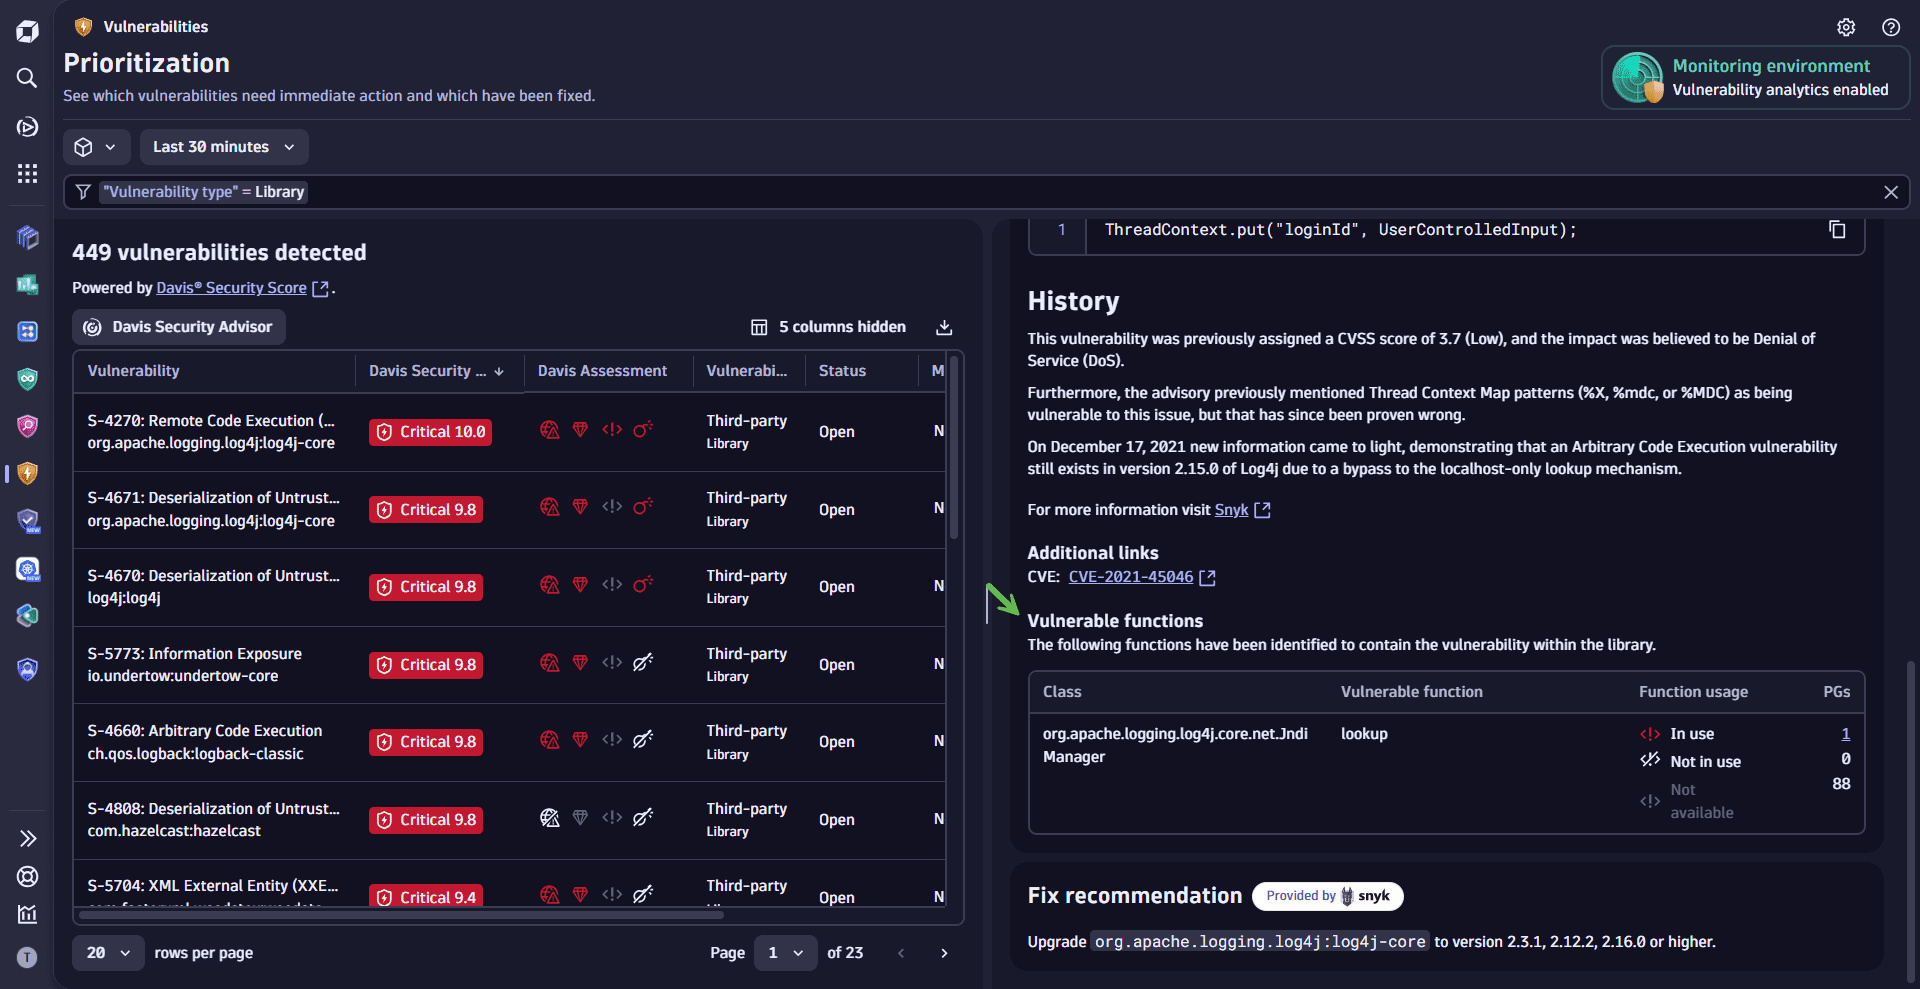
Identify which functions are affected by the vulnerability and assess their usage within your application.
- On the Prioritization page, select a vulnerability.
- In the side panel, go to Details and look for Vulnerable functions.
Further reading
To learn more about the risk factors, see Concepts: Risk factors.
Prioritize by related and affected entities
Identify what’s at risk by examining the entities connected to each vulnerability. See below for your options.
Review related and affected process groups or Kubernetes nodes
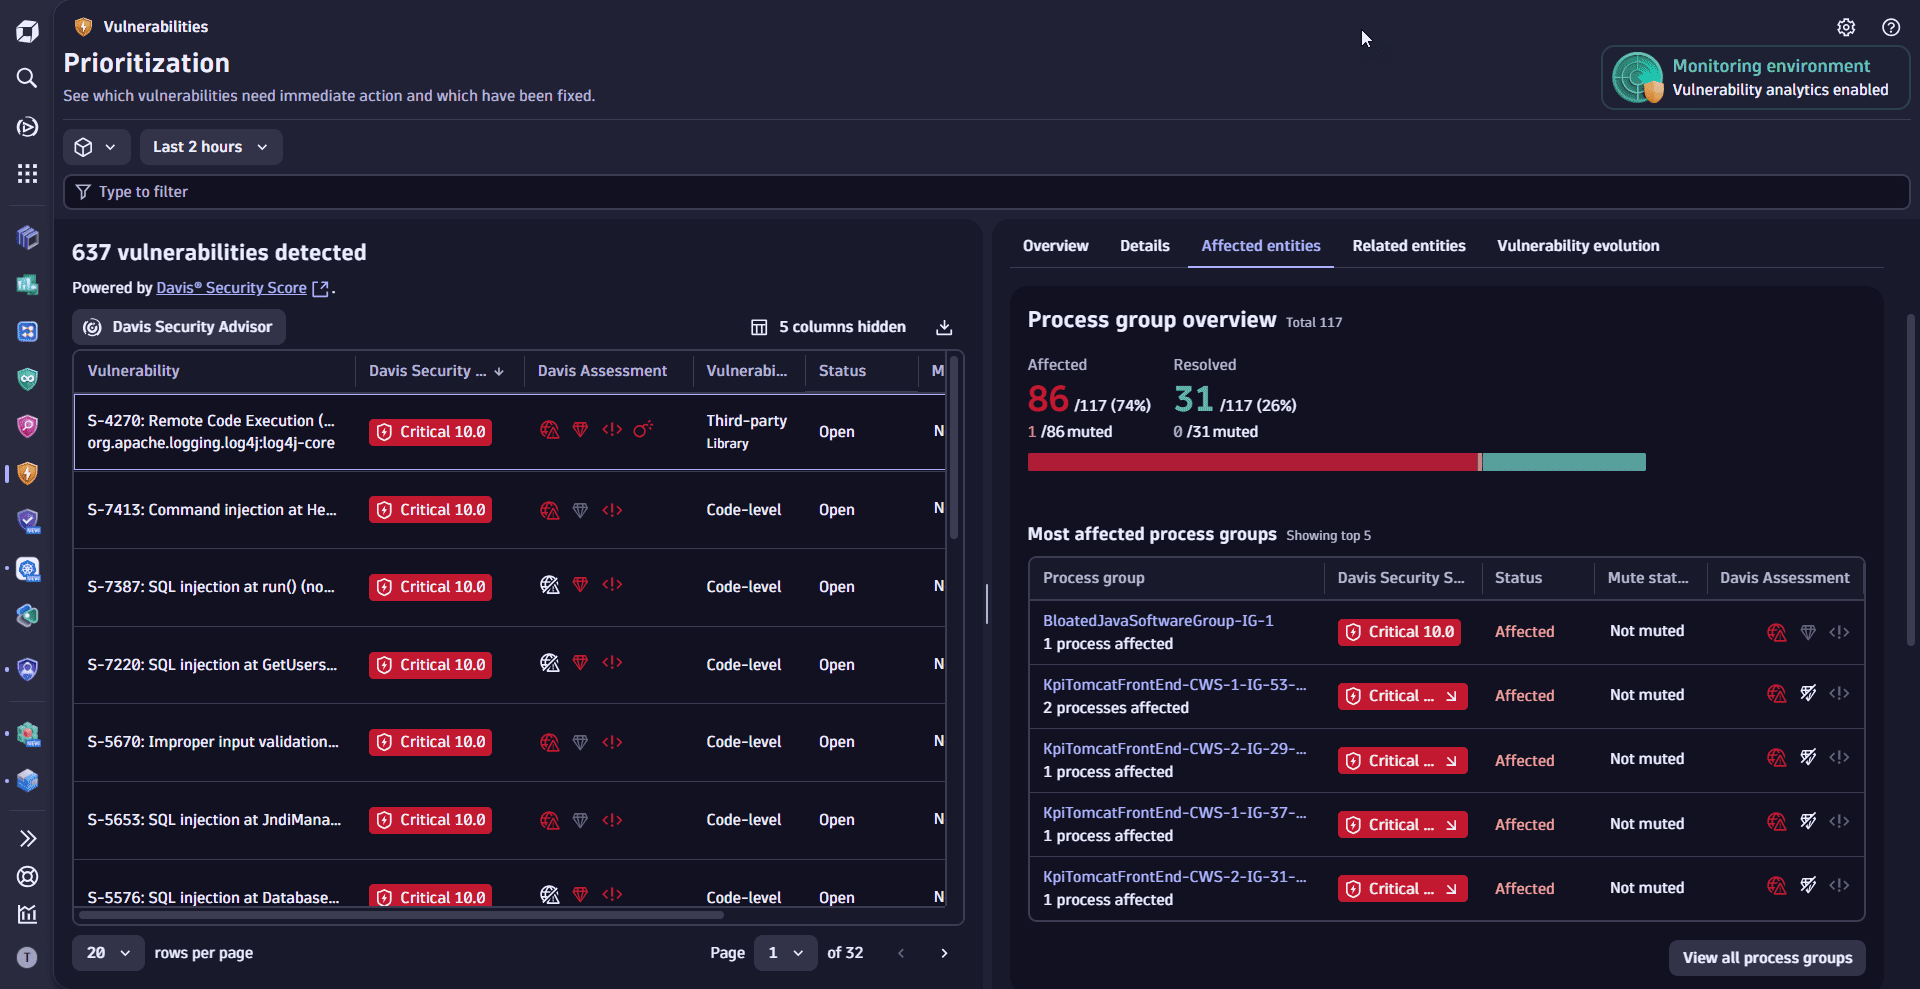
Understand how a vulnerability affects process groups or Kubernetes nodes—see how many are affected, resolved, or muted, and what percentage they represent. Track remediation progress, exposure level, and overall impact.
- On the Prioritization page, select a vulnerability.
- In the side panel, go to Affected entities and look for Process group overview or Kubernetes node overview.
Review other related entities
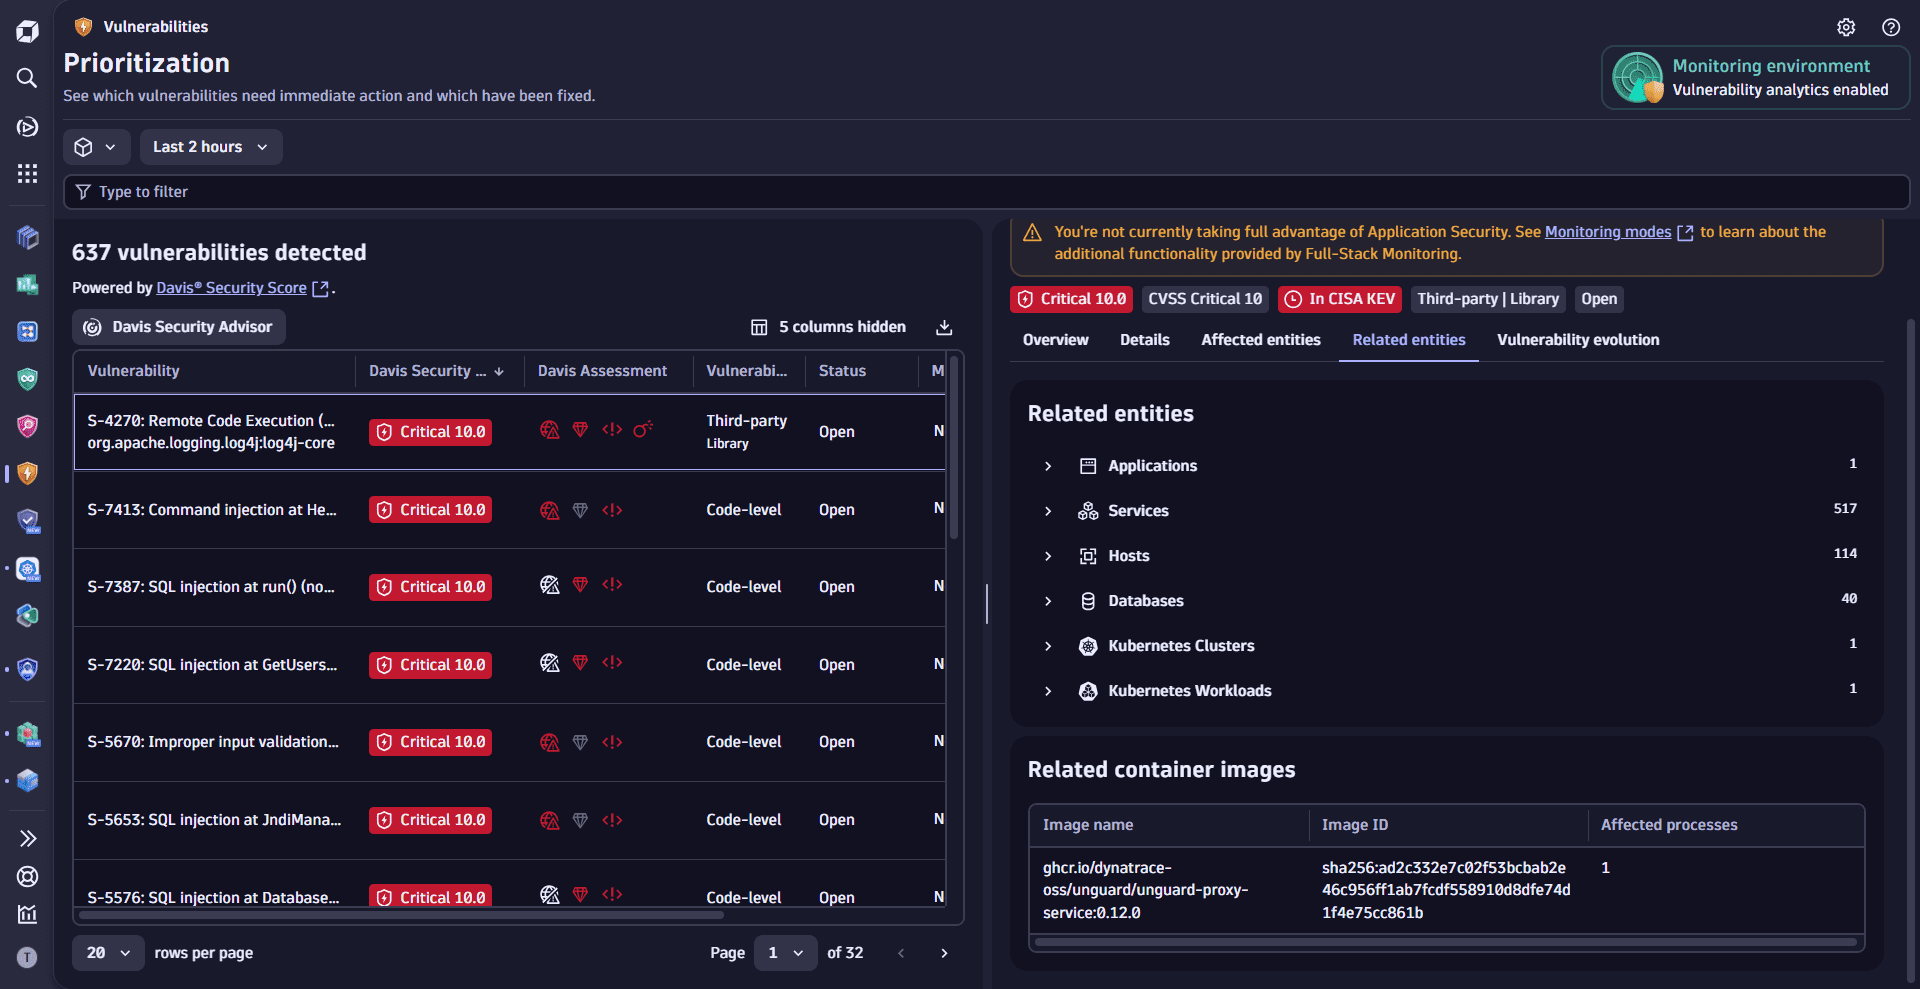
Explore entities connected to affected process groups or Kubernetes nodes to uncover indirect exposure, trace root causes, and assess the broader impact of vulnerabilities. Open these entities in compatible apps to investigate further and take targeted action.
- On the Prioritization page, select a vulnerability.
- In the side panel, go to Related entities.
Further reading
To learn more about affected and related entities, see Concepts: Affected and related entities.
Prioritize by exploit attempts
Code-level vulnerabilities
Prioritize vulnerabilities based on observed exploit activity to better understand exposure and response patterns. View how frequently a vulnerability has been targeted, what actions were taken in response, and key details from recent attempts to help guide your remediation efforts. Adjust timeframe and segments and open exploits in the  Threats & Exploits app for further insights.
- On the Prioritization page, select a vulnerability.
- In the side panel, go to Exploit attempts.
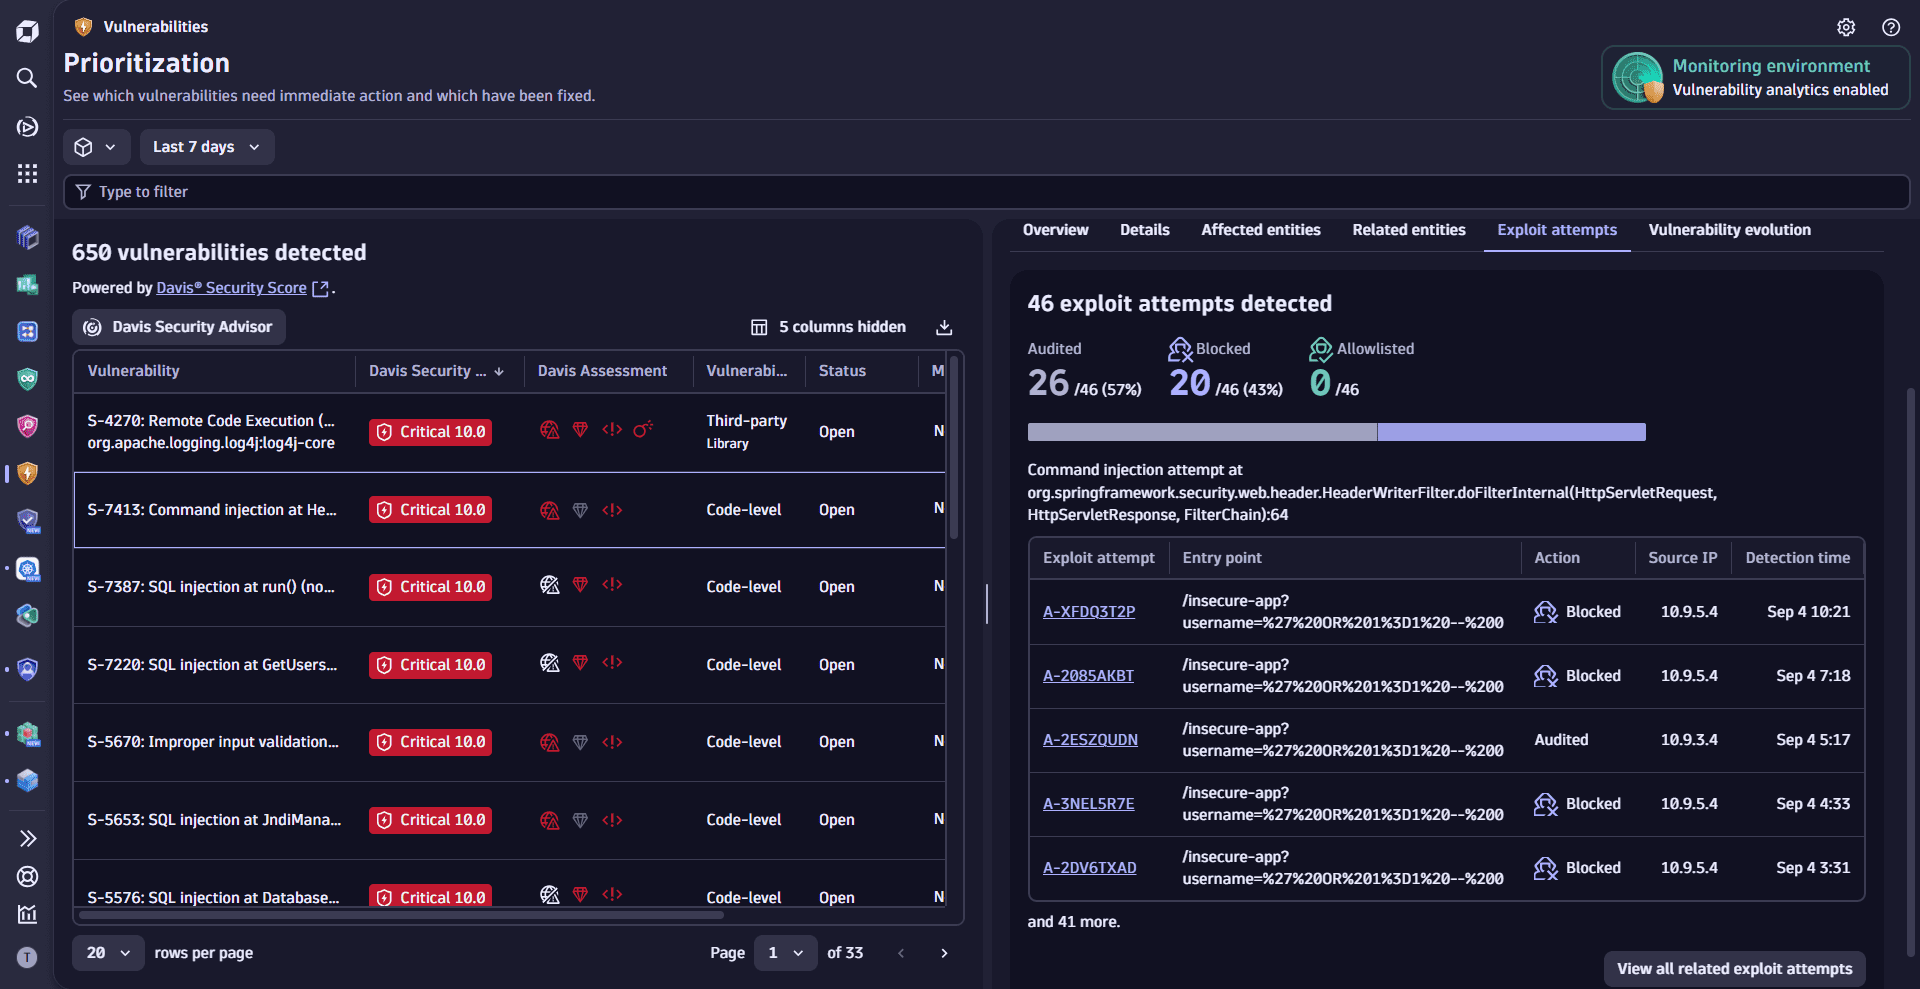
To detect exploit attempts you need to set up Runtime Application Protection.
Prioritize by vulnerability evolution
Track vulnerability evolution to understand severity changes over time and prioritize response accordingly.
Historical context helps clarify whether a vulnerability has always been critical or recently escalated. For example, if a Medium severity issue becomes Critical, you'll know it wasn't neglected—it simply evolved and now demands attention. Without this timeline, a newly critical vulnerability might appear to have been overlooked for longer than it actually has.
- On the Prioritization page, select a vulnerability.
- In the side panel, go to Vulnerability evolution.
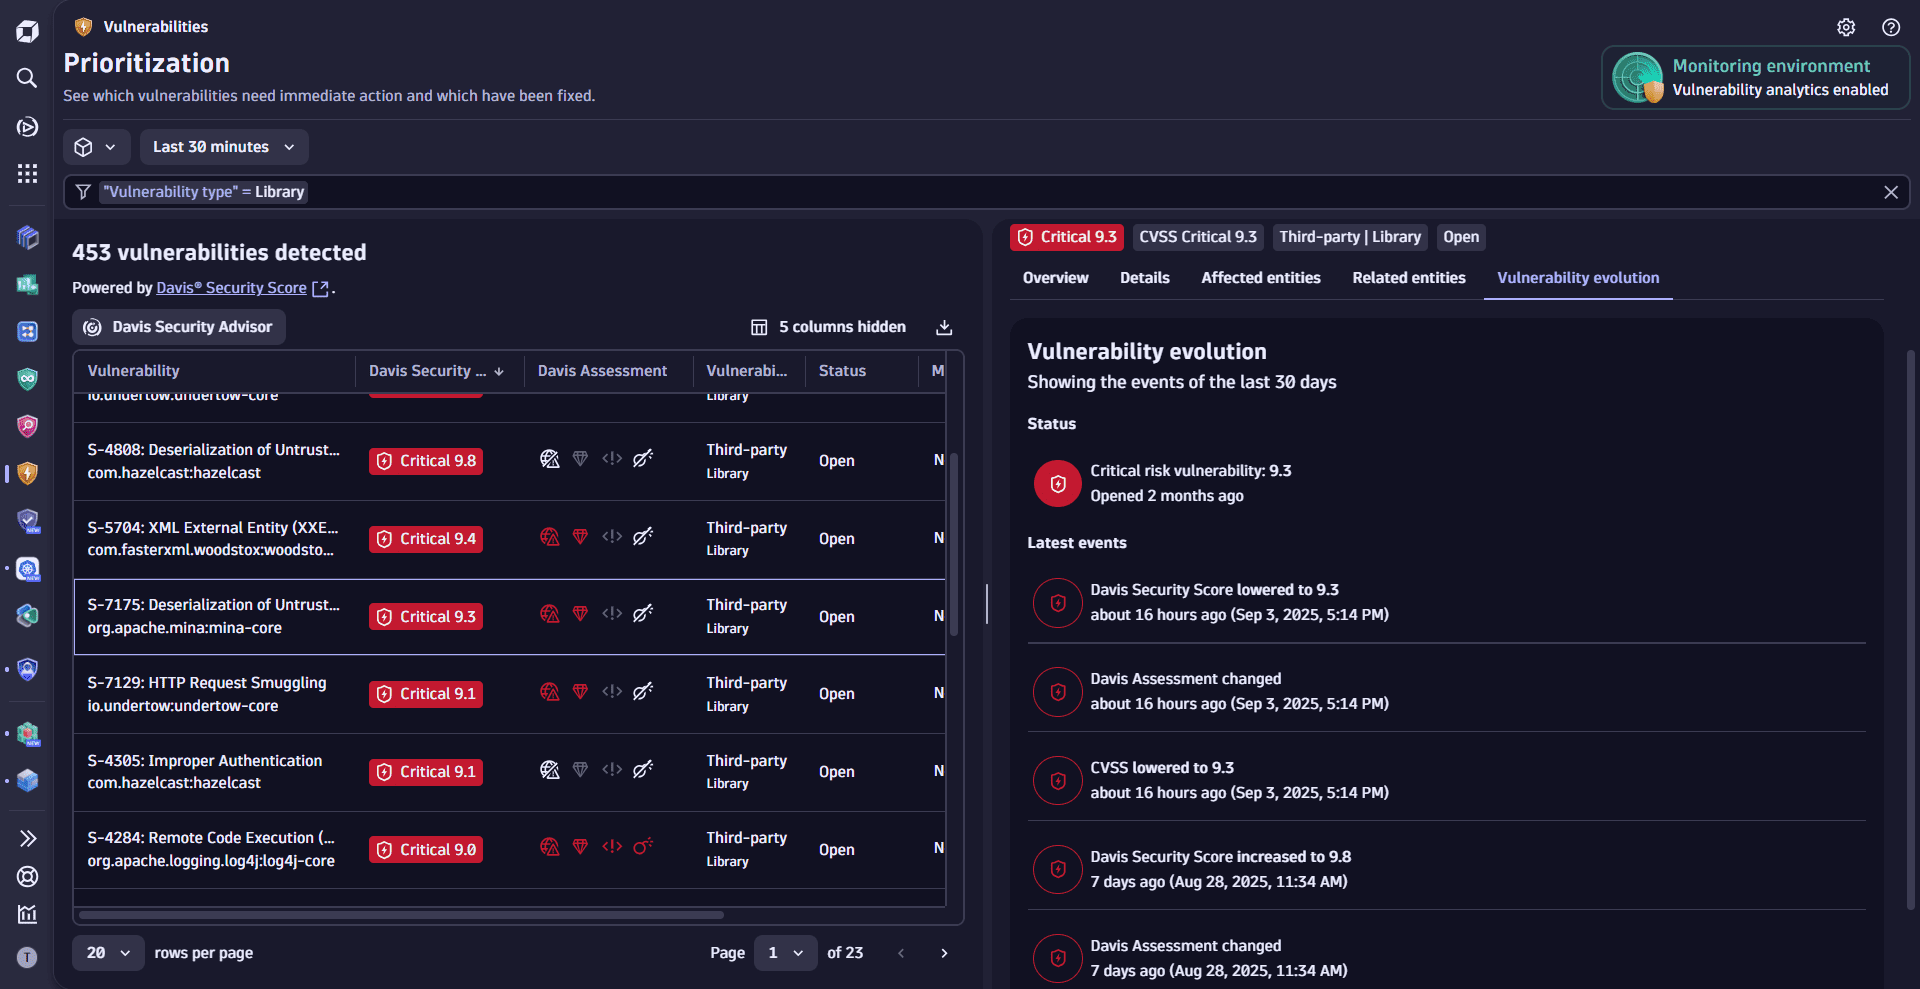
Events are stored for one year and can only be queried up to the timestamp of when the vulnerability was first detected.
Prioritize by CISA KEV catalog
Third-party vulnerabilities
Leverage the CISA KEV catalog to prioritize vulnerabilities based on known exploit activity and remediation deadlines—so you can focus on threats with real-world impact and regulatory urgency. See below for your options.
Filter by CISA KEV
On the Prioritization page, use the filter field to
- Show whether a vulnerability appears in the CISA KEV catalog (
CISA KEV>CISA KEV - In catalog>Yes/No) - View when a CISA KEV-listed vulnerability is due (
CISA KEV>CISA KEV - Due date, then enter the target date, inYYYY-MM-DDformat)
Sort by CISA KEV
- On the Prioritization page, go to the column settings
and select
CISA KEVto add the CISA KEV column to the results table. - Select the CISA KEV column header, then select Sort ascending or Sort descending.
Understand remediation deadlines
Vulnerabilities with missed remediation deadlines are labeled Overdue.
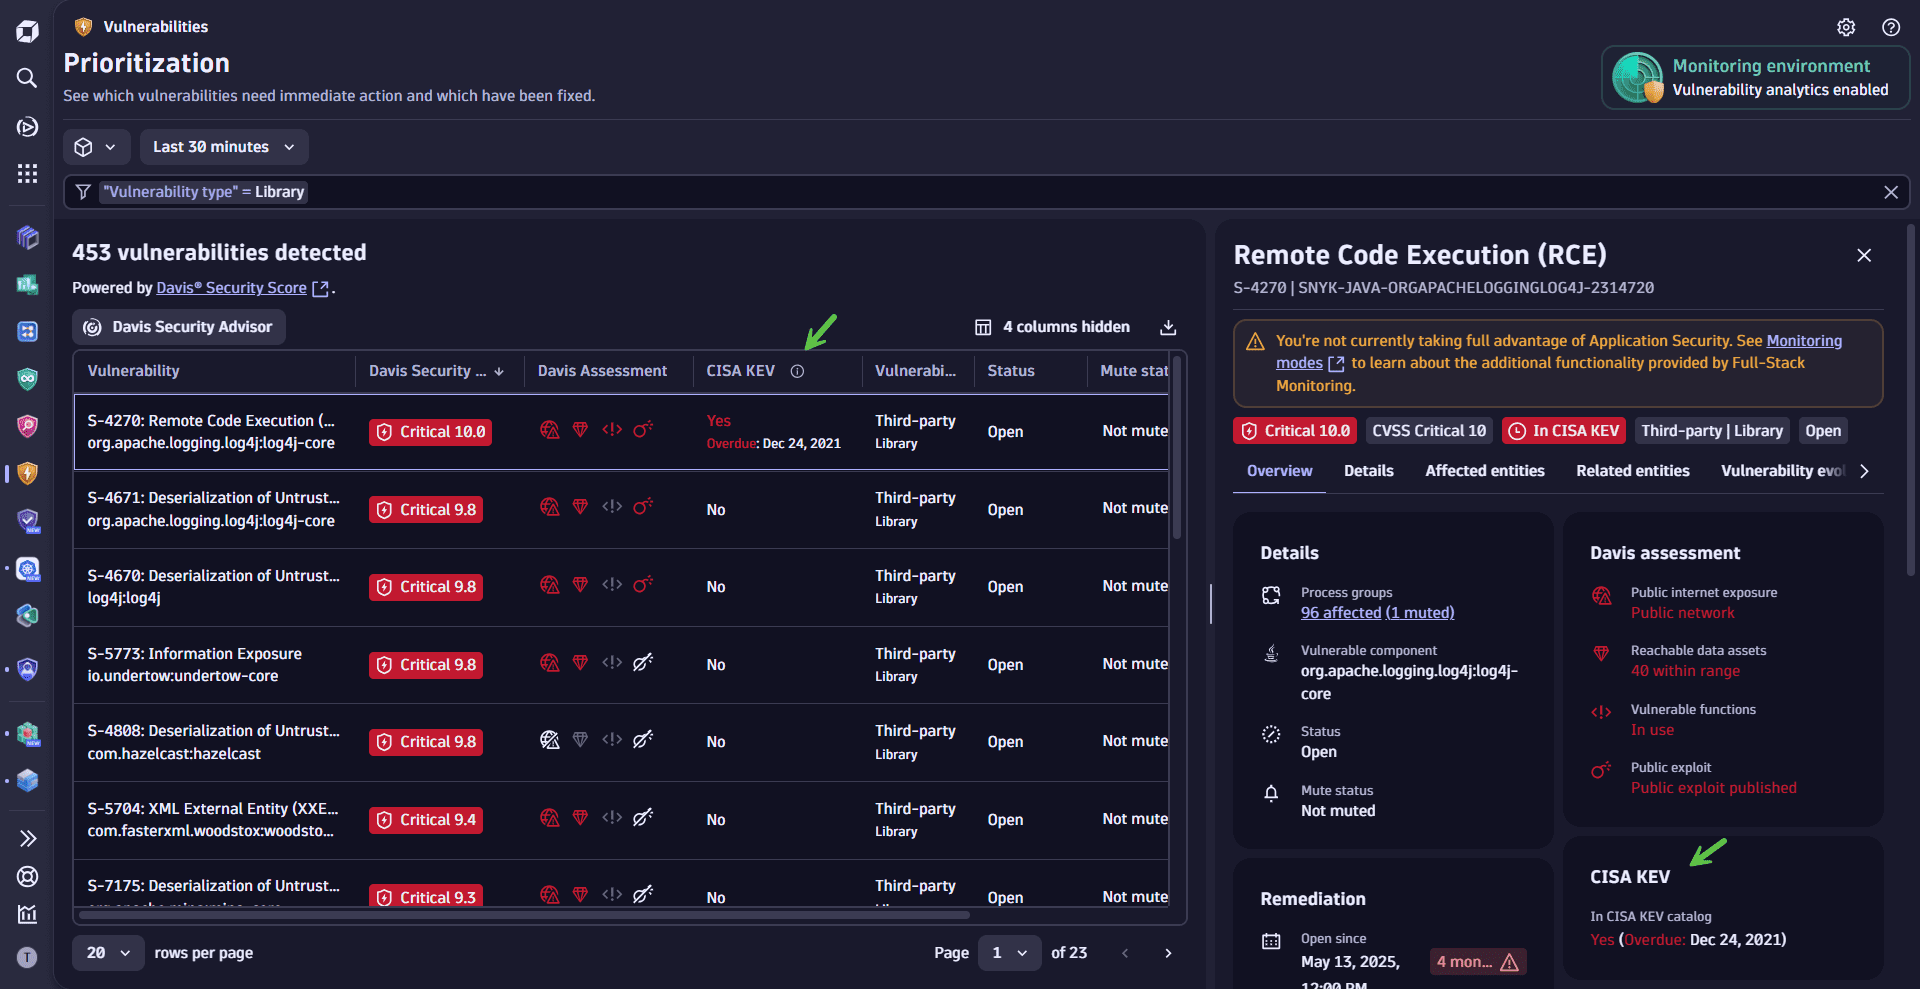
For GCP deployments, data may lag behind the CISA KEV catalog by approximately two to four weeks.