Instant Intrusion Response
Latest Dynatrace Early Adopter
Time is crucial when dealing with security incidents. This page shows how you can use Dynatrace to speed up your incident response in two phases:
- When an attack is detected, Dynatrace can automate the notification and analysis for you, so that the right teams are informed and receive actionable information to start working on the issue.
- When investigating an issue, each new discovery guides the next steps in the incident response. Through Grail’s schemaless queries, Dynatrace allows you to remain flexible in this time-critical process.
Target audience
This page is intended for Security teams analyzing security incidents, such as the Incident Response team.
Scenario
In the following, we address a scenario in which identifying an attack, researching the scope, determining the responsible entity owners, and remediating the attack takes hours, sometimes even days.
- Tools like AWS GuardDuty trigger events on suspicious activity independently.
- Handling the incoming load while increasing security strength is impossible.
- All correlation and collaboration are manual, resulting in frustration about the silos.
- Several internal integration tools, hard to manage, have been built; they are helpful, but aren't providing solid and safe automation.
- A typical suspicious incident takes days to escalate and qualify.
Request
The team wants to quickly
- Identify when a possible attack is happening.
- Research the scope and determine what is affected: for example, whether the attack affects only a single isolated, non-production system or threatens a critical part of the environment.
- Determine the responsible entity owners.
- Remediate the attack.
Goals
-
Efficiency: The team should be able to respond much faster to attacks.
-
Flexibility: The team should have more flexibility in their response to security incidents.
Result
Combining the Dynatrace automation capabilities with insights into security-related data, our solution helps security teams react and respond faster to attacks. The team automatically scans all ingested logs for patterns that might indicate possible attacks. Because each attack is different, they make use of schemaless queries with instant responses to quickly identify the scope of an attack, thus reducing the required time from days to minutes.
How it works
Context
Logs from your Dynatrace-monitored environment are ingested into Grail via log ingestion. When an attack is detected, a Dynatrace problem is created.
1. Intrusion notification automation
A workflow is automatically triggered by this type of problem. The workflow collects, processes, and enriches the data with context, and converts the resulting information into notifications on your desired channels.
For an example of how you can set up an attack notification automation, see Intrusion notification automation.
2. Instant queries
Based on the information received, you can immediately respond to discoveries and perform further investigations by running a sequence of DQL queries in Notebooks tailored to the attack type.
For details, see Instant queries.
Prerequisites
-
Dynatrace version 1.283+
-
Set up log ingestion (ingests security incidents into Grail).
-
Set up ownership teams (allows the workflow to assign security incidents based on ownership of the affected entity).
-
Set up Jira for Workflows (allows the workflow to convert resulting findings into Jira tickets).
-
Set up Slack Connector (allows the workflow to send resulting findings to Slack channels).
While the current scenario uses Slack and Jira as notification channels, other integrations are also available. For details, see Workflows integrations.
-
Basic knowledge of how to
-
Make sure the following permissions are enabled.
-
Grail:
storage:logs:read. For instructions, see Assign permissions in Grail. -
Workflows: Permissions to access, view, write, and execute workflows. For details, see Authorization.
To access permissions, go to the Settings menu in the upper-right corner of the Workflows app and select Authorization settings.
-
1. Intrusion notification automation
The following example illustrates how you can implement an attack notification automation using Workflows. You can customize the workflow according to your needs.

Set the trigger

Determine ownership

Set up notification variables

Collect data and enrich with context

Extract successful requests

Replay against target

Send notifications
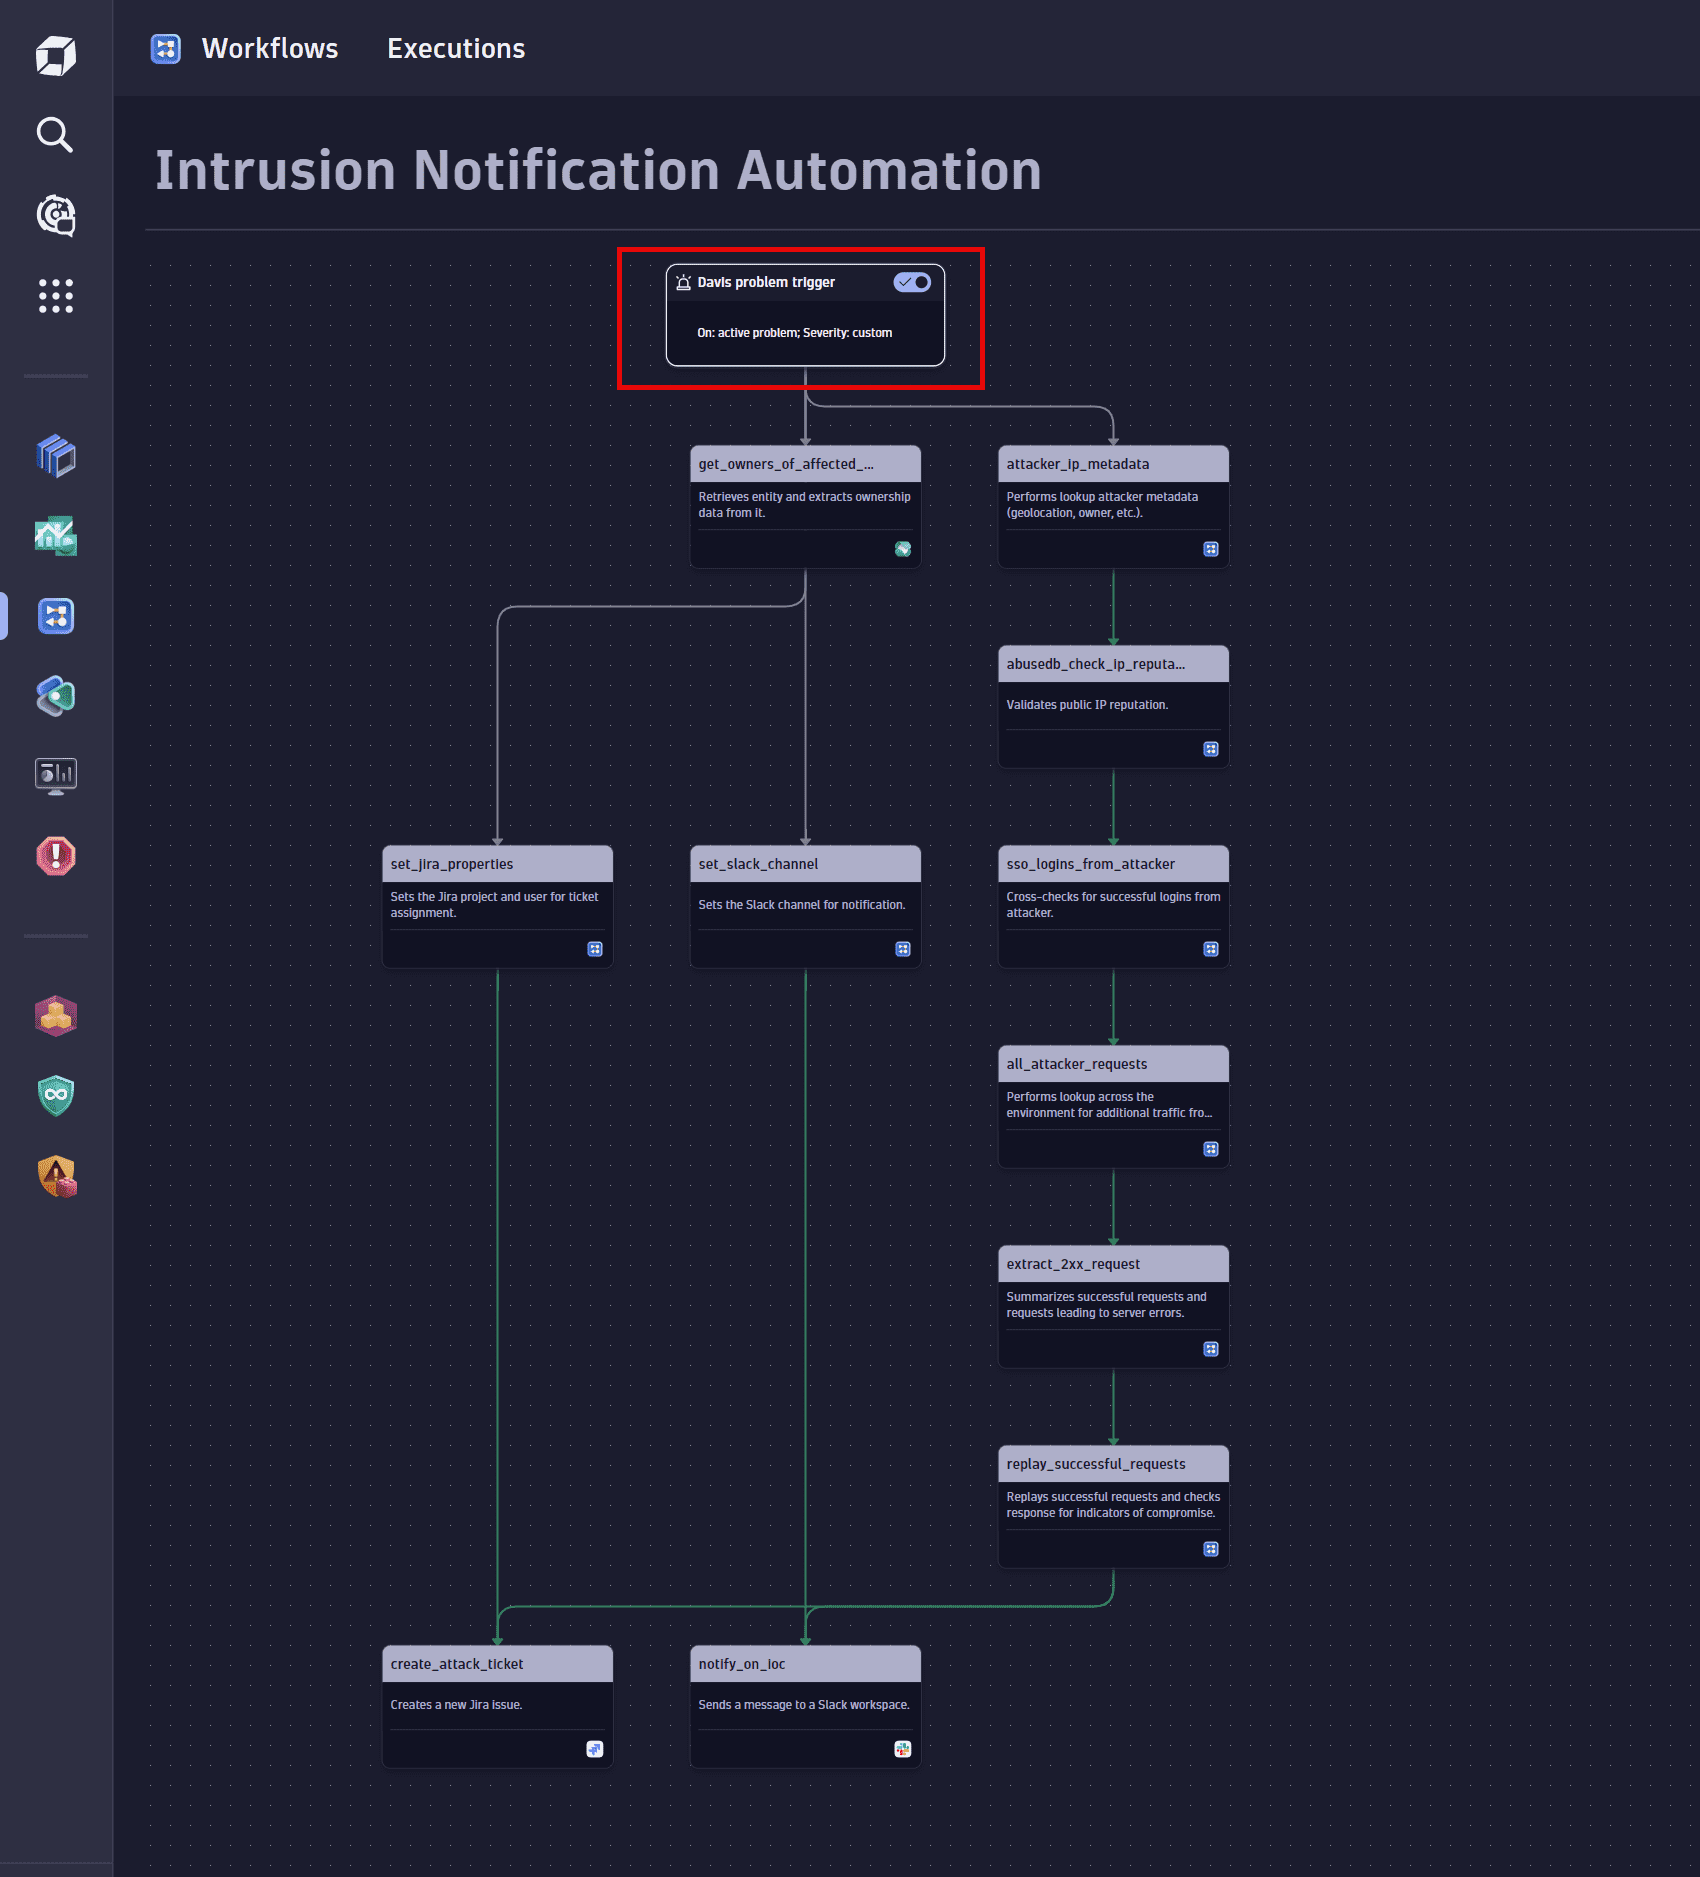
 Set the trigger
The automation needs to be triggered whenever an attack occurs.
In the Select trigger section, select and configure Davis Problem trigger. For details, see Create workflows in Dynatrace Workflows: Trigger.
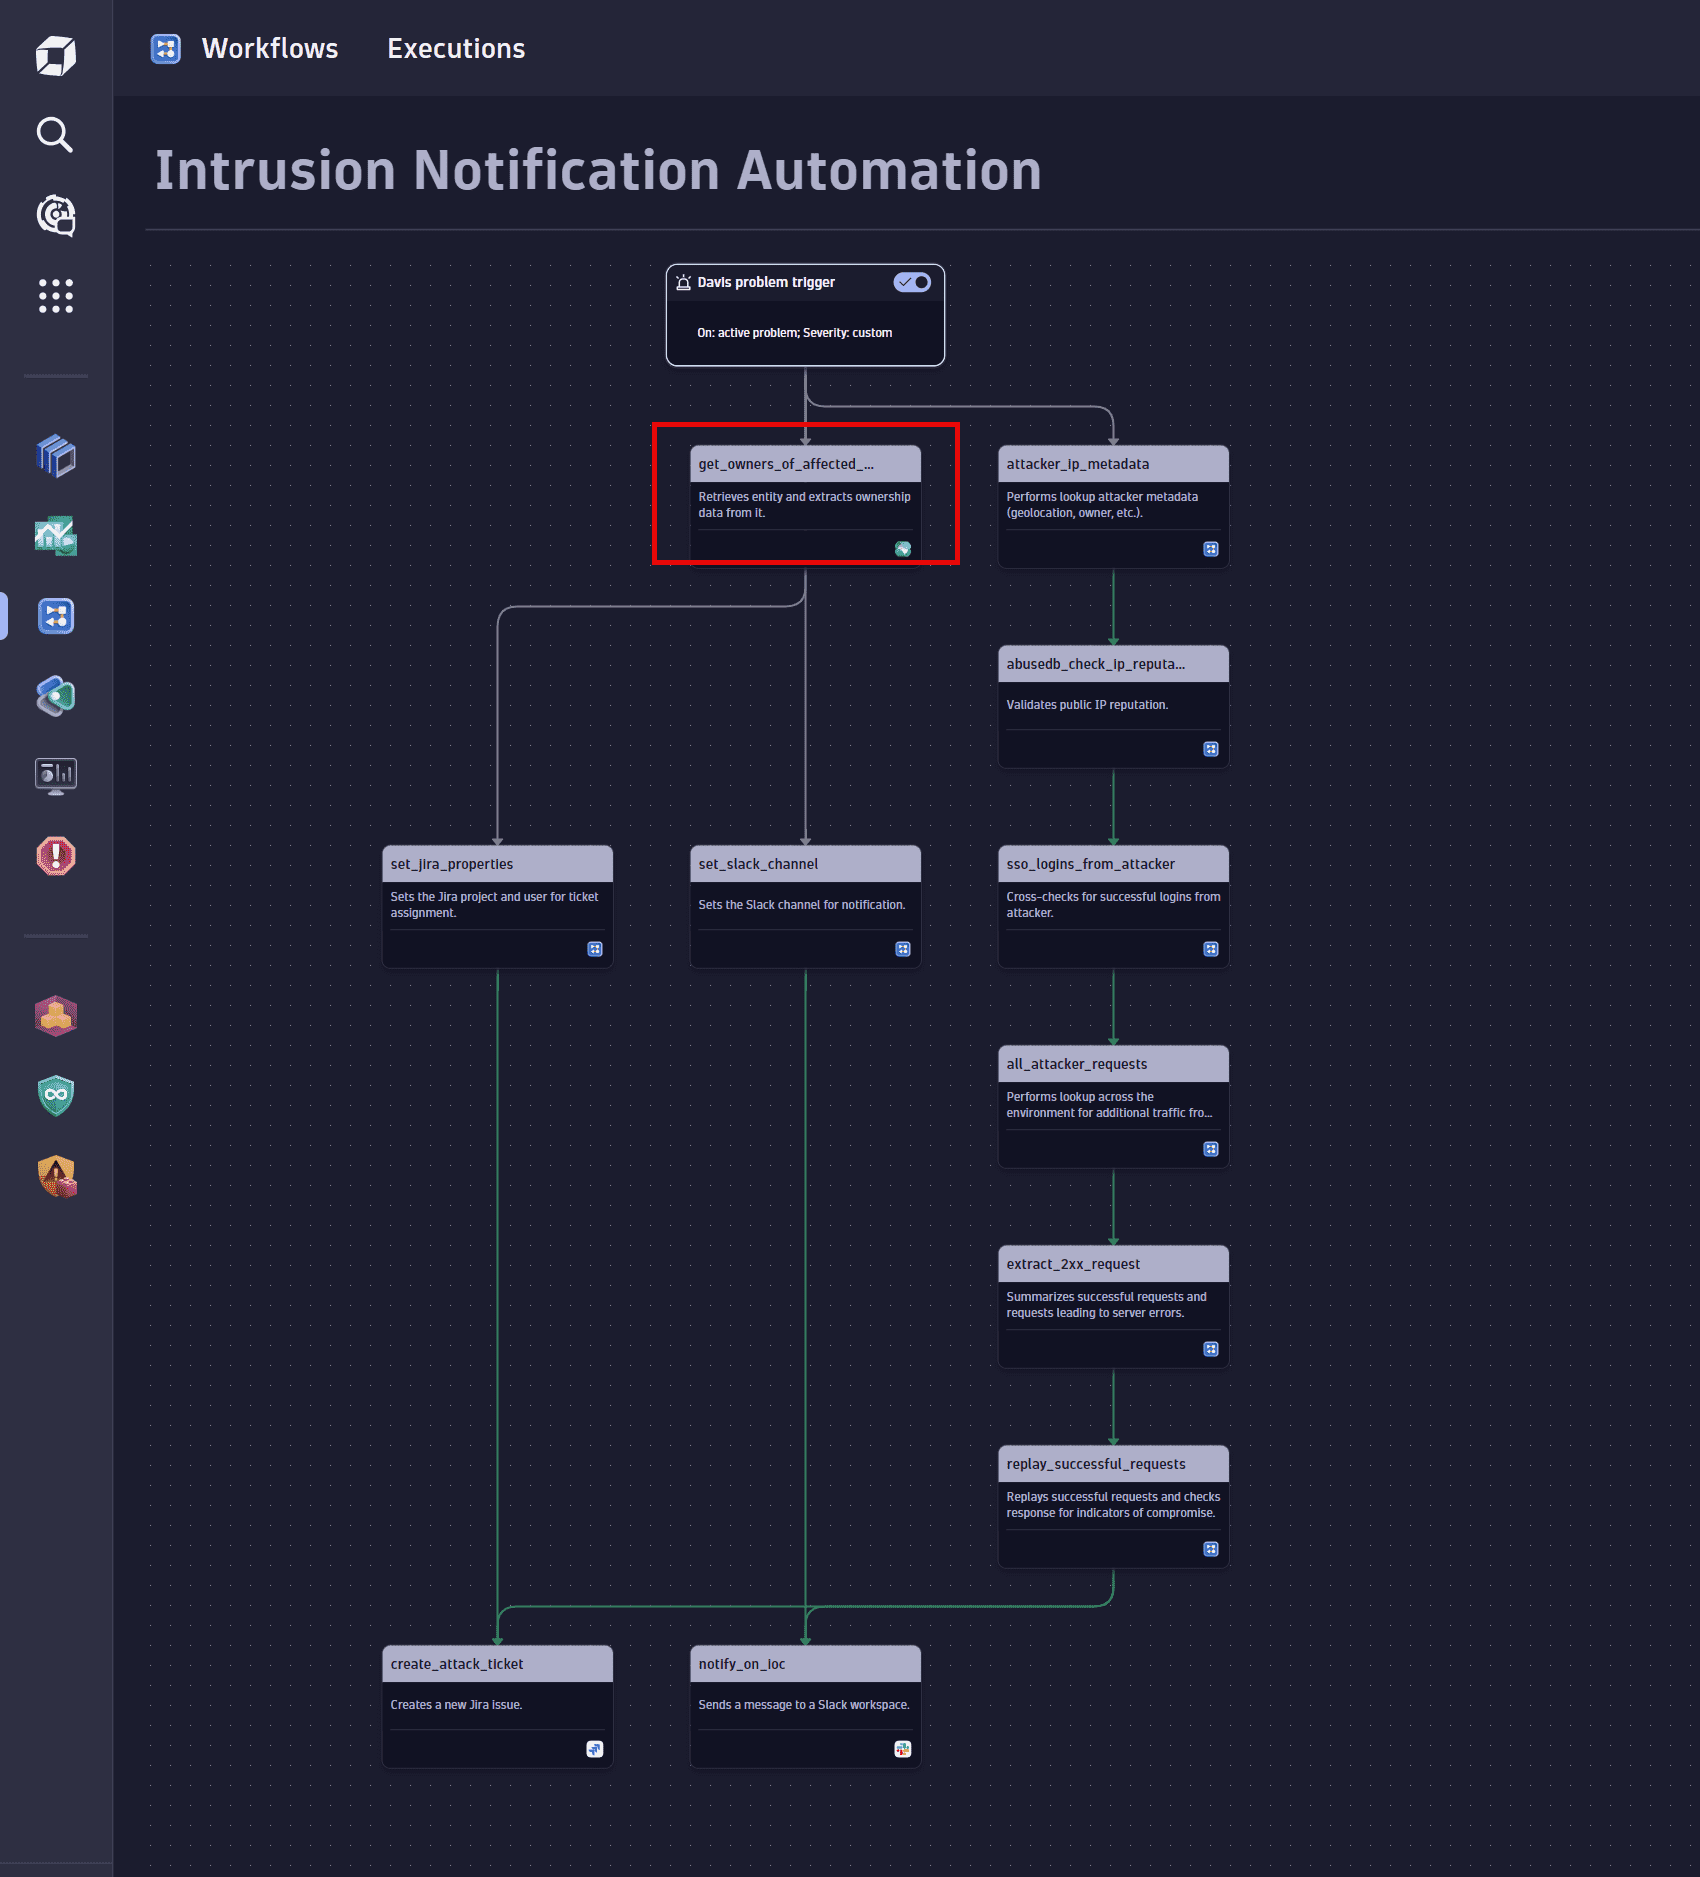
 Determine ownership
Route notifications to the team responsible for the affected entities.
Select the Get owners action to create and configure this task. For details, see Ownership app: get_owners.
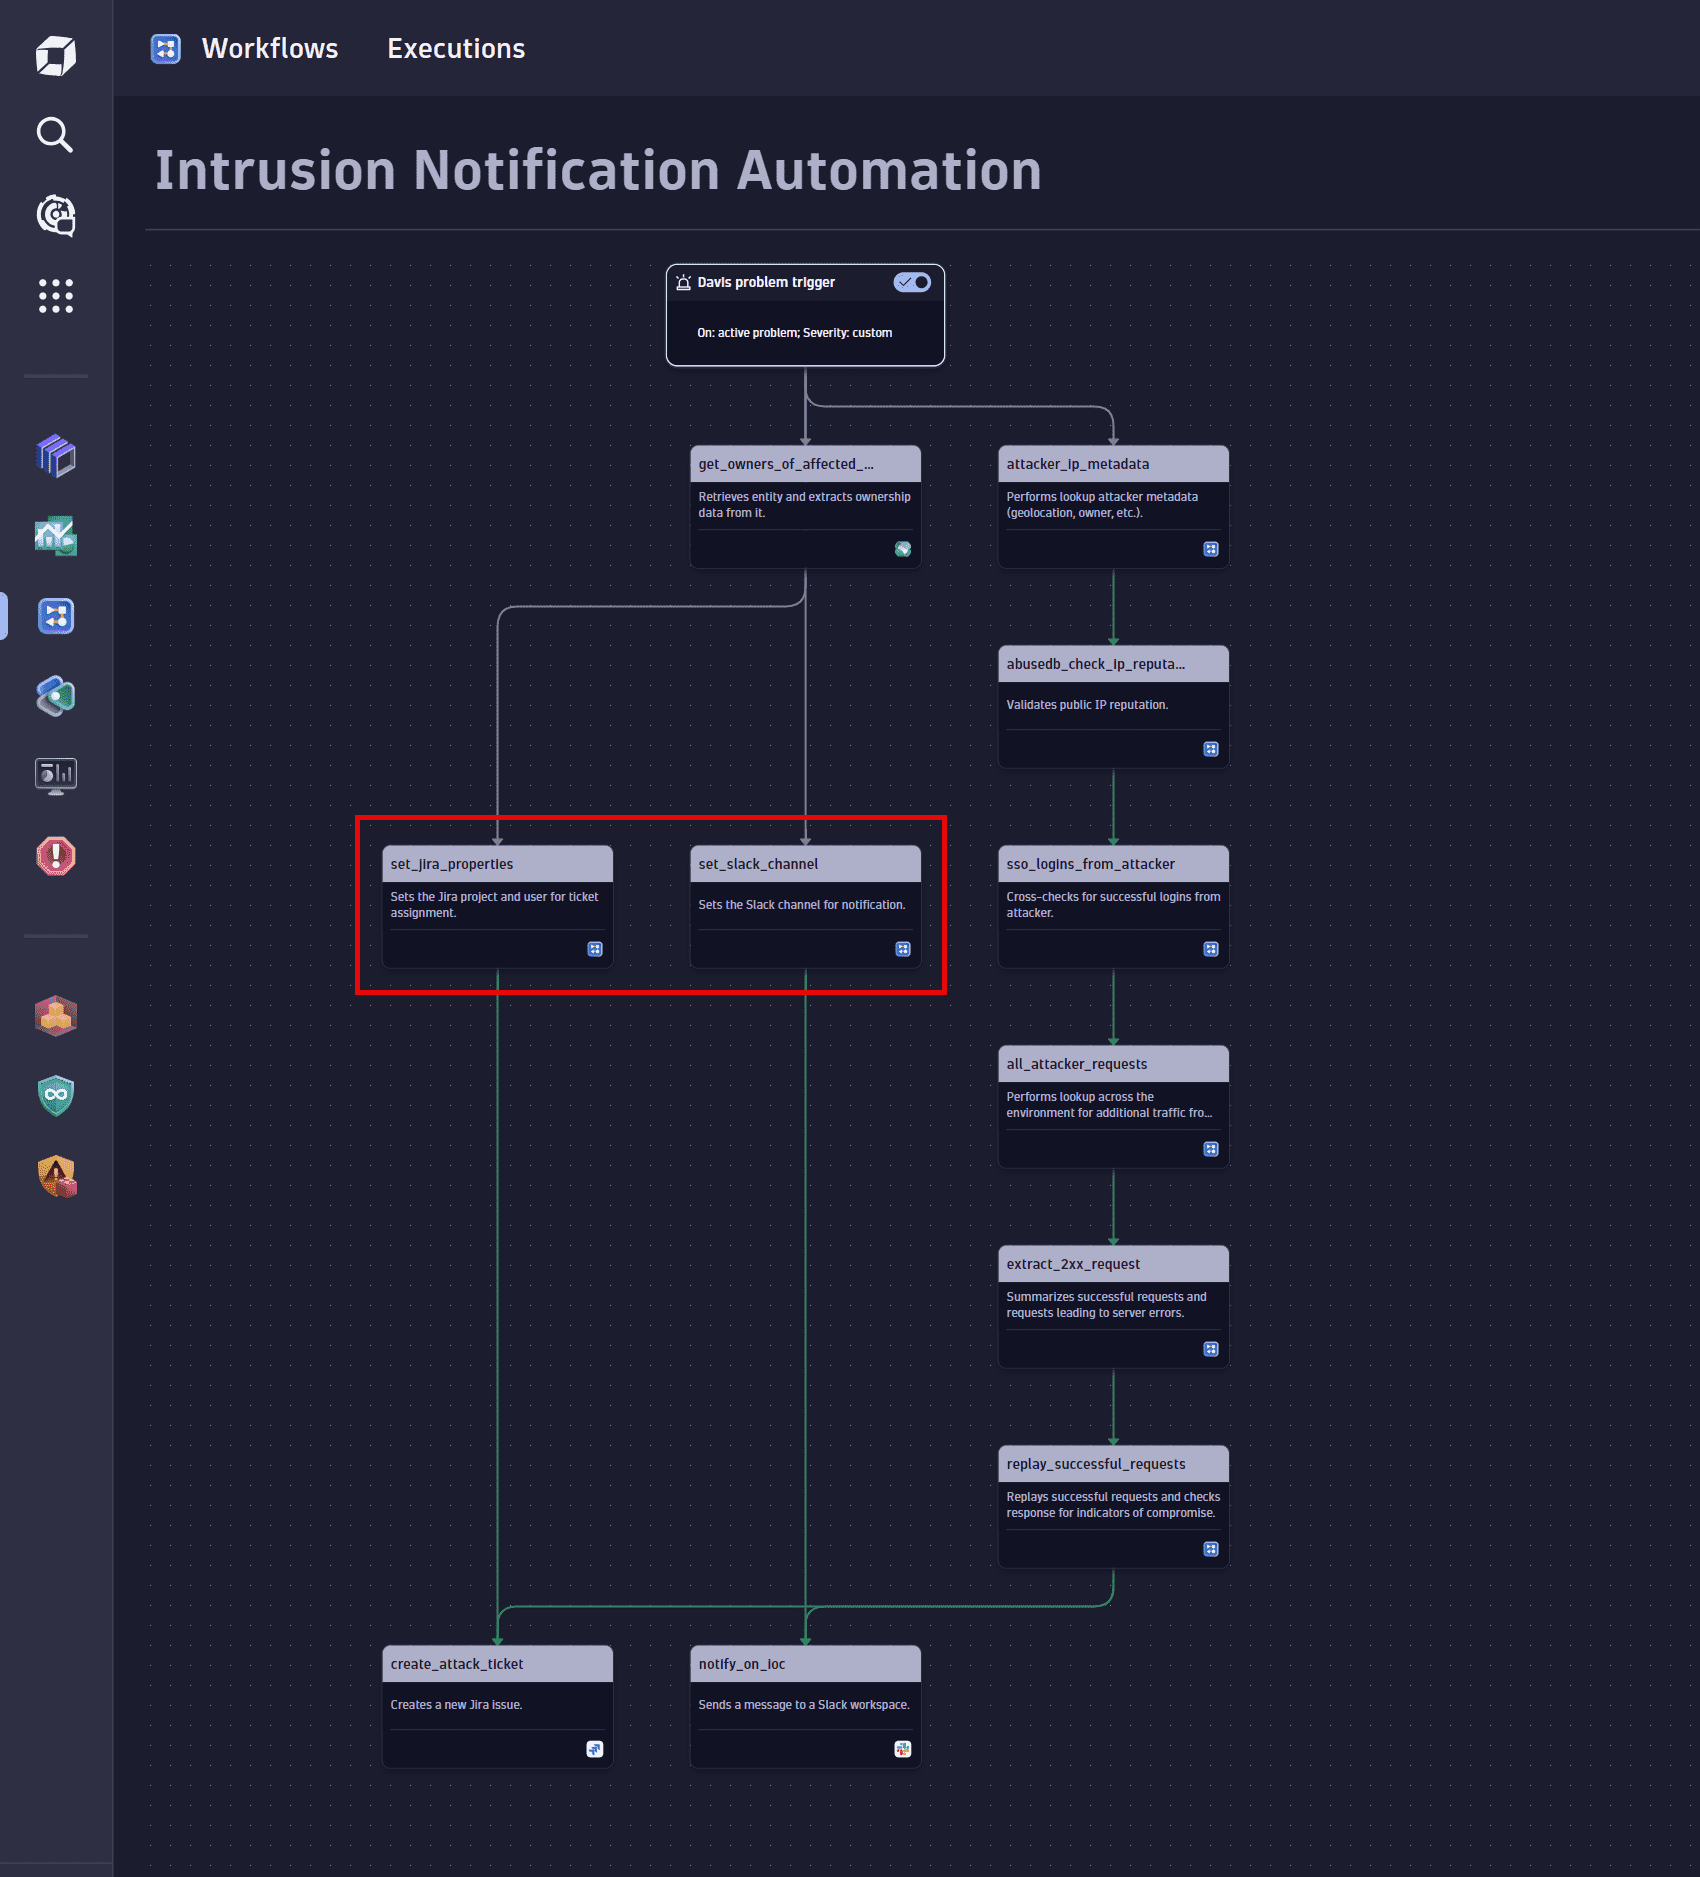
 Set up notification variables
Configure variables such as default values for Slack and Jira fields, that will be used in later steps in the notification process.
Select the Run JavaScript action to create and configure these tasks. For details, see Introduction to workflows: Action.
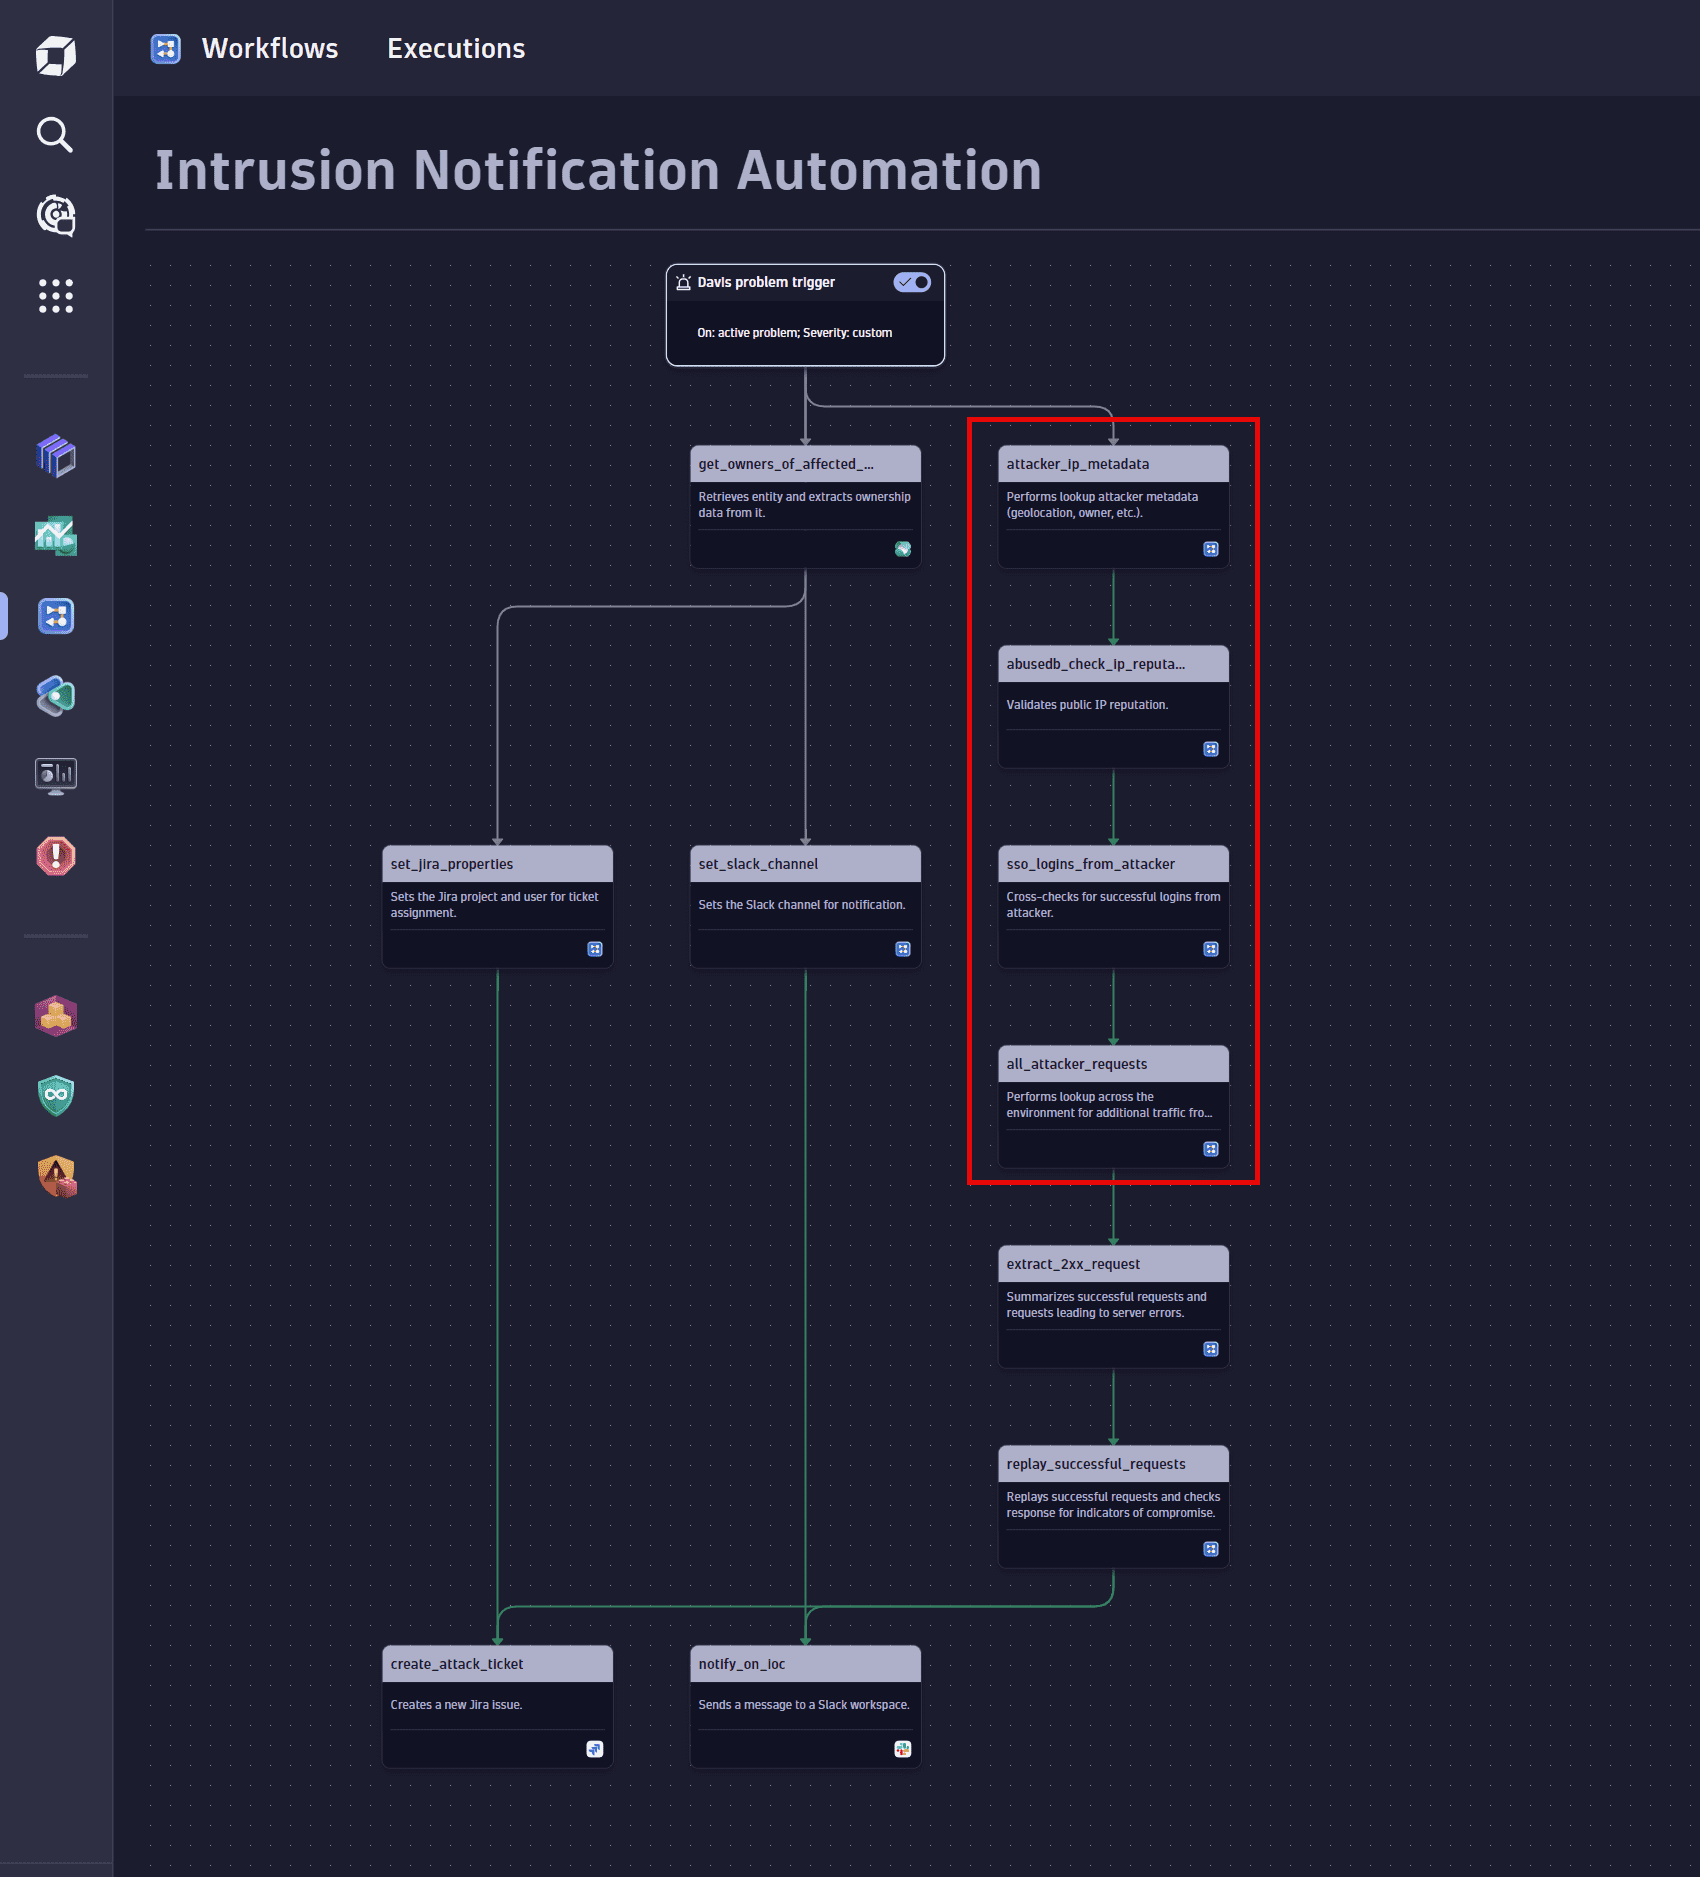
 Collect data and enrich with context
-
Query third-party services. For example:
- Perform a WHOIS lookup to find details about the attacker's IP address.
- Verify the IP reputation using a third-party service such as AbuseIPDB.
Select the HTTP Request action to create and configure these tasks. For details, see Introduction to workflows: Action.
-
Query Dynatrace. For example:
-
Determine whether there were any successful logins from the attacker's IP address.
-
Find out additional traffic information from the attacker's IP address.
Select the Execute DQL Query action to create and configure these tasks. For details, see Introduction to workflows: Action.
-
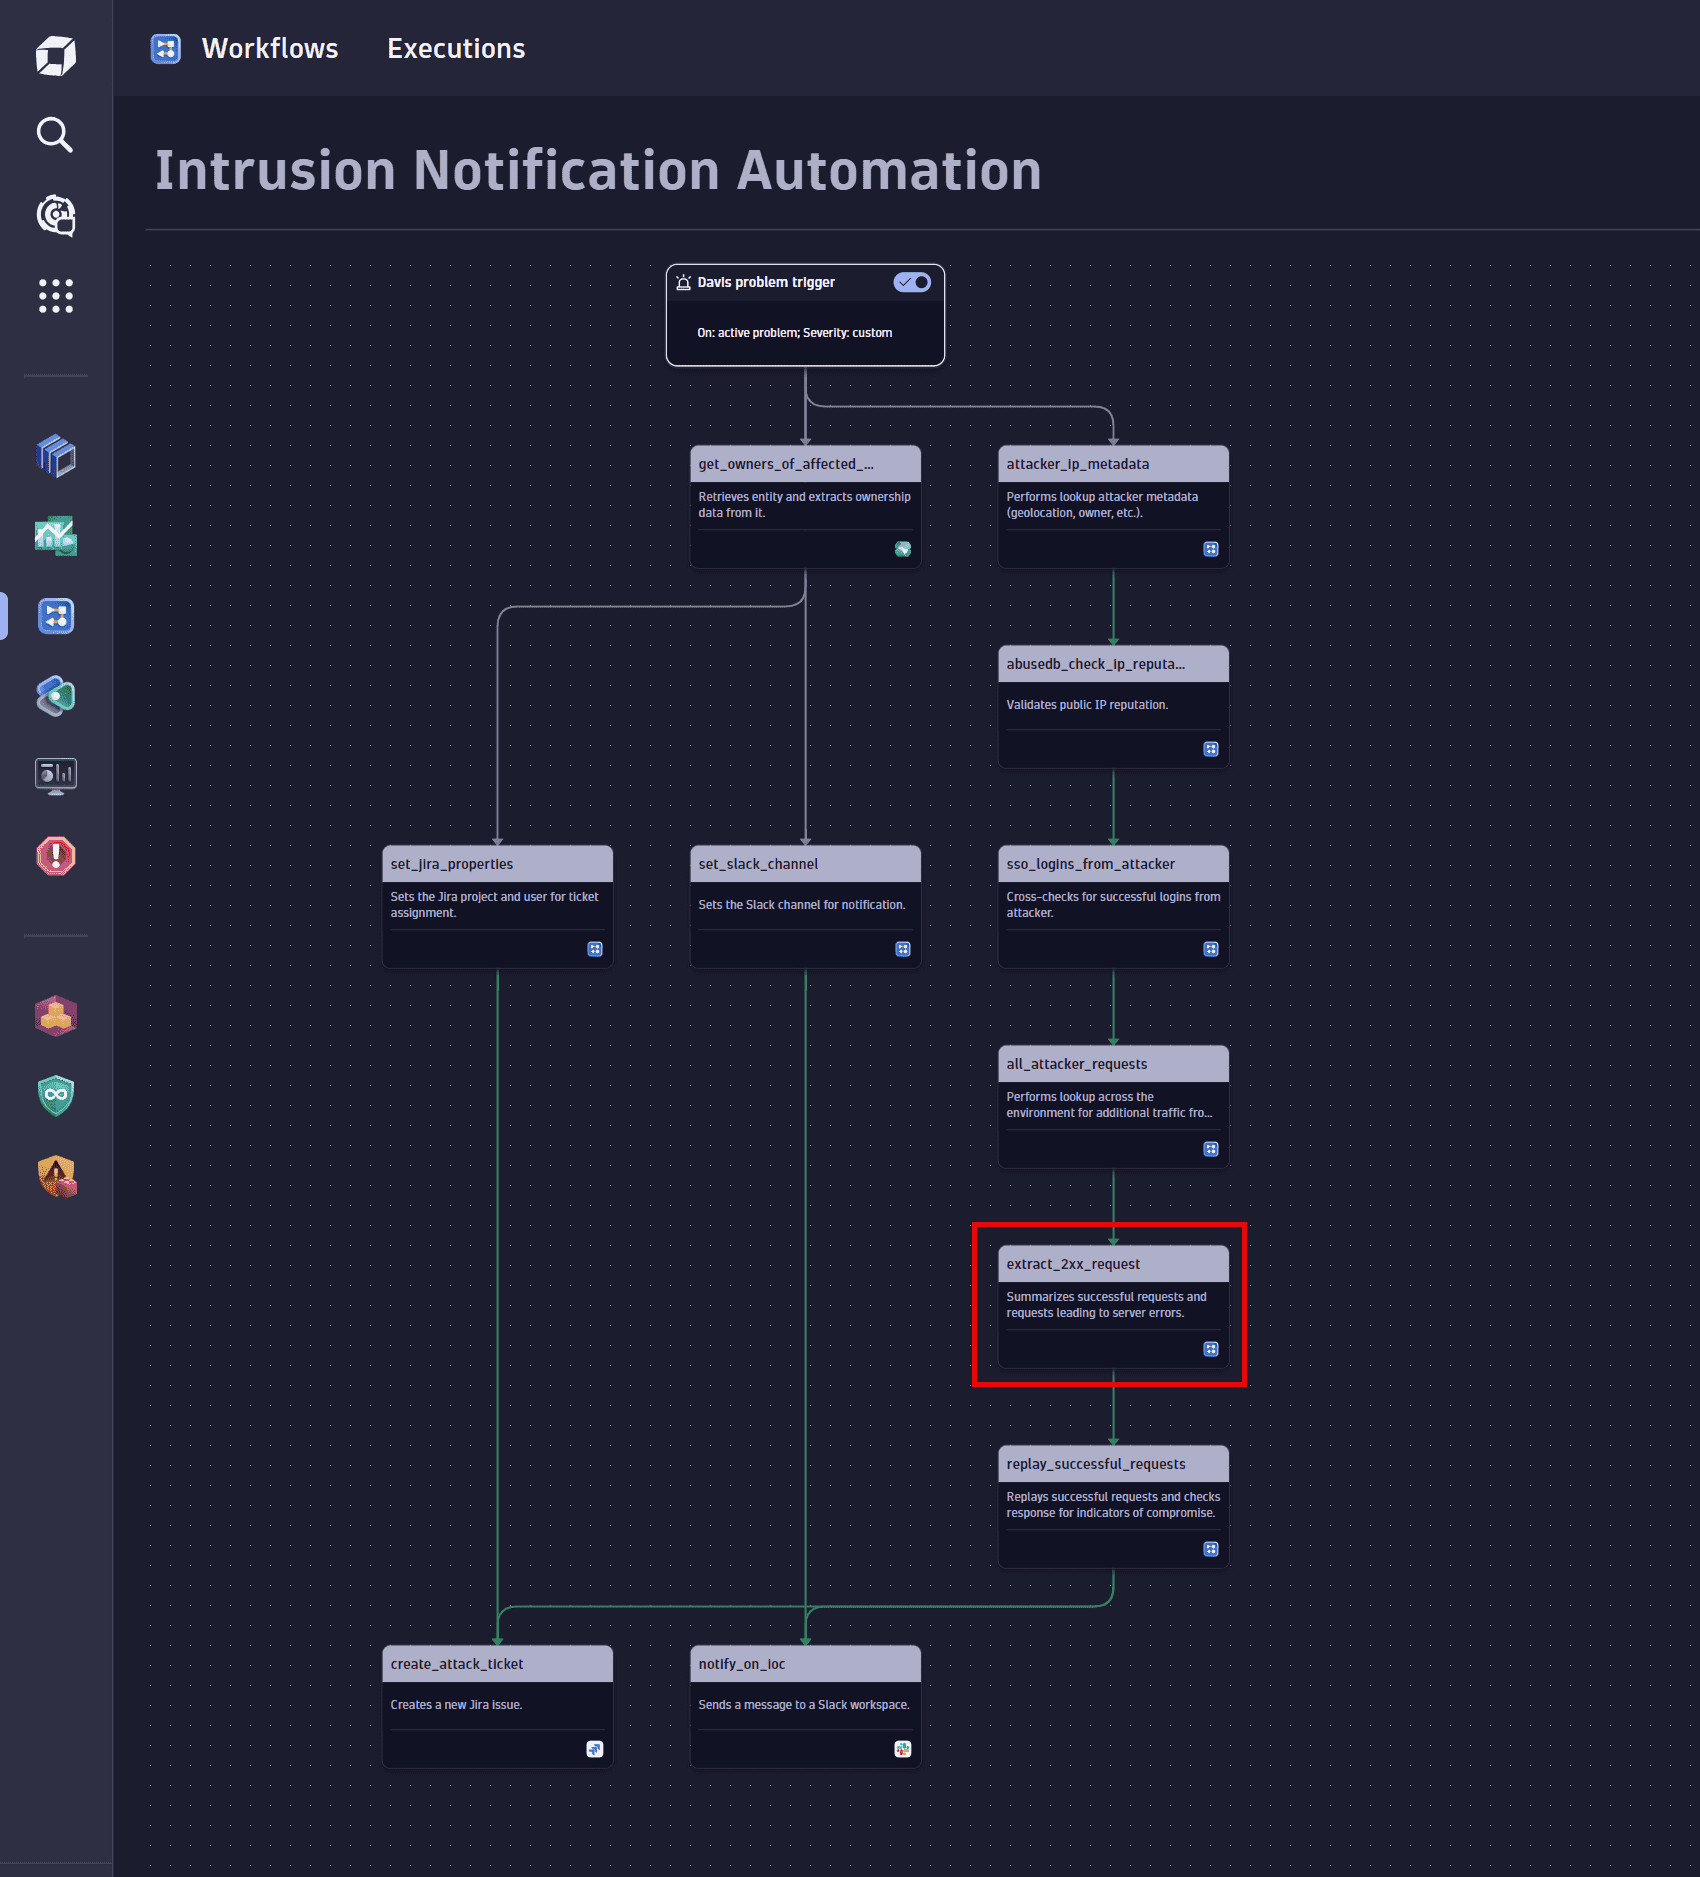
 Extract successful requests
Extract the successful requests from the total requests collected.
Select the Run JavaScript action to create and configure this task. For details, see Introduction to workflows: Action.
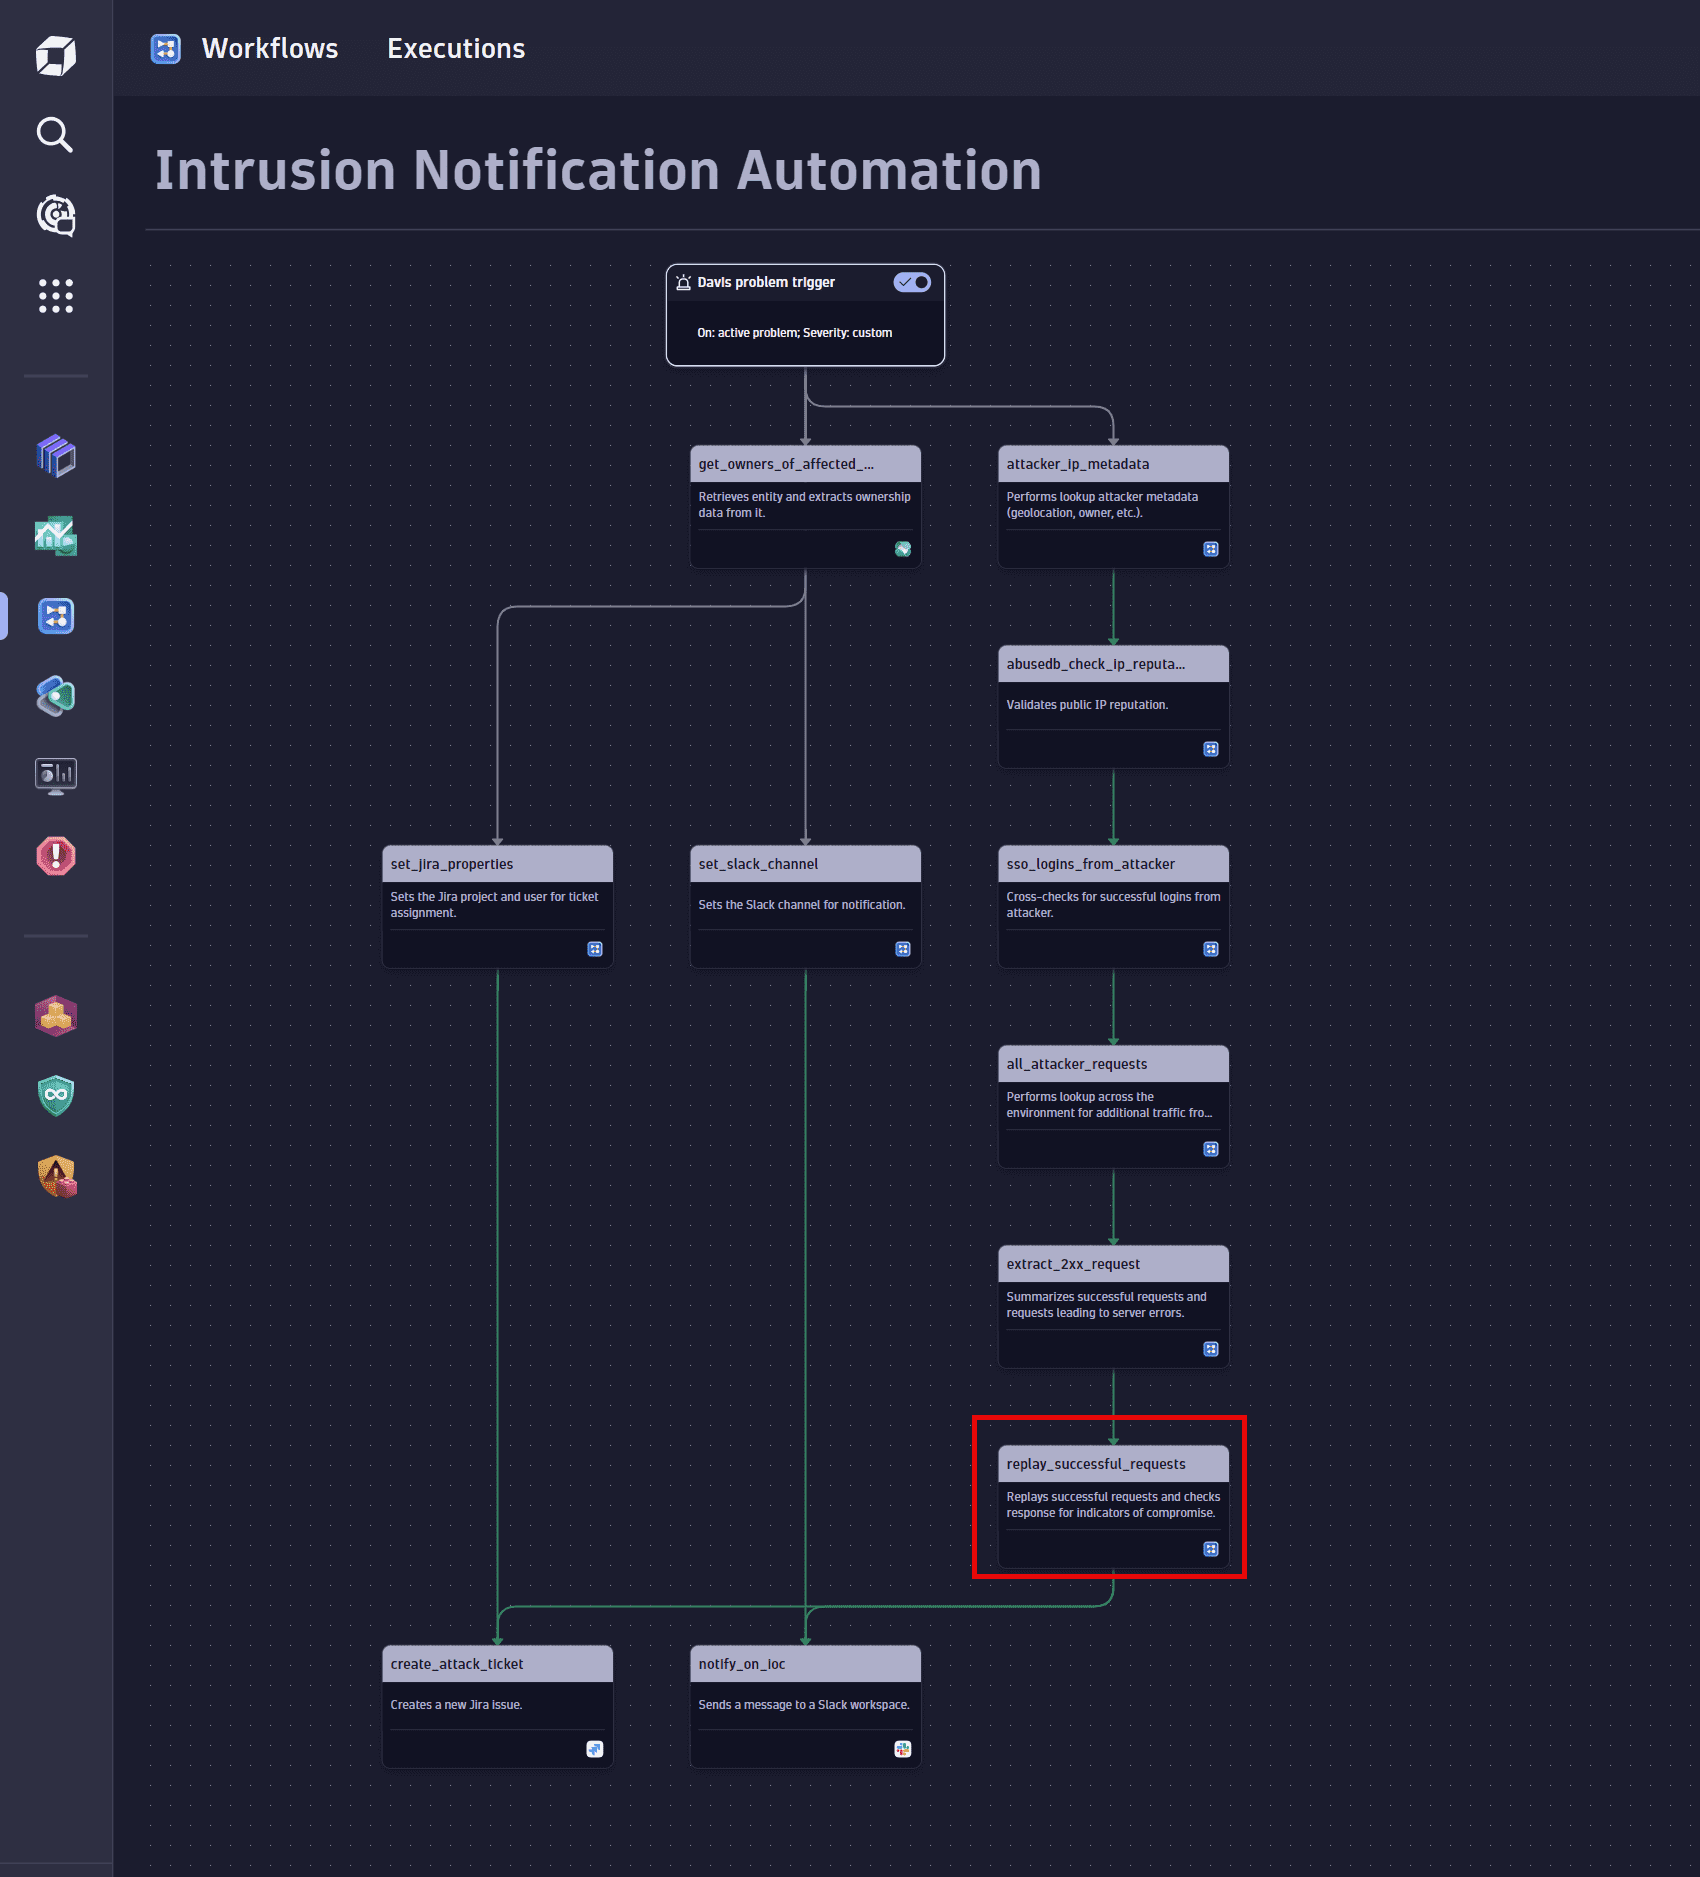
 Replay against target
Replay the successful requests against the target entity to look for indicators of compromise. Custom code steps allow you to automate complex logic that you want to run for each detected attack. Depending on the detected attack and the affected systems, you might want to replay the attacks for more detailed analysis.
Select the Run JavaScript action to create and configure this task. For details, see Introduction to workflows: Action.
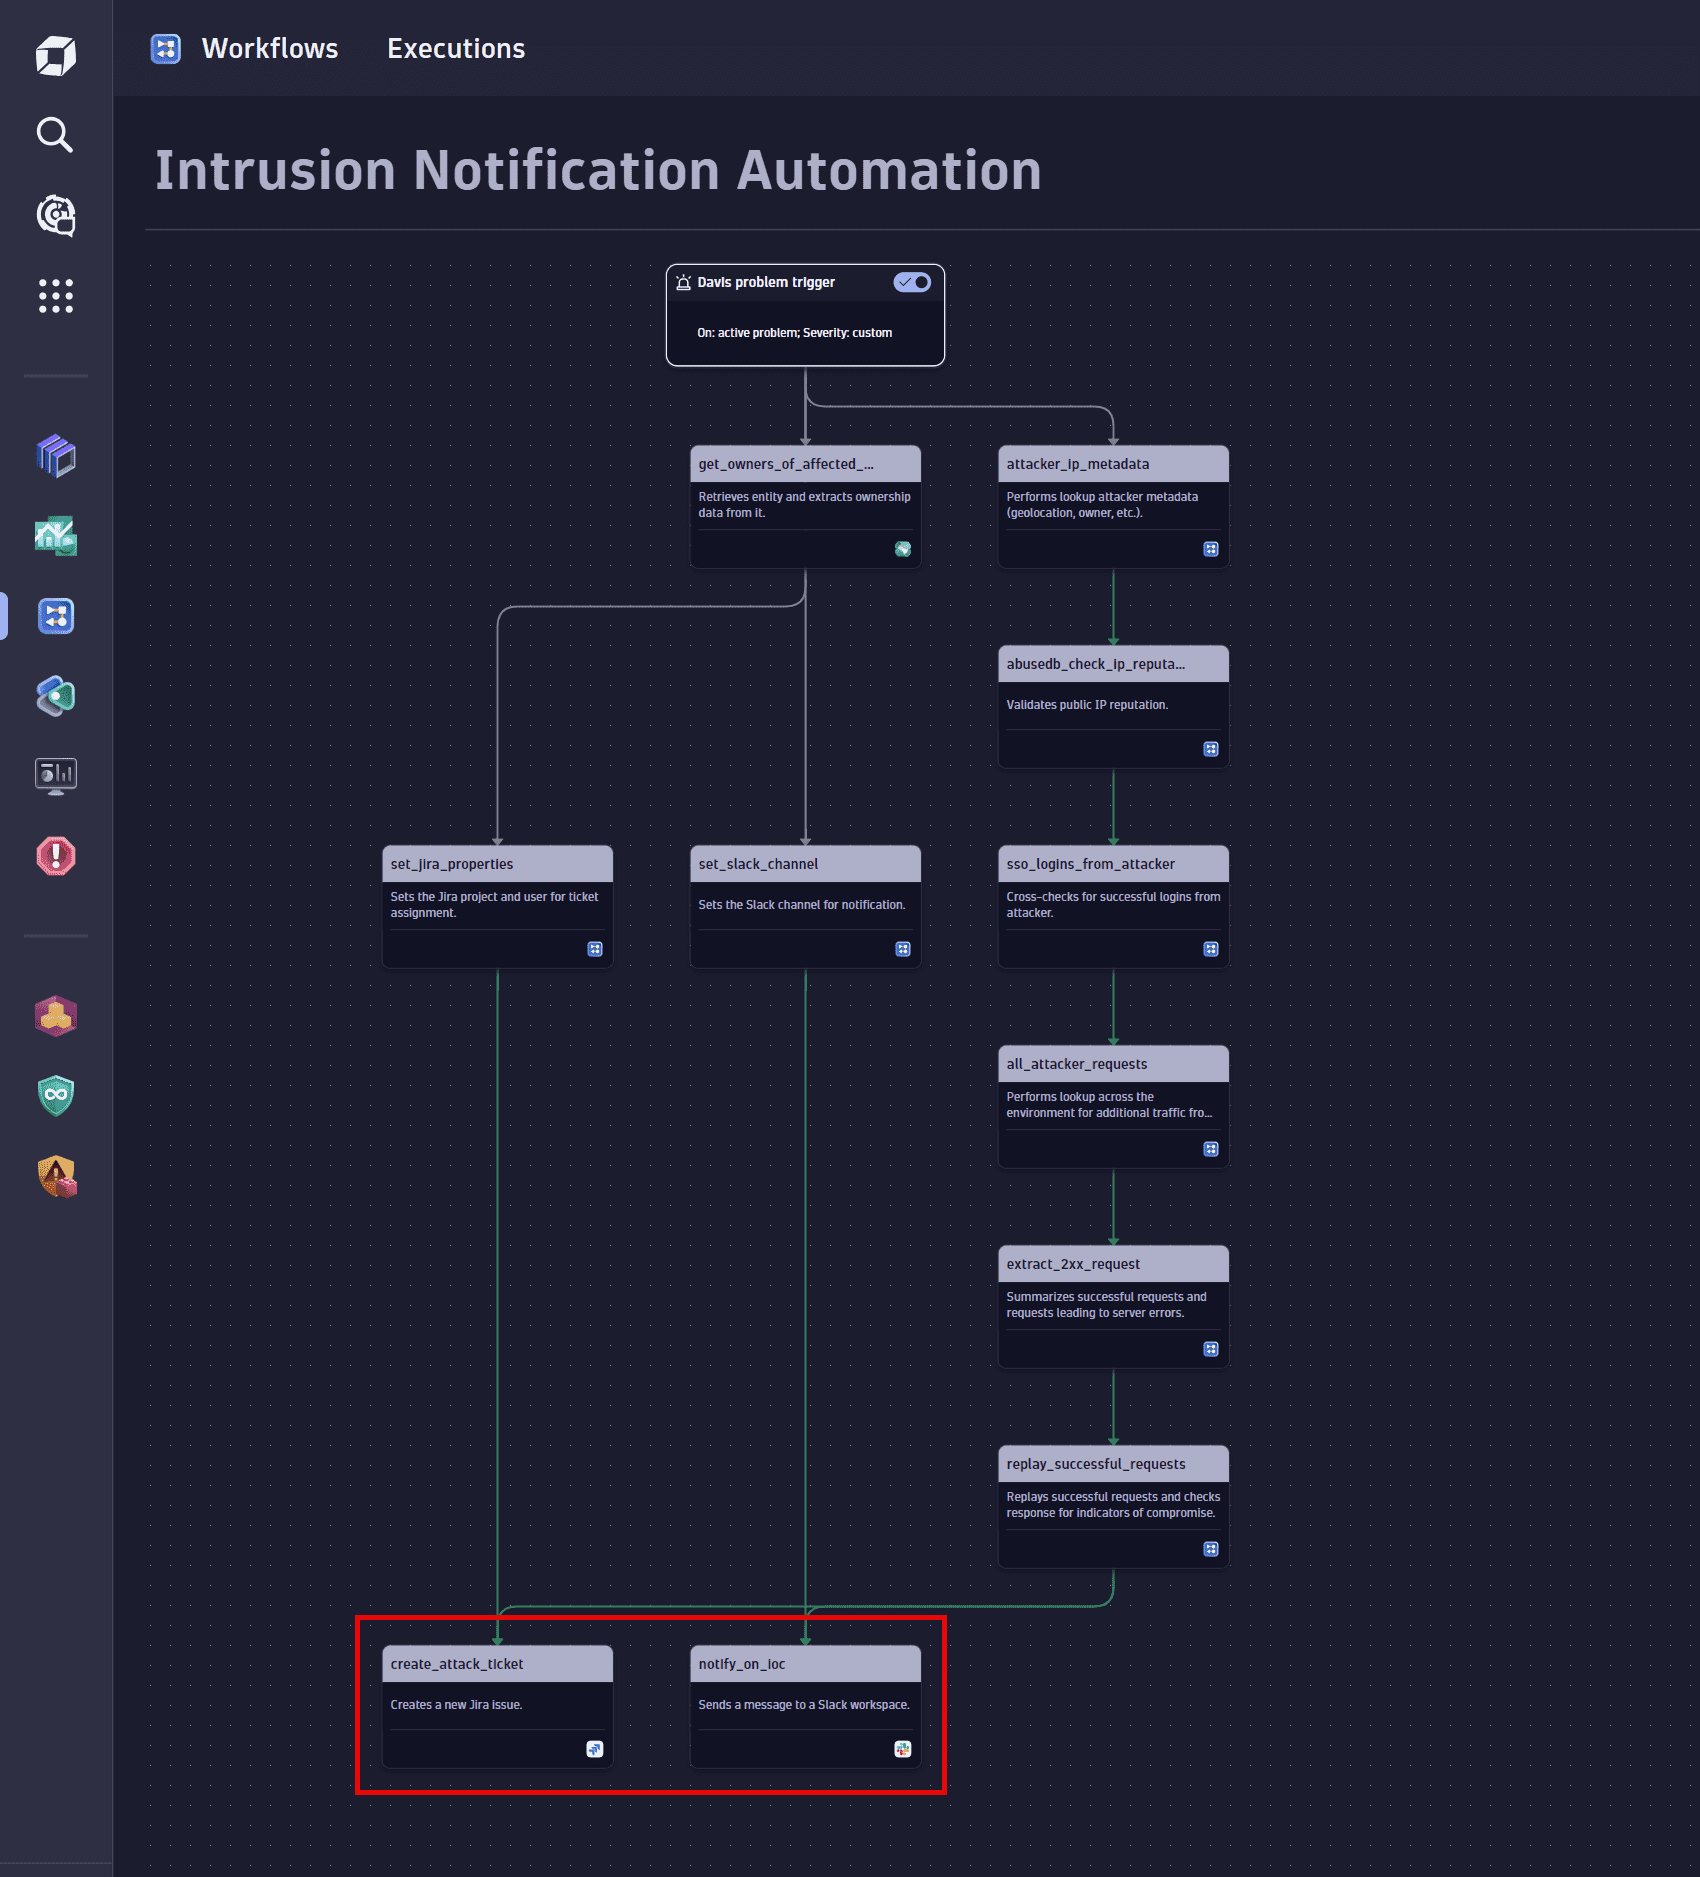
 Send notifications
-
Notify the responsible team on Slack.
Select the Send message action to create and configure this task. For details, see Use Workflows with Slack.
-
Create a Jira ticket for the entity owner containing the collected information.
Select the Create issue action to create and configure this task. For details, see Create Jira issues with workflows.
2. Instant queries
After receiving the notification, the security team can immediately respond to discoveries and instantly run additional DQL queries in Notebooks without knowing beforehand where the information they're looking for is. In an emergency situation, this is crucial, as a speedy response can ensure that the attack can be contained.
The following are some examples of how you can query Grail in case of a web attack.
Logs from the attacker IP address
Query example:
fetch logs, scanLimitGBytes:-1| filter log.source == "/var/log/nginx/access.log"| filter net.peer.ip == "<<IP ADDRESS>>"| sort timestamp desc
Successful web requests from the attacker IP address
Query example:
fetch logs, scanLimitGBytes:-1| filter log.source == "/var/log/nginx/access.log"| filter net.peer.ip == "<<IP Address>>"| filter http.status_code == "200"| sort timestamp desc
Status codes and response codes overview
Query example:
fetch logs, scanLimitGBytes:-1| filter log.source == "/var/log/nginx/access.log"| filter net.peer.ip == "<<IP Address>>"| summarize requests=count(), by:{http.status_code, http.user_agent}| sort http.status_code
Payloads used by the attacker IP address
Query example:
fetch logs, scanLimitGBytes:-1| filter log.source == "/var/log/nginx/access.log"// Successful requests only| filter http.status_code == "200"| filter net.peer.ip == "<<IP Address>>"| summarize requests=count(), by:{http.target}| sort requests DESC
Successful requests from a given IP address sorted by response size
Query example:
fetch logs, scanLimitGBytes:-1| filter log.source == "/var/log/nginx/access.log"| fields timestamp, net.peer.ip, http.target, http.status_code, http.response_content_length, http.user_agent| filter http.status_code == "200"// Filter for a specific IP address| filter net.peer.ip == "<<IP Address>>"| sort toLong(http.response_content_length) DESC
Payloads in access logs (both successful and not successful)
Query example:
fetch logs, scanLimitGBytes:-1| filter log.source == "/var/log/nginx/access.log"| fields payload = "<<PAYLOAD>>", timestamp, net.peer.ip, http.method, http.target, http.status_code, http.request.header.referrer, http.response_content_length, http.user_agent, content| filter contains(content, payload)
Successful SSO logins from the attacker IP address
Query example:
fetch logs, scanLimitGBytes: -1// Search for logins| filter log.source == "/var/log/sso.log"// Search for successful logins from a given IP address| filter contains(content, "user login successful") and contains(content, "<<IP address>>")| sort timestamp desc
Which environments the attacker has logged into
Query example:
fetch logs, scanLimitGBytes: -1// Search for logins| filter log.source == "/var/log/sso.log"// Search for logins from a given account id| filter contains(content, "<<Account ID>>") and contains(content, "tenant: ")| sort timestamp desc
Stay ahead of threats
You can use the above instructions as building blocks to automate common steps in your incidents process. These can help you respond faster to security incidents, thus reducing their impact.